Logistic growth models of China pinks, cultivated on seven substrates,
as a function of degree days
Modelo logístico de crescimento de cravina de jardim cultivada em sete substratos em função da soma térmica
Marília MilaniI Sidinei José LopesII Rogério Antônio BelléII Fernanda Alice Antonello Londero BackesII
ISSN 1678-4596
ABSTRACT
The objective of this study was to characterize the height (H) and leaf number (LN) of China pinks, grown in seven substrates, as a function of degree days, using the logistic growth model. H and LN were measured from 56 plants per substrate, for 392 plants in total. Plants that were grown on substrates formed of 50% soil with 50% rice husk ash (50% S + 50% RH) and 80% rice husk ash with 20% worm castings (80% RH + 20% W) had the longest vegetative growth period (74d), corresponding to 1317.9ºCd. The logistic growth model, adjusted for H, showed differences in the estimation
of maximum expected height (α) between the substrates, with values
between 10.47cm for 50% S + 50% RH and 35.75cm for Mecplant®.
When α was estimated as LN, variation was also observed between the
different substrates, from approximately 30 leaves on plants growing on 50% S + 50% RH to 34 leaves on the plants growing on the substrate formed of 80% RH + 20% W. Growth of China pinks can be characterized using H or LN in the logistic growth model as a function of degree days, being the provided plants adequately fertilized. The best substrates in terms of maximum height and leaf number were 80% soil + 20% worm castings and Mecplant®. However, users must
recalibrate the model with the estimated parameters before applying it to different growing conditions.
Key words: Dianthus chinensis L., growth model, protected environment, parameter estimation.
RESUMO
O objetivo do estudo foi caracterizar a altura (H) e o número de folhas (NF), pelo modelo logístico, de cravina de jardim cultivada em sete substratos em função da soma térmica. Foram avaliadas a H e o NF de 56 plantas por substrato, totalizando 392 plantas ajustadas. As plantas dos substratos compostos de: 50% de solo e 50% de cinzas de casca de arroz (50% S + 50% CA); e 80% cinzas de casca de arroz e 20% húmus de minhoca (80% CA + 20% H) tiveram o maior ciclo, de 74 dias, e o completaram
com soma térmica de 1317,9ºC dia. O modelo logístico ajustado para H apresentou diferenças para a estimativa da altura máxima
esperada (α) entre os substratos, com valores de 10,47cm para
50% S + 50% CA e, 35,75cm, para o substrato Mecplant®. Para
o NF, observou-se que α teve menor variação entre os substratos,
desde aproximadamente 30 folhas, nas plantas do substrato 50% S + 50% CA até 34 folhas, nas plantas do substrato 80% CA + 20% H. O crescimento de cravina de jardim, a partir das variáveis estudadas, pode ser caracterizado pelo modelo logístico, em função da soma térmica acumulada, quando as plantas estão sem restrições nutricionais. Considerando a altura máxima e o número máximo de folhas, os melhores substratos foram o composto de 80% de solo + 20% húmus de minhoca e o Mecplant®. Entretanto, os usuários devem
testar as calibrações do modelo, com os parâmetros sugeridos, antes de aplicar o modelo para outras condições climáticas.
Palavras-chave: Dianthus chinensis L., modelo de crescimento, ambiente protegido, estimação de parâmetros.
INTRODUCTION
The China pinks (Dianthus chinensis
L.) are used in flower gardens due to their early and abundant flowering, especially in spring and fall when the weather is cooler (SAKATA SEED SUDAMÉRICA, 2015). Seedlings are grown in production facilities until the first floral bud opens, when they are sent to retail centers. Therefore, production quality is extremely important because subsequent growth depends on plant vigor as seedlings. Substrates must be evaluated to assess how well they maintain the root system and support overall
IDepartamento de Horticultura e Silvicultura, Universidade Federal do Rio Grande do Sul (UFRGS), 91540-000, Porto Alegre, RS, Brasil.
E-mail: [email protected]. Corresponding author.
IIDepartamento de Fitotecnia, Universidade Federal de Santa Maria (UFSM), Santa Maria, RS, Brasil.
plant health. In addition, they must retain ample water and fertilizer while providing sufficient air for gas exchange around the roots (KAMPF, 2005).
The trend in modern agriculture is to develop models that simulate plant growth, with the objective of detecting factors that may be limiting and; therefore influence the potential productivity of species (LOPES et al., 2004). Simple linear regression is widely used to represent biological phenomena in their early stages.
However, when studying the development of an organism over a longer period, these phenomena can no longer be represented by a linear function. Therefore, nonlinear growth models such as the Spillman, Mitscherlich, logistic (Verhulst), Gompertz, and Richards, among others (REGAZZI, 2003), are advantageous when compared to linear models because they more accurately predict plant growth. Among these, the logistic growth model has been considered the most suitable in recent studies on plant growth (MAIA et al., 2009; PUIATTI et al., 2013; PRADO et al., 2013). Growth predictions for China pinks in different substrates prior to flowering are important for planning commercial production because they will allow growers to estimate distribution dates and calculate when to start production.
The aim of this research was to characterize plant height and leaf number of China pinks grown in seven different substrates, using the logistic growth model.
MATERIALS AND METHODS
The experiment was conducted between April 29 and July 29, 2011, in a Van der Hoeven greenhouse in Santa Maria, Rio Grande do Sul (29º43′S latitude, 53º43′W longitude, 95m above sea level). The experiment was conducted using seven different substrates (treatments, T). By volume, T1 was 50% soil + 50% rice husk ash, T2 was 80% soil + 20% worm castings, T3 was 80% rice husk ash + 20% worm castings, T4 was 40% soil + 40% rice husk ash + 20% worm castings, T5 was 100% peat, T6 was 100% Mecplant® commercial substrate (formed of pine bark, vermiculite, acidity regulator, and fertilizer), and T7 was 50% peat + 50% rice husk ash. A completely randomized experimental design was used, and each of the seven treatments had 56 plants (replicates), for 392 plants. Each plant was grown in a black polythene plastic bag with a height of 8.0cm and a diameter of 8.0cm, corresponding to a volume of 402.12cm3. The plant material used in this experiment was the F1 Dianthus chinensis
L. ‘Diamond’, developed by the company Sakata®. Twenty-eight-day-old seedlings were acquired, each
with approximately three pairs of leaves and a height of 2.5cm. Plants were watered by hand every day to maintain high substrate moisture until the end of the experiment (opening of the first flower bud on the main stem). Macronutrients from the aerial part of the plant were determined during flowering, and the means from three replicates per treatment were compared using the Tukey’s test or the Kruskal-Wallis test (when the assumption of normality of error and/or homogeneity of variances was not met) with a 5% probability of error. Minimum and maximum air temperatures (°C) and relative humidity (%) were recorded daily to characterize the growing environment, using a minimum alcohol thermometer, a maximum mercury thermometer, and a plastic psychrometer. The equipment was placed in the greenhouse, inside a small, white, wooden meteorological instrument shelter, at bench height (0.7m high). Daily mean temperature (Tm) was calculated by averaging maximum and minimum air temperatures (ºC). The daily heat sum (STd, ºCd) was estimated according to KOEFENDER et al. (2008): STd = (Tm – Tb). 1 dia where Tm = daily mean air temperature (ºC) and Tb = base temperature for leaf formation (ºC; 3.9ºC, BLANCHARD & RUNKLE, 2011). The accumulated thermal (STa, ºCd) were added from every day by the sum of STd: STa = ΣSTd.
During the experiment, leaf number and plant height (cm) were evaluated on the main stem of the plants. Leaf number was assessed, three times per week, until new leaves stopped developing. Plant height was measured once a week. Leaves, which have an opposite arrangement on the stem, were counted only when the two apical pairs were separated by at least 1cm along the stem. During the vegetative stage, plant height was measured from the substrate surface to the uppermost leaves on the main stem. In the reproductive stage, height was measured from the substrate surface to the flower bud on the main stem. The plants were measured with a ruler. Growth models are generally developed in three stages: adjusting the regression model by selecting parameters to be estimated, estimating the parameters to check their appropriateness, and validating the model for future predictions or generalizations. The model was adjusted to compare plant height and leaf number among treatments. Growth curves were plotted using the logistic model described by REGAZZI (2003): y = a/{1 + exp (b - gx)}
the accumulated thermal (STa, ºCd) . The software Table Curve 2D v. 2.03 (Jandel Scientific) was used to estimate the parameters in this model, using the Levenberg–Marquardt iteration method for nonlinear least squares. Goodness-of-fit was evaluated using the coefficient of determination (R2) and the mean absolute deviation (DMA) of the residuals:
where Yi is the observed value, Ŷi is the estimated value, and n is the size of the sample.
RESULTS AND DISCUSSION
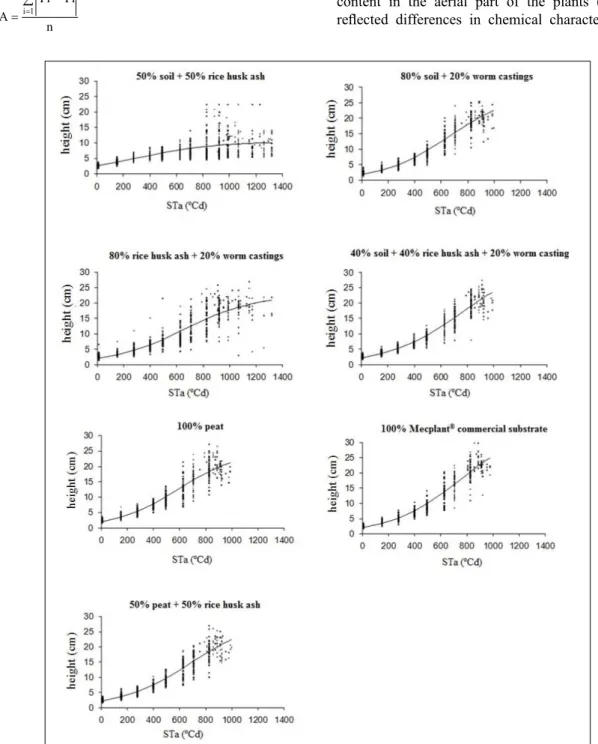
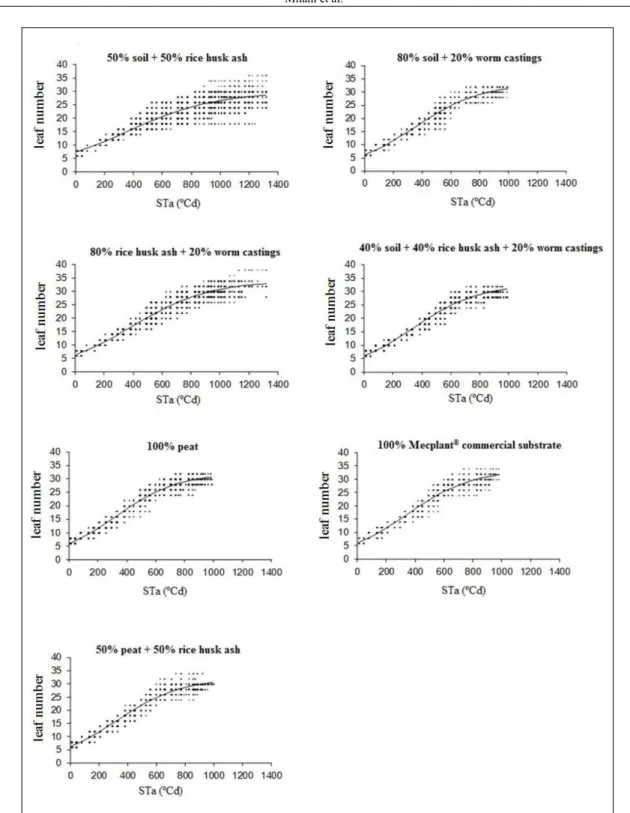
Growth curves for plant height (Figure 1) and leaf number (Figure 2) for China pinks differed
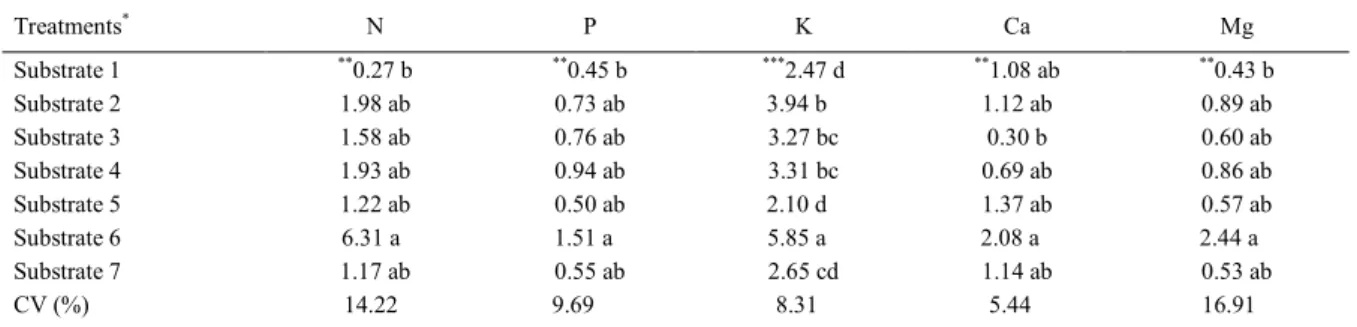
according to the different substrates. Nutrient content in the aerial part of the plants (Table 1)
reflected differences in chemical characteristics of
n
Yi Yi DMA
n
1 i ∑
= ∧
− =
the substrates. Plants from T1 had the lowest nutrient content for the essential macronutrients N (0.27g), P (0.45g), and K (2.47g), and were shorter, with fewer leaves (Figures 1 and 2). N forms bonds in amino acids, promotes vegetative growth, and increases
mass and leaf area (TAIZ & ZEIGER, 2009), while P is essential for energy transfer and protein and nucleic acid synthesis (MALAVOLTA, 2006). K functions as an enzyme activator, regulates cell turgor, and controls stomatal apertures (ALMEIDA et al., 2011). Figure 2 - Growth curves adjusted according to the logistic growth model for leaf number of China pinks in seven differ
The plants in T1 and T3 had the longest
production period (74d), with 1317.9ºCd (Figures 1 and 2). Plants in T2, T4, T5, T6, and T7 began flowering in an average of 54d, with value of (1000ºCd). Carbonized rice husk ashes were at least 50% of the substrate in T1 and T3 and are primarily silica, and as such, fairly alkaline (DEY et al., 2013). A pH above 6.5 severely limits the availability of P and micronutrients (Cu, Zn, Fe, and Mn) in the soil (KAMPF, 2005), and plants delay flowering when P is limiting (MALAVOLTA, 2006). CASTRO et al. (2007), while evaluating the effects of macronutrient deficiencies on peduncles in the genus Heliconia,
reported longer production cycles in plants lacking P, N, or K. According to Liebig’s law of the minimum, all nutrients must be available in the ideal amount and proportion or else production, which will be limited by the element that is proportionally lowest. Generally, the growth curves indicated that the parameters of the logistic growth model were appropriate, with an
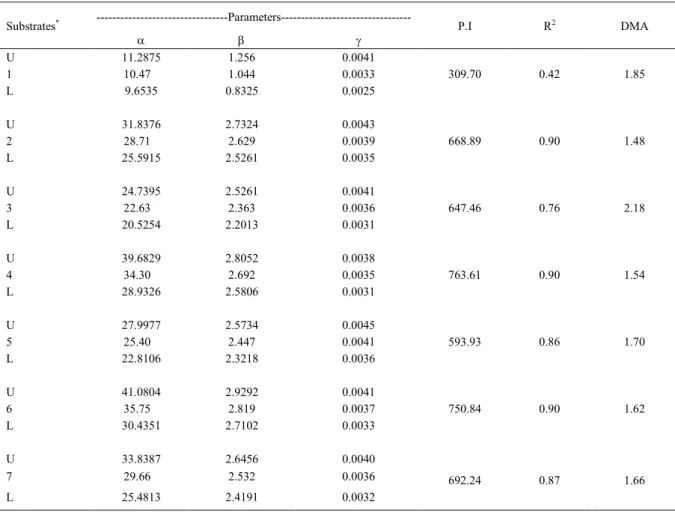
elevated R2 (Tables 2 and 3). Therefore, this model may be used to generate growth curves for the cultivation of China pinks in different substrates. The only exception was the model estimated for plant height in T1, which generated a low R2 (0.42) (Table 2). Growth curves are only accurate when water, light and/or nutrients are not limited, which was not the case for T1, as previously discussed. The DMA of the residuals, which also evaluates model parameters and can compare models, was lowest for plant height in T2 and for leaf number in T7 (Tables 2 and 3), indicating a better fit of the growth curves in these treatments.
The fit of the logistic growth model was better with the leaf number parameter than the plant height parameter in all treatments, with the highest
R2 and the lowest DMA values (Tables 2 and 3). Although the accumulated thermal before flowering were similar for all treatments, the point of inflection (P.I) in the growth curves differed. The differences between the P.Is or the remaining parameters were found by comparing the lower and upper limits of the confidence interval; when confidence intervals overlapped, there was no difference. The growth curve for plant height from T1 had a P.I with the accumulated thermal value (309.70ºCd) were well below those of the other treatments, which averaged 686.16ºCd (Table 2). The maximum leaf accumulation rate was similar for all treatments, with the accumulated thermal value of 344.65ºCd (Table 3). Estimates of a, the maximum expected plant height, varied as a function of treatment. No difference was observed in the estimation of the mean growth rate (g) between the different substrates (Table 2). Using the logistic model, the biggest height estimate (a) was for the plants grown on substrate 6 (35.75cm), but it was not significantly different from the estimates for substrates 2 (28.71cm), 4 (34.30cm) and 7 (29.66cm). The lowest estimated height was for plants grown on substrate 1 (10.47cm) (Table 2). All substrates produced plants that were different (Table 1) from the advertised height of the ‘Diamond’ cultivar (15-20cm, SAKATA SEED SUDÁMERICA, 2015). SOARES et al. (2012), while working with lilies grown on different substrates, observed increases Table 1 - Mean values of macronutrient content (g) in the aerial part of China pinks, in seven different substrates. Santa Maria, Rio Grande
do Sul, Brazil, 2012.
Treatments* N P K Ca Mg
Substrate 1 **0.27 b **0.45 b ***2.47 d **1.08 ab **0.43 b
Substrate 2 1.98 ab 0.73 ab 3.94 b 1.12 ab 0.89 ab
Substrate 3 1.58 ab 0.76 ab 3.27 bc 0.30 b 0.60 ab
Substrate 4 1.93 ab 0.94 ab 3.31 bc 0.69 ab 0.86 ab
Substrate 5 1.22 ab 0.50 ab 2.10 d 1.37 ab 0.57 ab
Substrate 6 6.31 a 1.51 a 5.85 a 2.08 a 2.44 a
Substrate 7 1.17 ab 0.55 ab 2.65 cd 1.14 ab 0.53 ab
CV (%) 14.22 9.69 8.31 5.44 16.91
*
Substrate 1=50% soil + 50% rice husk ash, Substrate 2=80% soil + 20% worm castings, Substrate 3=80% rice husk ash + 20% worm
castings, Substrate 4=40% soil + 40% rice husk ash + 20% worm castings, Substrate 5=100% peat, Substrate 6=100% Mecplant®
commercial substrate (formed of pine bark, vermiculite, acidity regulator, and fertilizer), and Substrate 7=50% peat + 50% rice husk ash.
over the characteristic height of the studied cultivar,
and attributed them to the greenhouse conditions, namely the relatively small difference between diurnal (maximum) and nocturnal (minimum) temperatures, which increases stem length.
The average difference between diurnal temperature (DT) and nocturnal temperature (NT) was 14.1ºC. Additionally, during the experiment, DT was higher than NT, which led to taller plants than normal for the cultivar, with the exception of T1 plants, which were presumably stunted by their lower nutrient content (Table 1). Similarly, FAGUNDES et al. (2007), working with potted sunflowers, observed a difference in the final plant height as a function of the amount of N, whereby the
plants that received the highest dose showed an 8cm
increase in height over the control. The authors also
attributed this height increase to a higher number of leaves and internodes. The estimate of parameter a for leaf number showed relatively low variation between the substrates (Table 3), with the highest number (34.03) from plants grown on substrate 3, which was not significantly different from estimates for plants grown on substrates 2 (33.19) and 6 (33.70). The lowest estimate for the mean rate of leaf production was obtained for plants grown on substrate 1 (0.0031 leaves per ºC per d). Leaf number per plant differed by substrate, and the most fertile substrates produced more leaves, in agreement with GOSEK & CARVALHO (2010).
Table 2 - Estimates of lower (L) and upper (U) limits of confidence intervals for the parameters α, β, e, and γ, point of inflection (P.I, ºCd), coefficient of determination (R2), and absolute mean deviation of the residuals (DMA), of the logistic growth model, adjusted for
plant height (cm), in China pinks grown in different substrates. Santa Maria, Rio Grande do Sul, Brazil, 2012.
---Parameters---Substrates*
α β γ P.I R
2 DMA
U 11.2875 1.256 0.0041
1 10.47 1.044 0.0033
L 9.6535 0.8325 0.0025
309.70 0.42 1.85
U 31.8376 2.7324 0.0043
2 28.71 2.629 0.0039
L 25.5915 2.5261 0.0035
668.89 0.90 1.48
U 24.7395 2.5261 0.0041
3 22.63 2.363 0.0036
L 20.5254 2.2013 0.0031
647.46 0.76 2.18
U 39.6829 2.8052 0.0038
4 34.30 2.692 0.0035
L 28.9326 2.5806 0.0031
763.61 0.90 1.54
U 27.9977 2.5734 0.0045
5 25.40 2.447 0.0041
L 22.8106 2.3218 0.0036
593.93 0.86 1.70
U 41.0804 2.9292 0.0041
6 35.75 2.819 0.0037
L 30.4351 2.7102 0.0033
750.84 0.90 1.62
U 33.8387 2.6456 0.0040
7 29.66 2.532 0.0036
L 25.4813 2.4191 0.0032
692.24 0.87 1.66
*1=50% soil + 50% rice husk ash, 2=80% soil + 20% worm castings, 3=80% rice husk ash + 20% worm castings, 4=40% soil + 40% rice
husk ash + 20% worm castings, 5=100% peat, 6=100% Mecplant® commercial substrate (formed of pine bark, vermiculite, acidity regulator,
The growth curves predicted the highest values for plant height and leaf number with substrates 2 (80% soil + 20% worm castings) and
6 (Mecplant®), probably owing to the absence of carbonized rice husk ash in their composition, the addition of worm castings in substrate 2, which provided more organic matter and nutrients, and
the fertilizers in substrate 6. The increase in dispersion of the values of the variables studied
with the time of evaluation of the plants, observed in the growth curves, occurs with the change in microclimate within the plant community, and the allocation of photoassimilates is differently
distributed in the plant, leading to an increase
in variance between the samples performed in
the same day, as the relative growth of the plant culture increases (LOPES et al., 2004).
CONCLUSION
The growth of China pinks can be characterized using the logistic model, in terms of leaf number or plant height as a function of degree days, when the plants are grown in optimal conditions. The parameters estimates varied with different substrates, and 80% soil + 20% worm castings and Mecplant® growing medium indicated the maximum plant height and leaf number. However, users must calibrate the model with the suggested parameters before applying it to other climactic conditions.
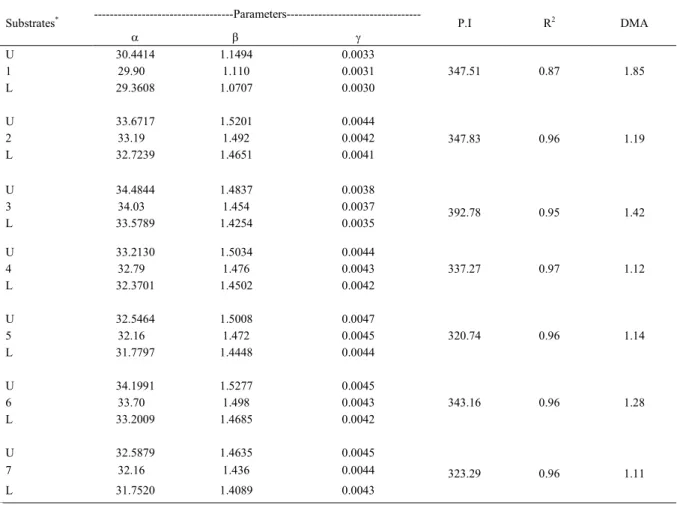
Table 3 - Estimates of lower (L) and upper (U) limits of confidence intervals for the parameters α, β, e, and γ, point of inflection (P.I, ºCd),
coefficient of determination (R2), and absolute mean deviation of the residuals (DMA), of the logistic growth model, adjusted for
leaf number, in China pinks grown in different substrates. Santa Maria, Rio Grande do Sul, Brazil, 2012.
--- Parameters---Substrates*
α β γ P.I R
2 DMA
U 30.4414 1.1494 0.0033
1 29.90 1.110 0.0031
L 29.3608 1.0707 0.0030
347.51 0.87 1.85
U 33.6717 1.5201 0.0044
2 33.19 1.492 0.0042
L 32.7239 1.4651 0.0041
347.83 0.96 1.19
U 34.4844 1.4837 0.0038
3 34.03 1.454 0.0037
L 33.5789 1.4254 0.0035 392.78 0.95 1.42
U 33.2130 1.5034 0.0044
4 32.79 1.476 0.0043
L 32.3701 1.4502 0.0042
337.27 0.97 1.12
U 32.5464 1.5008 0.0047
5 32.16 1.472 0.0045
L 31.7797 1.4448 0.0044
320.74 0.96 1.14
U 34.1991 1.5277 0.0045
6 33.70 1.498 0.0043
L 33.2009 1.4685 0.0042
343.16 0.96 1.28
U 32.5879 1.4635 0.0045
7 32.16 1.436 0.0044
L 31.7520 1.4089 0.0043
323.29 0.96 1.11
*1=50% soil + 50% rice husk ash, 2=80% soil + 20% worm castings, 3=80% rice husk ash + 20% worm castings, 4=40% soil + 40% rice
husk ash + 20% worm castings, 5=100% peat, 6=100% Mecplant® commercial substrate (formed of pine bark, vermiculite, acidity regulator,
REFERENCES
ALMEIDA, T.B.F. et al. Avaliação nutricional da alface cultivada em soluções nutritivas suprimidas de macronutrientes. Revista Biotemas, v.24, p.27-36, 2011. Available from: <http://www.
nutricaodeplantas.agr.br/site/downloads/unesp_jaboticabal/ omissao_alface1.pdf>. Accessed em: Sept. 10, 2015. doi:
10.5007/2175-7925.2011v24n2p27.
BLANCHARD, M.G.; RUNKLE, E.S. Quantifying the thermal flowering rates of eighteen species of annual bedding plants.
Scientia Horticulturae, v.128, p.30-37, 2011. Available from:
<https://www.deepdyve.com/lp/elsevier/quantifying-the-thermal-flowering-rates-of-eighteen-species-of-annual-9KbmW0qNNP>. Accessed: Nov. 20, 2011.
CASTRO, A.C.R. et al. Flower stems postharvest characteristics of heliconia under macronutrients deficiency. Pesquisa Agropecuária Brasileira, v.42, p.1299-1306, 2007. Available from: <http://
www.scielo.br/scielo.php?script=sci_arttext&pid=S0100-204X2007000900012>. Accessed: Sept. 03, 2015. doi: 10.1590/
S0100-204X2007000900012.
DEY, K.P. et al. Organic template-free synthesis of ZSM-5
zeolite particles using rice husk ash as silica source. Ceramics International, v.39, p.2153-2157, 2013.
FAGUNDES, J.G. et al. Growth, development and delay of leaf senescence in pot-grown sunflower (Helianthus annuus L.): sources and rates of nitrogen. Ciência Rural, v.37, p.983-993, 2007.
Available from: <http://www.scielo.br/scielo.php?pid=S0103-84782007000400011&script=sci_arttext>. Accessed: Oct. 15,
2011. doi: 10.1590/S0103-84782007000400011.
GOSEK, C.F.; CARVALHO, R.I.N.de. Culture of Strelitzia reginae
in different substrates. Scientia Agraria, v.1, p.09-18, 2010.
Available from: <http://ojs.c3sl.ufpr.br/ojs/index.php/agraria/article/ view/16074>. Accessed: Mar. 10, 2011. doi: 10.5380/rsa.v11i1.16074.
KAMPF, A. Produção comercial de plantas ornamentais. 2.ed.
Porto Alegre: Agrolivros, 2005. 254p.
KOEFENDER, J. et al. Estimating the phyllochron in
calêndula. Ciência Rural, v.38, p.1246-1250, 2008.
Available from: <http://www.scielo.br/scielo.php?pid=S0103-84782008000500007&script=sci_arttext>. Accessed: May 11,
2011. doi: 10.1590/S0103-84782008000500007.
LOPES, S.J. et al. Models to estimate phytomass accumulation of hydroponic lettuce. Scientia Agricola, v.61, p.392-400, 2004.
Available from: <http://www.scielo.br/pdf/sa/v61n4/22155.pdf>. Accessed: Apr. 14, 2011. doi: 10.1590/S0103-90162004000400007.
MAIA, E. et al. Method of comparison of models non-linear
regression in bananas trees. Ciência Rural, v.9, p.1380-1386, 2009.
Available from: <http://www.scielo.br/scielo.php?script=sci_artt ext&pid=S0103-84782009000500012>. Accessed: Jun. 23, 2011.
doi: 10.1590/S0103-84782009000500012.
MALAVOLTA, E. Manual de nutrição mineral de plantas. São
Paulo: Ceres, 2006. 638p.
PUIATTI, G.A. et al. Análise de agrupamento em seleção de modelos de regressão não lineares para descrever o acúmulo de matéria seca em plantas de alho. Revista Brasileira de Biometria,
v.31, p.337-351, 2013. Available from: <http://jaguar.fcav.unesp. br/RME/fasciculos/v31/v31_n3/A2_Guilherme_PauloCecon. pdf>. Accessed: Sept. 01, 2015.
PRADO, T.K L. et al. Ajuste do modelo logístico na descrição do crescimento de frutos de coqueiro anão por meio de algoritmos iterativos mcmc. Revista Brasileira de Biometria,
v.31, p.216-232, 2013. Available from: <http://jaguar.fcav. unesp.br/RME/fasciculos/v31/v31_n2/A4_Thalita_Joel.pdf>. Accessed: Sept. 05, 2015.
REGAZZI, A.J. Teste para verificar a igualdade de parâmetros e a identidade de modelos de regressão não-linear. Revista Ceres,
v.50, p.9-26, 2003. Available from: <http://www.ceres.ufv.br/ ceres/revistas/V50N287P19303.pdf>. Accessed: Oct. 10, 2011.
SAKATA SEED SUDAMERICA LTDA®. Dianthus F1
diamond. Online. Available from: <http://www.sakata.com.
br/index.php?action=catalogo&cultura=3&language=pt>. Accessed: Mar. 25, 2015.
SOARES, F.C. et al. Water consumption by the lily culture grown
on alternative substrates in protected conditions. Ciência Rural,
v.42, p.1001-1006, 2012. Available from: <http://www.scielo. br/scielo.php?pid=S0103-84782012000600008&script=sci_ arttext>. Accessed: June 17, 2011. doi:
10.1590/S0103-84782012000600008.
TAIZ, L.; ZEIGER, E. Fisiologia vegetal. 4.ed. Porto Alegre: