Vol.46, n. 4 : pp. 545-551, December 2003
ISSN 1516-8913 Printed in Brazil
BRAZILIAN ARCHIVES OF
BIOLOGY AND TECHNOLOGY
A N I N T E R N A T I O N A L J O U R N A L
Comparison between the SPD and the SPDS Methods for
Segregating Generation Advancement in Soybean
Deonisio Destro
*, Henrique Stoco Bizeti, Leandro Anderlin Garcia, Inês Cristina de Batista
Fonseca, Ricardo Montalván and Édison Miglioranza
Department of Agronomia; Universidade Estadual de Londrina UEL; C. P. 6001; 86051990; Londrina PR -Brazil
ABSTRACT
The purpose of this work was to compare the SPD (Single Pod Descent) and SPDS (Single Pod Descent with Selection) methods for segregating generation advancement in soybean breeding. Sixteen populations derived from crosses among Japanese and adapted Brazilian soybean were used. The traits, number of days to flowering (NDF) and to maturity (NDM), plant height at flowering (PHF) and at maturity (PHM), and individual plant yield (IPY) were assessed. The populations obtained by SPDS showed values close to the variation in the populations obtained by SPD. Regression through the origin showed that both methods were equivalent for NDM in the F3 generation and
for NDF in the F4 generation. For all other trait/generation combinations, SPDS yielded superior means. Therefore,
it was preferable to use SPDS because it allowed the advance of generations with smaller population size.
Key words:Glycine max, breeding methods, food type soybean
*
Author for correspondence
INTRODUCTION
Soybean [Glycine max (L.) Merrill] is an
important crop in Brazil due to its large cultivation area in different regions of the country. The importance of soybean worldwide is due mainly to its high oil and protein contents (Marega Filho et al., 2001). Cross-breeding between pure lines is performed in order to obtain new cultivars, usually more productive and/or with other desirable characteristics. The segregating generations may be conducted by any of the methods frequently used for self-fertilization crops: pedigree, bulk, single seed descent (SSD) or single pod descent (SPD). The SSD method is implemented by collecting a single seed from each plant to form the next generation (Brim, 1966). When the number of F2 plants is limited, a method derived
from SSD can be used, in which each plant is represented by multiple seeds in all the segregating generations (Fehr, 1987). To obtain a sample of seeds in which all plants are equally represented in later generations, a pod with 3 seeds is cultivated, characterizing the SPD method. This method is an easy and economic alternative for the advance of segregating populations, aiming at a quick homozygosis.
A modification of the SPD method is the SPDS method (Single Pod Descent with Selection). It is similar to SPD, but no pods are collected from agronomically inferior plants in the F2 to F4
In studies comparing the main advantages and disadvantages of several generation advancement methods, Toledo et al. (1994) concluded that the methods had similar probabilities to generate descendants with high grain yield when the sample of genetic variability was comparable. This explains the preference for simpler methods, such as the SPD. In order to obtain plants with a long juvenile period and based on the information that the inheritance of this character is simple (few genes involved) and that there is the possibility of selecting genotypes with this characteristic under short day conditions, the following procedure has been used in the breeding program at the National Research Center of EMBRAPA - Brazilian Company for Agronomic Research - in Londrina, PR (Kiihl and Garcia, 1989): a) genotypes used in crosses are planted in November and December, to coincide with the flowering period; the crosses are carried out in January and February and the seeds are harvested in March or April; b) the F1 are
cultivated during the winter in greenhouses with supplementary light, for 20-30 days, to avoid early flowering; c) the F2 populations are grown in the
field, with early October planting. One pod is collected per plant, but only from plants with a long
juvenile period (SPDS method); d) the F3
populations are grown during winter, from which one pod per plant is harvested (SPD method); e) the F4 populations are planted early in October, and the
best plants with long juvenile period are harvested individually; f) F5 progenies are grown also in early
October planting, and the best lines are selected. The Brazilian cultivars are not adequate for direct human consumption. To obtain such cultivars, industrial soybean is usually crossed with food type genotypes. Pure lines of food type soybean were developed in Asia (approximately 40° N latitude) and showed a short juvenile period. When they are cultivated in Brazil, where the days are shorter due to low latitude, there is a early flowering. Such fact, associated with the determinate growing habit reduces the number of nodes, plant height and grain yield (Manfredini et al., 1998). Destro et al. (1994) observed that the soybean introduced from Japan had the disadvantage of having low physiological seed quality which reduced the germination and emergence capacity of the seeding in the field. The purpose of this work was to compare the SPD and SPDS methods for segregating generation advancement in soybean cross-breeding for human consumption with industrial soybean.
MATERIAL AND METHODS
The experiment was developed and conducted at the Londrina State University (UEL) School Farm (Londrina, PR, Brazil), located at 23° 22´ LS, 51° 10´ LW and 585 meters above sea level on a structured purple soil, classified as eutrophic. The 16 populations used were supplied by the UEL Soybean Breeding Program (Table 1). Generations advance were accomplished through SPD and SPDS methods.
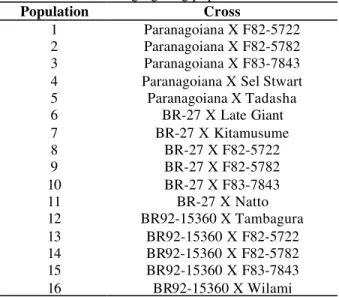
Table 1 - Assessed segregating populations.
Population Cross
1 Paranagoiana X F82-5722 2 Paranagoiana X F82-5782 3 Paranagoiana X F83-7843 4 Paranagoiana X Sel Stwart 5 Paranagoiana X Tadasha
6 BR-27 X Late Giant
7 BR-27 X Kitamusume
8 BR-27 X F82-5722
9 BR-27 X F82-5782
10 BR-27 X F83-7843
11 BR-27 X Natto
12 BR92-15360 X Tambagura 13 BR92-15360 X F82-5722 14 BR92-15360 X F82-5782 15 BR92-15360 X F83-7843 16 BR92-15360 X Wilami
In the F2 generation, a pod containing three seeds
was collected from all the population plants for generation advance and another pod was reserved, using the SPD method. The same procedure was used only on plants with superior agronomic worth (AW), characterizing the SPDS method. The agronomic worth was visually analyzed at maturity. This grade scale varied from one to five, in which one corresponded to a bad plant and five to an excellent one. It represents a visual rate of the plant global merit for a series of adaptative traits such as: number of pods; plant strength and health, resistance to lodging, shattering resistance, and reducted leaf retention after maturity (Guerraet al., 1999). The SPDS method caused a reduction in the population size by the elimination of inferior genotypes, before time and effort were spent on reaching homozygosis. Approximately 15% of the total of plants used initially remained. It is important to emphasize that the selection occurred only in generation F2, as in
In the F3 and F4 generations, the seeds for
generation advancement by the SPD and SPDS methods were sown separately to allow their comparative evaluation. In the agricultural year of 1997/98, the F3 populations were sown in the field
on December 22, in six-meter rows for the SPD method and two-meter rows for the SPDS method. The spacing between the rows was 0.9 meter. Three seeds per plant were harvested from the F3
populations for advance to generation F4, both for
the SPD method and the SPDS method. In the agricultural year of 1998/99, the F4 populations
were sown in the field on December 10. Each population was represented by a five-meter row for the SPD method and a one-meter row for the SPDS method. The spacing between lines was 0.9 meter. The sowing density was 10 plants per linear meter.
In the two agricultural years, the preparation of the soil was conventional, with one plowing and two harrowing. Fertilization was done with 400 kg/ha of NPK, in the 8-28-16 formulation. After the sowing, the fields were hand hoed to control weeds. Insecticides were used to control soybean leaf-shedding caterpillars (Anticarsia gemmatalis) and soybean bugs (Nezara viridula).
In F3 and F4 generations, all plants were harvested
and thrashed individually. Five quantitative characters were assessed to compare SPD and SPDS generation advance methods. These characters were: a) number of days to the beginning of flowering (NDF) corresponding to the period between the sowing and the opening of the first flower (R1 stage of the scale of Fehr and
Caviness, 1977); b) plant height at the beginning of flowering (PHF) which corresponds to the distance in cm measured between the soil level and the most distal inflorescence insertion on the main stem, assessed at the R1 stage; c) number of
days to maturity (NDM) which corresponds to the period between the sowing and the day in which approximately 95% of the pods appeared to be mature (R8 stage); d) plant height at maturity
(PHM) which corresponding the distance (cm) measured from the soil surface and the farthest flower bud on the main stem, evaluated at the R8
stage; and e) individual plant yield (IPY), evaluated after thrashing and by the grain weight. The data were collected in grams per plant, but only in the F4 generation. Still were assessed costs
of labor, breeder’s work and experimental area, but these data are not presented here.
Correlation estimates, means and coefficients of variation of each population were used to compare the methods. Correlation estimates from individual plants among the traits were obtained as described by Mode and Robinson (1959). The significance of the correlationswas tested by the t test, with n-2 degrees of freedom (Venkovsky and Barriga,
1992). The coefficients of variation (cv) were
obtained by:
cv = (standard deviation / mean) * 100.
The mean of each population still was used in the analysis of regression. The regression procedure, which fits a straight line passing through the origin (Bussab, 1990), complemented with the test for hypotheses H0: ß=1 and H1: ß<1 was used. This
procedure evaluated the possibility of substitution of the SPD by the SPDS method in the generation advancement of soybean segregating populations. Whenever hypothesis H0 was accepted by the test,
it meant that the methods were equivalent and whenever it was rejected in favor of H1, it meant
that the methods were not equivalent.
RESULTS AND DISCUSSION
Grain yield has a low heritability in early generations (Bays, 1975). This can be overcome by the use of traits with strong heritability, which have a high association with grain yield. Among these characters, number of days to flowering and maturation and plant height at flowering and maturation, can be mentioned. In our work, the higher number of correlations among these traits and grain yield were significant (Table 2). Positive and significant correlations among these characters also were found for different authors (Weatherspoon and Went, 1934; Weiss et al., 1947; Johnson et al., 1955; Anand and Torrie, 1963; Kwon and Torrie, 1964; Harrison et al., 1981).
Soybean is one of the cultivated species which is most sensitive to photoperiod. Usually the cultivars are adapted to an area with a narrow latitude range and they are sensitive to changes in the sowing date (Kiihl and Garcia, 1989). The F3
generation was sown later than the F4 generation.
This resulted in the F3 populations in a smaller
Table 2 - Correlation estimates among traits assessed in 16 soybean populations in the F3 (diagonal above) and F4 generations (diagonal bellow) obtained by advancing from the F2 by the SPD and the SPDS methods. Data from 1997/98 and 1998/99, respectively a.
PHF NDF PHM NDM
SPD - 0.69** 0.71** 0.36*
PHF
SPDS - 0.74** 0.65** 0.31*
NDF SPD 0.52** - 0.55** 0.22* SPDS 0.64** - 0.68** 0.18ns
PHM SPD 0.62** 0.39* - 0.29* SPDS 0.69** 0.54** - 0.41**
NDM SPD 0.57** 0.47** 0.50** -SPDS 0.48** 0.39* 0.33*
-IPY b SPD 0.22* 0.10ns 0.23* 0.21* SPDS 0.36* 0.19ns 0.35* 0.37* a
PHF: plant height at flowering; NDF: number of days to flowering; PHM: plant height at maturity; NDM: number of days to maturity; IPY: individual plant yield.
b
assessed in seven populations in the F4 generation.
* and ** indicate significance at P<0.05 and P<0.01 by t test,
respectively.
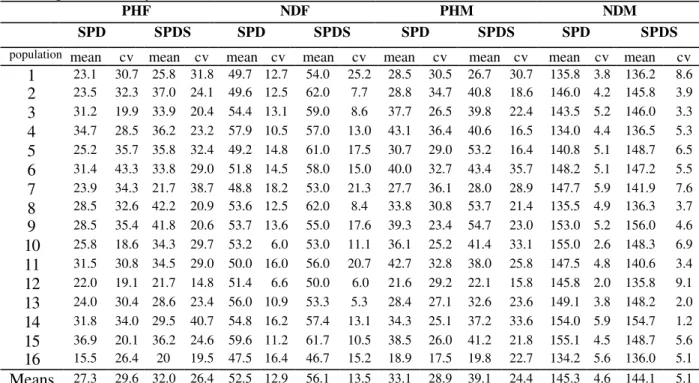
When both methods are compared, the results of the coefficients of variation (Tables 3, 4 and 5) showed that the selection done in the F2 generation
did not affect the variability. The populations conducted by the SPDS method, which suffered a
strong selection in the F2 generation, continued
showing values close to the variation in the populations obtained through the SPD method, which did not suffer any selection. According to Allard (1960), in most hybrids a great number of
genes segregate, and thus, each F2 plant was
different from all the others. This fact explained the maintenance of the variation in the populations obtained by the SPDS method.
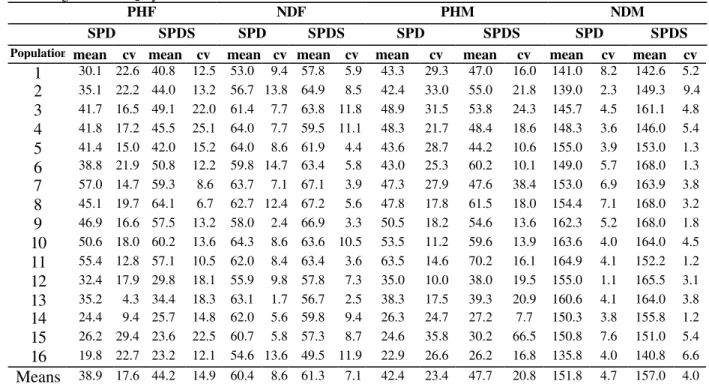
Averages of populations obtained by the SPDS method for all characteristics evaluated were always superior to those obtained by the SPD method (Tables 3, 4 and 5). The only exception was for the NDM character in the F3 generation
(Table 3), where the SPD method had a slightly superior average compared to the SPDS method (145.3 days for SPD and 144.1 days for SPDS). For IPY trait, evaluated only in the F4 generation,
the comparison was only possible in populations where the cross-breeding involved early parents. Populations where the cycle was too long suffered a strong bug attack (Nezara viridula), which made it impossible to evaluate the IPY in these populations. Hence IPY was evaluated in seven populations (Table 5).
Table3 - Means and coefficients of variation (cv) for four traits in 16 populations in theF3 generation obtained by advancing from the F2 by the SPD and the SPDS methods. Data from 1997/98a.
PHF NDF PHM NDM
SPD SPDS SPD SPDS SPD SPDS SPD SPDS
population mean cv mean cv mean cv mean cv mean cv mean cv mean cv mean cv
1 23.1 30.7 25.8 31.8 49.7 12.7 54.0 25.2 28.5 30.5 26.7 30.7 135.8 3.8 136.2 8.6
2 23.5 32.3 37.0 24.1 49.6 12.5 62.0 7.7 28.8 34.7 40.8 18.6 146.0 4.2 145.8 3.9
3 31.2 19.9 33.9 20.4 54.4 13.1 59.0 8.6 37.7 26.5 39.8 22.4 143.5 5.2 146.0 3.3
4 34.7 28.5 36.2 23.2 57.9 10.5 57.0 13.0 43.1 36.4 40.6 16.5 134.0 4.4 136.5 5.3
5 25.2 35.7 35.8 32.4 49.2 14.8 61.0 17.5 30.7 29.0 53.2 16.4 140.8 5.1 148.7 6.5
6 31.4 43.3 33.8 29.0 51.8 14.5 58.0 15.0 40.0 32.7 43.4 35.7 148.2 5.1 147.2 5.5
7 23.9 34.3 21.7 38.7 48.8 18.2 53.0 21.3 27.7 36.1 28.0 28.9 147.7 5.9 141.9 7.6
8 28.5 32.6 42.2 20.9 53.6 12.5 62.0 8.4 33.8 30.8 53.7 21.4 135.5 4.9 136.3 3.7
9 28.5 35.4 41.8 20.6 53.7 13.6 55.0 17.6 39.3 23.4 54.7 23.0 153.0 5.2 156.0 4.6
10 25.8 18.6 34.3 29.7 53.2 6.0 53.0 11.1 36.1 25.2 41.4 33.1 155.0 2.6 148.3 6.9
11 31.5 30.8 34.5 29.0 50.0 16.0 56.0 20.7 42.7 32.8 38.0 25.8 147.5 4.8 140.6 3.4
12 22.0 19.1 21.7 14.8 51.4 6.6 50.0 6.0 21.6 29.2 22.1 15.8 145.8 2.0 135.8 9.1
13 24.0 30.4 28.6 23.4 56.0 10.9 53.3 5.3 28.4 27.1 32.6 23.6 149.1 3.8 148.2 2.0
14 31.8 34.0 29.5 40.7 54.8 16.2 57.4 13.1 34.3 25.1 37.2 33.6 154.0 5.9 154.7 1.2
15 36.9 20.1 36.2 24.6 59.6 11.2 61.7 10.5 38.5 26.0 41.2 21.8 155.1 4.5 148.7 5.6
16 15.5 26.4 20 19.5 47.5 16.4 46.7 15.2 18.9 17.5 19.8 22.7 134.2 5.6 136.0 5.1
Means 27.3 29.6 32.0 26.4 52.5 12.9 56.1 13.5 33.1 28.9 39.1 24.4 145.3 4.6 144.1 5.1
a
Table4 - Means and coefficients of variation (cv) for four traits in 16 populations in theF4 generation obtained by advancing from the F2 by the SPD and the SPDS methods. Data from 1998/99a.
PHF NDF PHM NDM
SPD SPDS SPD SPDS SPD SPDS SPD SPDS
Population mean cv mean cv mean cv mean cv mean cv mean cv mean cv mean cv
1 30.1 22.6 40.8 12.5 53.0 9.4 57.8 5.9 43.3 29.3 47.0 16.0 141.0 8.2 142.6 5.2
2 35.1 22.2 44.0 13.2 56.7 13.8 64.9 8.5 42.4 33.0 55.0 21.8 139.0 2.3 149.3 9.4
3 41.7 16.5 49.1 22.0 61.4 7.7 63.8 11.8 48.9 31.5 53.8 24.3 145.7 4.5 161.1 4.8
4 41.8 17.2 45.5 25.1 64.0 7.7 59.5 11.1 48.3 21.7 48.4 18.6 148.3 3.6 146.0 5.4
5 41.4 15.0 42.0 15.2 64.0 8.6 61.9 4.4 43.6 28.7 44.2 10.6 155.0 3.9 153.0 1.3
6 38.8 21.9 50.8 12.2 59.8 14.7 63.4 5.8 43.0 25.3 60.2 10.1 149.0 5.7 168.0 1.3
7 57.0 14.7 59.3 8.6 63.7 7.1 67.1 3.9 47.3 27.9 47.6 38.4 153.0 6.9 163.9 3.8
8 45.1 19.7 64.1 6.7 62.7 12.4 67.2 5.6 47.8 17.8 61.5 18.0 154.4 7.1 168.0 3.2
9 46.9 16.6 57.5 13.2 58.0 2.4 66.9 3.3 50.5 18.2 54.6 13.6 162.3 5.2 168.0 1.8
10 50.6 18.0 60.2 13.6 64.3 8.6 63.6 10.5 53.5 11.2 59.6 13.9 163.6 4.0 164.0 4.5
11 55.4 12.8 57.1 10.5 62.0 8.4 63.4 3.6 63.5 14.6 70.2 16.1 164.9 4.1 152.2 1.2
12 32.4 17.9 29.8 18.1 55.9 9.8 57.8 7.3 35.0 10.0 38.0 19.5 155.0 1.1 165.5 3.1
13 35.2 4.3 34.4 18.3 63.1 1.7 56.7 2.5 38.3 17.5 39.3 20.9 160.6 4.1 164.0 3.8
14 24.4 9.4 25.7 14.8 62.0 5.6 59.8 9.4 26.3 24.7 27.2 7.7 150.3 3.8 155.8 1.2
15 26.2 29.4 23.6 22.5 60.7 5.8 57.3 8.7 24.6 35.8 30.2 66.5 150.8 7.6 151.0 5.4
16 19.8 22.7 23.2 12.1 54.6 13.6 49.5 11.9 22.9 26.6 26.2 16.8 135.8 4.0 140.8 6.6
Means 38.9 17.6 44.2 14.9 60.4 8.6 61.3 7.1 42.4 23.4 47.7 20.8 151.8 4.7 157.0 4.0
a PHF: plant height (cm) at flowering; NDF: number of days to flowering; PHM: plant height (cm) at maturity; NDM: number of days to maturity. Number of individuals assessed in each population (N) = 50 for SPD method and 10 for SPDS method.
Table 5 - Means and coefficients of variation (cv) for individual plant yield (in grams) in seven populations in the F4 generation, obtained by advancing from the F2 by the SPD and the SPDS methods. Data from 1998/99a.
Weight
SPD SPDS Population
mean cv mean cv
1 12.4 68.15 19.57 47.37
2 11.87 26.62 14.01 94.22
3 5.95 17.98 6.49 39.45
4 6.00 57.33 6.30 80.63
11 1.34 42.54 1.63 29.45
14 3.50 42.29 3.57 54.90
16 3.94 75.13 4.18 77.51
Means 6.42 47.15 7.96 60.50
a
Number of individuals assessed in each population (N) = 50 for SPD method and 10 for SPDS method.
Taking into consideration all average values, 6.42 grams per plant was obtained by the SPD method against 7.96 grams obtained by the SPDS. As appeared from the coefficients of variation of 47.15 for SPD and 60.50 for SPDS, variation was not reduced by SPDS.
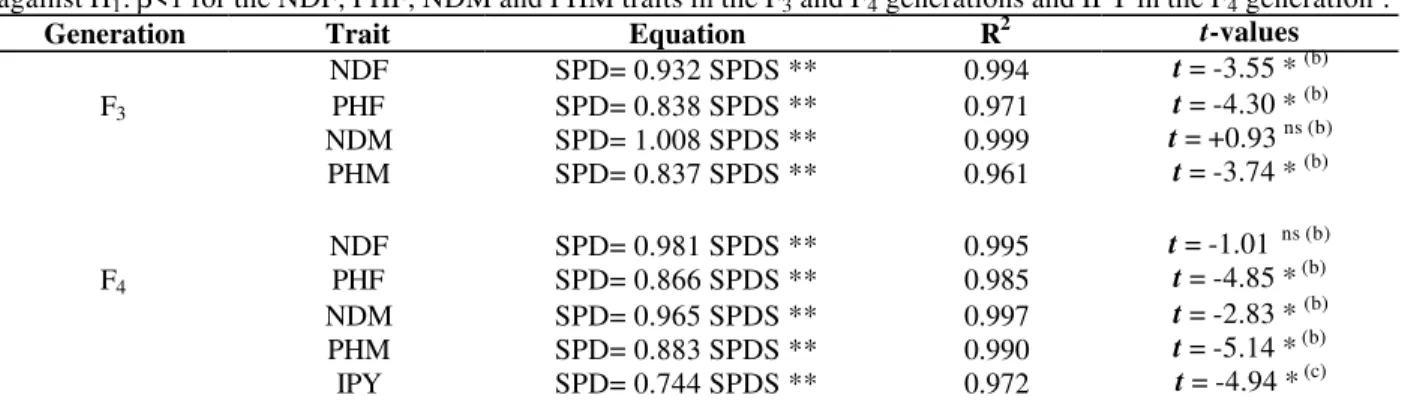
The statistical analysis showed that all regressions were significant and R2 values were very high, which meant that the linear equations explained the results obtained (Table 6). For the NDM trait in generation F3 (average of 145.3 days in SPD
and 144.1 in SPDS) and NDF in generation F4
(60.4 days in SPD and 61.3 in SPDS), the means were too close. In these cases, the t-test considered that the ß equation values corresponded to one. In other words, it did not show significant differences and the two methods yielded equivalent mean values. For the NDF, PHF and PHM traits from F3
generation (Table 3) and PHF, NDM, PHM (Table 4) and IPY (Table 5) from F4 generation, where
the means had bigger differences, the test rejected
the hypothesis H0: ß =1. This meant that the
Table 6 - Linear regression equations with respective determination coefficients and t-values for testing H0: β=1 against H1: β<1 for the NDF, PHF, NDM and PHM traits in the F3 and F4 generations and IPY in the F4 generationa.
Generation Trait Equation R2 t-values
F3
NDF PHF NDM PHM
SPD= 0.932 SPDS ** SPD= 0.838 SPDS ** SPD= 1.008 SPDS ** SPD= 0.837 SPDS **
0.994 0.971 0.999 0.961
t = -3.55 * (b) t = -4.30 * (b) t = +0.93 ns (b) t = -3.74 * (b)
F4
NDF PHF NDM PHM IPY
SPD= 0.981 SPDS ** SPD= 0.866 SPDS ** SPD= 0.965 SPDS ** SPD= 0.883 SPDS ** SPD= 0.744 SPDS **
0.995 0.985 0.997 0.990 0.972
t = -1.01 ns (b) t = -4.85 * (b) t = -2.83 * (b) t = -5.14 * (b) t = -4.94 * (c) a
PHF: plant height (cm) at flowering; NDF: number of days to flowering; PHM: plant height (cm) at maturity; NDM: number of days to maturity; IPY: individual plant yield (g)
bt
( 0,05; 15) = 1,75 (one-tailed test) ct
( 0,05; 6) = 1,94 (one-tailed test)
** significant at the 1% level of probability.
This procedure has been efficient in conducting segregating populations for the development of new cultivars with long juvenile period, based on the SPDS method in the F2 generation (Kiihl and Garcia, 1989).
SPD and SPDS methods are modifications of the SSD method, and they both allow the fast advancement of generations, making it possible to obtain two generations per year (Kiihl and Garcia (1989). Boerma and Cooper (1975) compared the SSD method with the pedigree and the early generation test methods, these two with selection in the F2 generation. The authors observed that the
SSD method was the most efficient since it was fast in the advancement of generations and required less effort in the selection process. In this method, the selection is accomplished only in advanced generations, when it is more efficient. The methodology used in our work showed that although there was a selection in generation F2
with SPDS method, it did not demand great efforts as in the pedigree and the early generation test methods. The SPDS method allowed the use of smaller population sizes. It reduced labor, breeder’s work and experimental area in comparison to the SPD method.
CONCLUSIONS
The populations produced by SPDS tended to have higher means than those produced by SPD. The SPDS method maintained a fenotipic variation comparable to that of the SPD method, even when
selection for high heritability traits correlated with grain yield was practiced in the F2 generation.
Thus it was possible to replace the SPD method by the SPDS method in soybean breeding.
ACKNOWLEDGEMENTS
The authors thank CNPq and CAPES for grants and financial support.
RESUMO
Este trabalho objetivou comparar os métodos de avanço de gerações segregantes SPD (vagem única por planta) e SPDS (vagem única por planta selecionada) no melhoramento da soja. Foram utilizadas 16 populações oriundas de cruzamentos de genótipos japoneses com brasileiros adaptados. Os caracteres número de dias para o florescimento (NDF) e para maturação (NDM), altura da planta no florescimento (PHF) e na maturação (PHM) e produtividade por planta individual (IPY) foram avaliados. As populações obtidas pelo método
SPDS
continuaram a apresentar valores de
variabilidade próximos aos das populações
obtidas pelo método SPD.
A regressão linear (reta passando pela origem) mostrou que paraNDM na geração F3 e NDF na geração F4, os
o avanço de gerações com populações de menor tamanho comparado ao SPD, além de proporcionar ganho genético.
REFERENCES
Allard, R. W. (1960), Principles of plant breeding. John Wiley and Sons, New York.
Anand, S. C. and Torrie, J. H. (1963), Heritability of yield and other traits and interrelationships among traits in the F3 and F4 generation of three soybean crosses. Crop Science, 3, 508-511.
Bays, I. A. (1975), Heritability and association of several quantitative characters in segregating populations of soybeans [Glycine max (L.) Merrill]. PhD Thesis, Mississipi State University, Mississipi, USA.
Boerma, H. R. and Cooper, R. L. (1975), Comparison of three selection procedures for yield in soybeans.
Crop Science, 15, 225-229.
Brim, C. A. (1966), A modified pedigree method of selection in soybeans. Crop Science, 6, 20.
Bussab, W. 0. (1990), Modelos Especiais. In: _____.
Análise de variância e de regressão. São Paulo : Atlas. pp.73-81.
Destro, D.; Guerra, E. P.; Vello, E. P. and Moreira, L. M. (1994), Melhoramento genético da soja com sementes grandes. Revista Brasileira de Genética (Supplement), 17, 336.
Fehr, W. R. (1987), Soybean. In: Fehr, W. R. (ed.).
Principles of cultivar development, v. 2. New York : Macmillan Publishing. pp. 533-576.
Fehr, W. R. and Caviness, C. E. (1977), Stages of soybean development. Iowa State University. Special Report 80. 12 pp.
Guerra, E. P.; Destro, D.; Miranda, L. A. and Montalván, R. (1999), Performance of food-type genotypes and their possibility for adaptation to Brazilian latitudes. Pesquisa Agropecuária Brasileira, 34, 575-583.
Harrison, S. A.; Boerma, H. B. and Ashley, D. A. (1981), Heritability of canopy-apparent photosynthesis and its relationship to seed yield in soybeans. Crop Science, 21, 222-226.
Johnson, H. W.; Robinson, H. F. and Comstock, R. F. (1955), Estimates of genetic and environmental variability in soybeans. Agronomy Journal, 47, 313-314.
Kiihl, R. A. S. and Garcia, A. (1989), The use of long juvenile trait in breeding soybean cultivars. Paper presented at 4th Conferencia Mundial de Investigación en Soja, Buenos Aires, Argentina.
Kwon, S. H. and Torrie, J. H. (1964), Heritability and interrelationships among traits of two soybean populations. Crop Science, 4, 196-198.
Mannfredini, E.; Destro, D.; Homechin, M.; Sachsida, G. and Miglioranza, E. (1998), Alternatives to sowing vegetable types soybeans. Brazilian Archives of Biology and Technology, 41, 429-436.
Mode, J. C. and Robinson, H. F. (1959), Pleiotropism and genetic variance and covariance. Biometrics, 15, 518-537.
Marega Filho, M.; Destro, D.; Miranda, L. A.; Spinosa, W. A.; Carrão-Panizzi, M. C.; Montalván, R. (2001), Relationships among oil content, protein content and seed size in soybeans. Brazilian Archives of Biology and Technology, 44, 23-32.
Toledo, J. F. F.; Almeida, L. A.; Kiihl, R. A. S.; Carrão-Panizzi, M. C.; Kaster, M.; Miranda, L. C. and Menosso, O. G. (1994), Genetics and breeding. In: Tropical Soybean: Improvement and Production. Food Agriculture Organization of the United Nations, Rome. pp. 19-36.
Venkovsky, R. and Barriga P. (1992), Genética biométrica no fitomelhoramento. Sociedade Brasileira de Genética, Ribeirão Preto.
Weatherspoon, J. H. and Wentz, J. B. (1934), A statistical analysis of yield factors in soybeans.
Agronomy Journal, 26, 524-531.
Weiss, M. G.; Weber, C. R. and Kalton, R. R. (1947), Early generation testing in soybeans. Agronomy Journal, 39, 791-811.