T
he Pioneer North region, of Paraná state, Brazil, covers 23 municipalities, of which 15 produce tomato under protected environment.The region has 160 producers of tomatoes in greenhouse, totaling an area of 22.5 ha of covered area with 450 greenhouses. Several hybrids are grown in the region, highlighting Colibri, Débora Max, Pizzadoro and Granadero, the first one being the most cultivated hybrid for its ease of placing on the market (EMATER, 2011).In this growing environment, to use an appropriate nutrient quantity is
fundamental, because the indiscriminate use favors the chemical imbalance of the soil, causing damages in the crop and environment.
In this region, the most common way to evaluate the nutritional needs of the plants is performing only chemical analysis of the soil. The leaf analysis can also be used in fertilizer management (Wadt, 2009), the results are compared to the tabulated indices and nutrient levels analyzed in isolation, though (Embrapa, 2011). Although the Diagnosis and Recommendation Integrated System (DRIS), which relates
the nutrient contents and analyzes them in pairs, on the grounds of Physiological Diagnosis (Beaufils, 1957) exists since 1956, this method is still not widely used and disseminated to field technicians. However, good prospects for its use in Brazil, according to the results for some crops such as coffee, are noticed (Barbosa et al., 2006), cupuaçuzeiro (Dias, 2010), bean (Creste & Echer, 2010) and mango (Pinto et al., 2009).
Nevertheless, the studies using DRIS in tomato are rare in international literature and no study to be used as comparative can be found (Takahashi
Diagnosis and recommendation integrated system (DRIS) of tomato in
greenhouse
Cesar L Scucuglia; José E Creste
Universidade do Oeste Paulista (UNOESTE) Campus II, Rod. Raposo Tavares, km 572, 19067-175 Presidente Prudente-SP; scucuglia@ emater.pr.gov.br; [email protected]
ABSTRACT
Plant nutrition is one of the most important factors for successful cultivation of tomatoes, especially in the greenhouse, and Diagnosis and Recommendation Integrated System (DRIS) is an alternative for fertilizer recommendation. This study aimed to establish DRIS norms for tomato plants growing in greenhouse located at Norte Pioneiro do Paraná region (Paraná State, Brazil). Chemical analysis of nutrients on leaves (N, P, K, Ca, Mg, S, B, Cu, Fe, Mn and Zn) of hybrid tomatoes (Colibri, Pizzadoro, Debora Max and Granadero), and respective yields of 61 growing areas in greenhouses (24.4 ha) were used. Samples were collected during April to December 2010, in five cities. Five levels of tomato yield (6, 7, 8, 9, and 10 kg plant-1)
were used for establishing a database with all binary relationships among all the nutrients studied in all samples. The average, standard deviation and variance for each concentration of nutrient were calculated and it was done for relationship among nutrients, also, in each sub-population. We used 55 relationships which showed the highest ratio in the variance between sub-populations. The nutritional content of each nutrient and the nutrient balance index (IBN) of each production level were calculated. The best correlation between IBN and tomato yield was obtained with 8 kg plant-1 of tomato and this
value was defined as an index to be used for DRIS. The nutritional diagnosis carried out in crops with yields below 6 kg plant-1 showed
relative deficiencies of K and B and relative excess of Mg.
Keywords: Solanum lycopersicum, foliar diagnosis, nutritional balance, plant nutrition, nutrient.
RESUMO
Sistema Integrado de Diagnose e Recomendação (DRIS) na cultura do tomateiro em cultivo protegido
Um dos fatores de maior importância ao sucesso do cultivo do tomateiro é a nutrição da planta, especialmente em cultivo protegido, sendo o Sistema Integrado de Diagnose e Recomendação (DRIS), uma alternativa para recomendação de adubação dessa cultura. Objetivou--se estabelecer normas DRIS para a cultura do tomateiro em cultivo protegido na região Norte Pioneiro do Paraná. Foram utilizados teores de nutrientes (N, P, K, Ca, Mg, S, B, Cu, Fe, Mn e Zn) em folhas de híbridos de tomate (Colibri, Pizzadoro, Débora Max e Granadero) e as respectivas produtividades de 61 lavouras cultivadas sob estufas com cobertura plástica (24,4 ha). Para a formação do banco de dados foram utilizados cinco níveis produtivos (6, 7, 8, 9, e 10 kg planta-1),
com o estabelecimento de todas as relações binárias entre os nutrien-tes estudados em todas as amostras. Com esnutrien-tes dados, calculou-se a média, o desvio padrão e a variância para cada concentração de nutriente e para as relações entre estes, em cada subpopulação. Foram mantidas 55 relações que apresentaram a maior razão na variância entre as subpopulações. Calculou-se o índice nutricional de cada nutriente e o índice de balanço nutricional (IBN) de cada nível pro-dutivo. Definiu-se assim a produção de 8 kg planta-1 como índice a
ser usado por ser o que apresentou melhor correlação entre o IBN e as produções analisadas, sendo as normas DRIS estabelecidas utili-zando este padrão de produção. O diagnóstico nutricional realizado em lavouras com produtividades abaixo de 6 kg planta-1 mostrou
deficiências relativas de K e B e excesso relativo de Mg.
Palavras-chave: Solanum lycopersicum, balanço nutricional, nutrição de plantas, nutrientes.
& Andrade, 2010). One of the few exceptions is the study by Hartz et al. (1998) with DRIS norms, derived from the survey of more than 100 commercial crops of tomatoes for industrial use in California, EUA, with productivity exceeding 90 t/ha. In Brazil, Oliveira
et al. (2009) studied the efficiency of
nutrient absorption and response to fertilization in tomato lines.The study classified the lines according to the efficiency of nutrient absorption and response to fertilization based on DRIS index value and in the productivity increments.
Due to the lack of knowledge of DRIS on the tomato crop, coupled with the success found by using the system on several crops, this work aimed to establish DRIS norms in tomato crops grown in protected environment in the Pioneer North region in Paraná State.
MATERIAL AND METHODS
The study was carried out in greenhouses with tomatoes in eutrophic Red Oxisol (Embrapa, 2013) in the Pioneer North region in Paraná, involving the municipalities Barra do Jacaré, Cambará, Joaquim Távora, Santo Antonio da Platina and Siqueira Campos with average annual rainfall and temperature between 1200-1600 mm and 20-22oC (IAPAR, 2011),
respectively. The main tomato hybrids (Colibri, Pizzadoro, Débora Max and Granadero) used in Brazil (Alvarenga, 2004) were also used in the region of the study which consisted of the collection of the leaves for chemical analysis of macronutrients (N, P, K, Ca, Mg and S) and micronutrients (B, Cu, Fe, Mn and Zn).
The tomato was grown at a spacing of 0.30 m between plants and 1.30 m between rows and the cultural practices were used and recommended by regional technical assistance. The leaf samples for chemical analysis were collected from April to December of 2010 in the greenhouses with plastic covering. Sixty one leaf samples were used, from 32 producers of tomato grown with fertigation in greenhouse, comprising a covered area of 24.4 ha.
One leaf per plant was collected; ten samples of leaves were collected per plot, without petiole, obtained in the fifth or sixth hand/flower, according to the methodology described by Malavolta et al. (1997). Leaves
of plants located on the center line of the greenhouse were collected, discarding the sidelines and border lines. After drying the plant material in greenhouse with forced air ventilation, the chemical determination of macro and micronutrients was performed, according to the methodology described by Malavolta et al. (1997). The results
were used to create a database as well as the productivity per plant in each greenhouse.
After creating the database, the DRIS leaf norms were developed, according to the methodology described by Beaufils (1973) and Walworth & Sumner (1987). The database were divided in two subpopulations depending on the productive level: A (high productivity) and B (low productivity). Then, all the nutrients were expressed in all possible relationships between them and finally, the averages (XA and XB) were calculated, the standard deviation (SdA and SdB) and the variances (S2
A
and S2
B) for each nutrient concentration
and for the relationships between them, for each subpopulation, using the calculation methodology proposed by Gomes (1981).
Foliar standards for tomato were defined from productivity groups and for each group two different production levels were considered: The high production group, called subpopulation A and the low production group, called subpopulation B. According to this principle, 5 levels of productivity were established: >6, >7, >8, >9 and >10 kg plant-1, considered high productivities.
T h e v a r i a n c e r a t i o s b e t w e e n subpopulations were compared to all models of expression of binary relationships between nutrients and, those which showed largest ratio of variance between low production subpopulations on high production ones were preserved. In total, 110 nutritional relationships were obtained, being considered only 55 relationships through calculation cited in Walworth
& Sumner (1987).
Values of intermediate functions were calculated using the formula defined by Jones (1981), complemented by the methodology presented by Hallmarck et al. (1987), which includes the dry matter coefficient. The indexes obtained through DRIS method are results of an equation which includes all the nutrients studied in a function of relationship among them. This equation aims to compare all the elements in the diagnosis. Nutrients that appear in the denominator of the ratio will take the positive sign, and negative, if they appear in the numerator (Píperas et al., 2009).
After calculating the indexes of each nutrient, the authors evaluated which nutrient or nutrients would be limiting the maximum production and crop development. According to Walworth & Sumner (1987), the greater the deficiency of one nutrient, more negative is the index value in relation to other nutrients. An index with high and positive value indicates that the corresponding nutrient is in excessive amounts. Theoretically, all indexes should be equal to zero so that proper nutritional balance occurs.
Beaufils (1973) states that the sum of the absolute values of all diagnosis indexes (Nutritional Balance Index, IBN) found are inversely related to production. So, greater intensities imbalances between nutrients will be noticed when the value of the IBN of a sample is larger. Based on this statement and reviewing one of the basic concepts of DRIS, with respect to Nutritional Balance Index, the authors tried to use this indicator in order to help define the productive level of the subpopulation A that will establish the DRIS norms (Creste & Echer, 2010).
RESULTS AND DISCUSSION
In several studies related to nutrition of tomato, independent of cropping system, productivities above 6 kg plant-1
are considered high (Embrapa, 2011). In this work, the production ranged from 4.18 to 12.96 kg plant-1. Five
(6, 7, 8, 9 and 10 kg plant-1) with
respective numbers of observation for each level, the percentages related to the total number of samples, of each hybrid (Table 1), for high production subpopulations (A) and low productivity subpopulations (B). The samples with inferior productivity in each productive level used were also presented to the subpopulation B. For the productive levels >10, >9, >8, >7 and >6 kg plant-1,
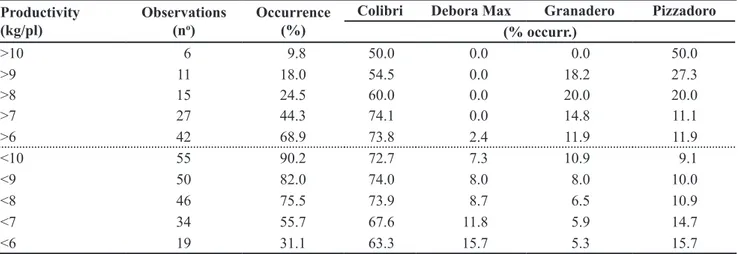
alternations occurred between the nutrient contents (Table 2) with higher values, sometimes in the population of greater production (A), sometimes in the population of lower production (B). A predominance of genetic material “Colibri”, with 70.5% of representativeness, occurred, followed by ‘Pizzadoro’ (13.2%), ‘Granadero’ (9.8%) and ‘Débora Max’ (6.5%). In
the stratification of the production levels, the predominant presence of hybrid ‘Colibri’ occurred, except in the production level above 10 kg plant-1.
The correlation coefficient between IBN and the productivity of each productive level was presented at Table 2, where, the cutoff equal or higher than 8.0 kg plant-1 shows the
correlation coefficient –0.571. Through this methodology, the study defined that the DRIS norms for tomato grown in a protected environment would be derived from greenhouses whose productivity was equal to or greater than 8.0 kg plant-1. In this stratification,
a homogeneous composition of the representativeness of genetic material was noticed, that means, 60% of ‘Colibri’, 20% of ‘Granadero’ and 20% of ‘Pizzadoro’. This productive level
represents 24.5% of the samples which make up the database. Malavolta et al. (1997) recommend at least 20% of the database belonging to the subpopulation A. However, Walworth & Sumner (1987) state that foliar norms developed from a small database can be used, since, according to the authors, the use of a small database, but with extremely high productions, can be an efficient means and relatively inexpensive to generalize optimal concentrations of nutrients in plants. On the other hand, Beaufils (1973) states that one established methodology for defining the cutoff between the two subpopulations does not exist, and the most important is the validity of the final results obtained.
The DRIS norms established in this study were applied in 19 samples of tomato leaves which obtained
Table 1. Distribution of number of observations per level of productivity and occurrence of hybrids for defining the DRIS norms (distri -buição de número de observações por nível de produtividade e ocorrência por híbrido para a definição das normas do DRIS). Presidente Prudente, UNOESTE, 2012.
Productivity (kg/pl)
Observations (no)
Occurrence (%)
Colibri Debora Max Granadero Pizzadoro (% occurr.)
>10 6 9.8 50.0 0.0 0.0 50.0
>9 11 18.0 54.5 0.0 18.2 27.3
>8 15 24.5 60.0 0.0 20.0 20.0
>7 27 44.3 74.1 0.0 14.8 11.1
>6 42 68.9 73.8 2.4 11.9 11.9
<10 55 90.2 72.7 7.3 10.9 9.1
<9 50 82.0 74.0 8.0 8.0 10.0
<8 46 75.5 73.9 8.7 6.5 10.9
<7 34 55.7 67.6 11.8 5.9 14.7
<6 19 31.1 63.3 15.7 5.3 15.7
Table 2. Average values of nutrients in tomato leaves at different productivities and correlations between IBN and production (valores médios de nutrientes em folhas de tomateiro em diferentes produtividades e correlações entre IBN e produção). Presidente Prudente, UNOESTE, 2012.
Cutoff value (kg/pl)
Correlation (IBN x production)
Sub population
Macronutrients (g/kg) Micronutrients (mg/kg)
N P K Ca Mg S B Cu Fe Mn Zn
10 0,0130 A 34.5 5.6 47.9 33.3 7.4 9.8 29.2 122.7 168.2 147.4 54.9
B 36.2 5.5 41.1 24.7 5.6 8.1 31.2 118.5 229.7 143.1 37.6
9 0,1170 A 36.1 5.8 44.6 28.8 6.0 8.9 40.8 122.4 255.8 140.7 49.9
B 36.1 5.4 41.1 24.8 5.8 8.1 28.8 118.1 216.6 144.2 36.9
8 -0,5710 A 36.4 5.8 43.4 27.4 5.7 8.6 38.9 194.7 251.8 155.5 50.3
B 36.0 5.4 41.3 25.0 5.8 8.2 28.6 96.3 215.3 140.0 36.0
7 -0,0151 A 35.7 5.7 41.3 25.1 5.4 8.1 34.3 127.6 245.0 149.8 44.7
B 36.3 5.3 42.2 25.9 6.1 8.4 28.4 111.9 206.8 138.6 34.9
6 -0,1006 A 36.1 5.7 41.8 25.3 5.6 8.1 33.4 131.4 232.1 151.2 42.4
productivity lower than 6 kg plant-1 and
so the authors tried to diagnose nutrients in excess and deficiency related to this excess of nutrients among the samples which represent 31.1% of the database.
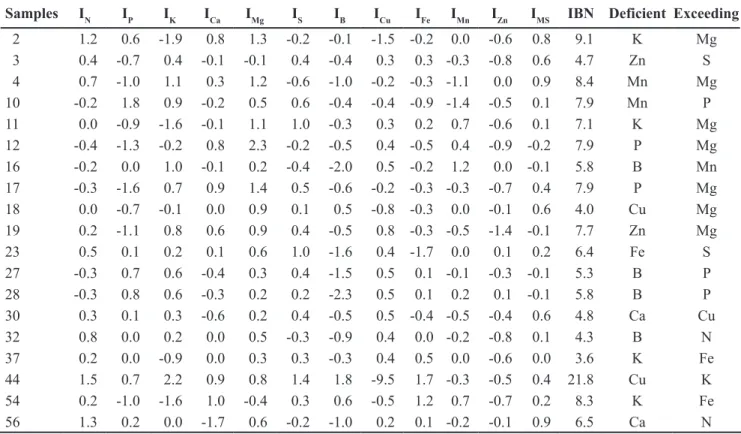
For the 19 data sampled in tomato plants in greenhouse (Table 3) with production lower than 6 kg plant-1,
which defines the number of sample (column 1), nitrogen (IN, column 2), phosphorus (IP, column 3), potassium (IK, column 4), calcium (ICa, column 5), magnesium (IMg, column 6), sulfur (lS, column 7), boron (IB, column 8), copper (ICu, column 9), iron (IFe, column 10), manganese (IMn, column 11), and zinc (Izn, column 12), of dry matter indexes (Idm, column 13), the value of the Nutritional Balance Index (IBN, column 14) and in columns 15 and 16
elements diagnosed as poorer and more excessive, respectively, using general norms established for the DRIS in the levels of 8.0 kg plant-1. Considering
that sample 12 obtained the lowest productivity (4.18 kg plant-1), were
deficient values of P>Zn>B = Fe>N, and excessive Mg>Ca>Cu = Mn.
In 19 samples which represent crops with productivities below 6.0 kg plant-1, the diagnosis through the DRIS
showed that 42% of these samples, approximately, were deficient for potassium (21%) and boron (21%), followed by other nutrients in smaller percentages. On the other hand, the magnesium showed up as the nutrient in relative excess (36.8% of the samples). In this context, it is important to say that fertilization should be planned carefully,
reviewing the levels of nutrients added. Barbosa et al. (2006), in coffee crop, reported a nutritional imbalances using DRIS in Rio de Janeiro.
The absolute contents of N, P, K, Ca, Mg, S, B, Cu, Fe, Mn and Zn derived from DRIS norms obtained, are shown in Table 4, establishing them in a range where the standard deviations were associated with them in their development. This report aims to compare the norms with the standards established by Giordano et al. (2000).
The absolute foliar standards proposed by Giordano et al. (2000) were chosen in this study to be used for industry tomatoes, which have higher nutritional requirement than tomatoes for fresh consumption (Embrapa, 2011) and appropriate levels to high
Table 3. Application of DRIS in samples yielding less than 6 kg/plant (aplicação do DRIS nas amostras com produtividade abaixo de 6 kg/ planta).Presidente Prudente, UNOESTE, 2012.
Samples I
N IP IK ICa IMg IS IB ICu IFe IMn IZn IMS IBN Deficient Exceeding
2 1.2 0.6 -1.9 0.8 1.3 -0.2 -0.1 -1.5 -0.2 0.0 -0.6 0.8 9.1 K Mg
3 0.4 -0.7 0.4 -0.1 -0.1 0.4 -0.4 0.3 0.3 -0.3 -0.8 0.6 4.7 Zn S
4 0.7 -1.0 1.1 0.3 1.2 -0.6 -1.0 -0.2 -0.3 -1.1 0.0 0.9 8.4 Mn Mg
10 -0.2 1.8 0.9 -0.2 0.5 0.6 -0.4 -0.4 -0.9 -1.4 -0.5 0.1 7.9 Mn P
11 0.0 -0.9 -1.6 -0.1 1.1 1.0 -0.3 0.3 0.2 0.7 -0.6 0.1 7.1 K Mg
12 -0.4 -1.3 -0.2 0.8 2.3 -0.2 -0.5 0.4 -0.5 0.4 -0.9 -0.2 7.9 P Mg
16 -0.2 0.0 1.0 -0.1 0.2 -0.4 -2.0 0.5 -0.2 1.2 0.0 -0.1 5.8 B Mn
17 -0.3 -1.6 0.7 0.9 1.4 0.5 -0.6 -0.2 -0.3 -0.3 -0.7 0.4 7.9 P Mg
18 0.0 -0.7 -0.1 0.0 0.9 0.1 0.5 -0.8 -0.3 0.0 -0.1 0.6 4.0 Cu Mg
19 0.2 -1.1 0.8 0.6 0.9 0.4 -0.5 0.8 -0.3 -0.5 -1.4 -0.1 7.7 Zn Mg
23 0.5 0.1 0.2 0.1 0.6 1.0 -1.6 0.4 -1.7 0.0 0.1 0.2 6.4 Fe S
27 -0.3 0.7 0.6 -0.4 0.3 0.4 -1.5 0.5 0.1 -0.1 -0.3 -0.1 5.3 B P
28 -0.3 0.8 0.6 -0.3 0.2 0.2 -2.3 0.5 0.1 0.2 0.1 -0.1 5.8 B P
30 0.3 0.1 0.3 -0.6 0.2 0.4 -0.5 0.5 -0.4 -0.5 -0.4 0.6 4.8 Ca Cu
32 0.8 0.0 0.2 0.0 0.5 -0.3 -0.9 0.4 0.0 -0.2 -0.8 0.1 4.3 B N
37 0.2 0.0 -0.9 0.0 0.3 0.3 -0.3 0.4 0.5 0.0 -0.6 0.0 3.6 K Fe
44 1.5 0.7 2.2 0.9 0.8 1.4 1.8 -9.5 1.7 -0.3 -0.5 0.4 21.8 Cu K
54 0.2 -1.0 -1.6 1.0 -0.4 0.3 0.6 -0.5 1.2 0.7 -0.7 0.2 8.3 K Fe
56 1.3 0.2 0.0 -1.7 0.6 -0.2 -1.0 0.2 0.1 -0.2 -0.1 0.9 6.5 Ca N
Table 4. Nutritional factors studied, levels of existing standards and established standards (DRIS) (elementos nutricionais estudados, níveis de padrões existentes e normas DRIS estabelecidas). Presidente Prudente, UNOESTE, 2012.
Nutrient N P K Ca Mg S B Cu Fe Mn Zn
(g/kg) (mg/kg)
Existing pattern 40-60 2.5-7.5 30-50 15-30 4-6 4-12 40-70 10-20 400-600 250-400 60-70
productivities of tomatoes grown in greenhouses, especially regarding the micronutrients in relation to other studies. According to table 4, the authors verified that for the nutrients P, K, Ca, Mg and S, the range of nutrient contents were close to current standards. For the nutrient Cu, the DRIS standard was above the existing standard. The range of nutrient contents of N, Fe and Mn was below the existing standards. As for the nutrients B and Zn the difference stands out for different amplitude levels between minimum and maximum contents accepted as ideal. So it is possible to have new base information for using fertilization recommendations in relation to tomato crop in protected environment.
DRIS norms were established for tomato crop in protected environment, using as a pattern, the production of 8 kg plant-1.
T h e s a m p l e s w h i c h s h o w e d production lower than 6 kg plant-1,
presented deficiencies related to K and B and excess of Mg.
The DRIS norms established in this study showed that the tomato plants in protected environment can present the need of lower contents of nutrients N, Fe and Mn.
REFERENCES
ALVARENGA MAR. 2004. Tomate. Produção em campo, em casa-de-vegetação e em
hidroponia, 1° ed.
BARBOSA DHSG; VIEIRA HD; PARTELLI FL; SOUZA RM. 2006. Estabelecimento de normas DRIS e diagnóstico nutricional do cafeeiro arábica na região noroeste do Estado do Rio de Janeiro. Ciência Rural 36:
1717-1722.
BEAUFILS ER. 1957. Pesquisa de uma exploração
racional de hévea após um diagnóstico
fisiológico demorado sobre a análise mineral
de diversas partes da planta. Fertilité 3: 27-38.
BEAUFILS ER. 1973. Diagnosis and
Recommendation Integrated System (DRIS); a general scheme for experimentation and calibration based on principles develop from research in plant nutrition. Soil Science Bulletin 1: 1-132.
CRESTE JE; ECHER FR. 2010. Establishing standards for the integrated recommendation and diagnosis system (DRIS) for irrigated bean crops. Communications in Soil Science and Plant Analysis 41: 1921:1929.
DIAS JRM. 2010. Sistema Integrado de diagnose e recomendação (DRIS) para cupuaçueiro cultivado na Amazônia sul ocidental. Rio
Branco: Universidade Federal do Acre. 83p.
(Dissertação mestrado).
EMATER, IAPAR. 2011. Realidade Agropecuária Regional. Santo Antonio da Platina, 26p. EMBRAPA. 2011, 10 de dezembro. EMBRAPA
Hortaliças. Bibliotecas. Disponível em http:// www.cnph.embrapa.br/
EMBRAPA. 2013. Sistema brasileiro de
classificação de solos Rio de Janeiro: Embrapa. 2013. 353p.
GIORDANO LB; SILVA JBC; BARBOSA V. 2000. Escolha de cultivares e plantio. In: SILVA JBC; GIORDANO LB (eds). Tomate para processamento industrial. Brasília: Embrapa. p.36-59.
GOMES FP. 1981. Curso de Estatística
Experimental. 9. ed. Piracicaba: ESALQ, USP, 430.
HALLMARK WB; WALWORTH JL; SUMNER ME; MOOY CJ; PESEK J; SHAO KP.
1987. Separating limiting from non-limiting
nutrients. Journal of Plant Nutrition 10:
1381-1390.
HARTZ TK; MIYAO EM; VALENCIA JG. 1998.
Dris evaluation of the nutritional status of processing tomato. Hortscience 33: 830-832.
IAPAR. 2011, 12 de novembro. Cartas Climáticas. Disponível em www.iapar.pr.gov.br. Acessado em novembro de 2011.
JONES CA. 1981. Proposed modifications of
the Diagnosis and Recomendation Integrated System (DRIS) for interpreting plant
analysis.1981. Commun. Soil Sci. Plant Anal.
12: 785-794.
MALAVOLTA E; VITTI GC; OLIVEIRA SA.
1997. Avaliação do estado nutricional das
plantas. Piracicaba: POTAFOS. p.319. OLIVEIRA AR; OLIVEIRA SA; GIORDANO
LB; GOEDERT WJ. 2009. Absorção de nutrientes e resposta à adubação em linhagens de tomateiro. Horticultura Brasileira 27:
498-504.
PINTO PAC; DIAS LE; ALVAREZ VH; CHOUDHURY MM; VIEIRA G. 2009. Avaliação do estado nutricional da mangueira Tommy Atkins no submédio do vale do São Francisco: estabelecimento das normas DRIS. Recursos Rurais, IBADER 5: 5-13.
PÍPERAS GV; CRESTE JE; ECHER FR. 2009. Uso do DRIS na avaliação do estado nutricional da cana-de-açúcar. Revista Ceres 56: 818-825.
TAKAHASHI HW; ANDRADE BLG. 2010.
Nutrição de plantas. Diagnose Foliar em Hortaliças. Diagnose Foliar na Cultura do Tomate. Jaboticabal: FCAV/CAPES/FAPESP/
FUNDESP. 376p.
WADT PGS. 2009. Análise foliar como ferramenta para recomendação de adubação. In: CONGRESSO BRASILEIRO DE CIÊNCIA DO SOLO, 32, 2009. Fortaleza. Anais...
Fortaleza: SBCS. 50 p.
WALWORTH JL; SUMNER ME. 1987. The
Diagnosis and Recommendation Integrated System (DRIS). Advances in Soil Science 6: