ISSN 1516-635X Oct - Dec 2012/ v.14 / n.4 / 233-304
Technical Note
Author(s)
Malakzadegan A*
Zaghari M1
Khalaji S1
Shivazad M1
1Department of Animal Science, College of
Agriculture and Natural Resource, University of Tehran, Karaj31587-11167, Iran
Mail Adress
*Corresponding author’s name and address: A. Malakzadegan , Department of Animal Science, University College of Agriculture and Natural Resources, University of Tehran, 31587-11167, Karaj, Iran.
Telephone: +98 261 2248082; FAX +98 261 2246752.
Email: [email protected]
Keywords
Multi enzyme, y equivalent value, crude, broiler.
Submitted: March/2011 Approved: October/2012
ABSTRACT
In order to estimate the crude protein (CP) equivalence value of Natuzyme-p (NP) enzyme by using regression response equations, two experiments were carried out using Ross (308) broiler chicks. Graded levels of dietary CP (while amino acids levels were kept constant) and NP enzyme were used to derive the regression equation in the first experiment. Four levels of dietary CP and NP enzyme were fed to 160 feather-sexed male broiler chicks during the starter (0-28 d of age) and grower (28-42 d of age) period. Each diet was offered to four replicates of five chicks in a completely randomized design. Results obtained in experiment one failed to fit a regression equation between BW, dietary CP levels and NP enzyme. In experiment two, graded levels of CP changed along with the levels of lysine (Lys), Met+Cys and threonine (Thr). Regression equations between BW and dietary CP and NP enzyme were derived. Nonlinear and linear equations were generated for enzyme and CP. Based on an assessment of r2 and P value, nonlinear
equations were used to determine enzyme equivalence. The derived regression equations of body weight for CP were set to be equal with those obtained for NP and were solved; enzyme equivalence value for CP was calculated by subtracting the obtained value from CP content of basal diet. Crude protein equivalence value of NP at 28 and 42 d of age was estimated to be 0.96 and 0.38 %, respectively.
INTRODUCTION
Several benefits of the supplementation of broiler diets with mixtures of exogenous enzymes have been reported. They may improve nutrient digestibility, reduce nitrogen and phosphorus excretion, allow the use of alternative feed ingredients, reduce variations in the nutritional quality of feed ingredients, and reduce the incidence of wet litter that commonly happens when diets rich in viscous grains are fed (Yu & Chung 2007). However, determining nutrient equivalence values of enzymes is a requisite for precise feed formulation. Although P equivalence values of microbial phytase are well established (Cohelho & Kornegay 1996), corresponding data on amino acid and CP release with added phytase and multi-enzyme products are limited. The lysine equivalence of phytase was determined (Ravindran et al., 2001), but the effect of
phytase alone or together with other exogenous enzymes on the other amino acids is of considerable practical significance and needs to be quantified to enable its inclusion in least-cost diet formulation.
Estimates of nutrient equivalence value of exogenous phytase using regression equations were reported in pigs (Jendza, 2006; Radcliff, 2006) and broilers (Jendza, 2006; Adedokun, 2004). Zaghari et al.
alpha-amylase: 700 U/g, cellulose: 6,000 U/g, pectinase: 700 U/g, xylanase: 10,000 U/g, lipase: 30 U/g and protease: 3,000 U/g) and showed that it improved protein utilization. Khalaji et al. (2011) determined
the standardized ileal threonine equivalence values of the same enzyme mentioned above. The results of their experiment showed that addition of 0.5 g of this enzyme blend released, in average, 0.1% threonine from anti-nutrient protein complexes.
The objective of the present study was to determine the crude protein (CP) equivalence of a recently developed multi-enzyme product (Natuzyme-P, containing phytase: 1000,000 U/g, β glucanase: 700 U/g, α-amylase: 700 U/g, cellulose: 6,000 U/g, pectinase: 700 U/g, xylanase: 10,000 U/g, lipase: 30 U/g and protease: 3,000U/g) using linear and non-linear equations.
MATERIALS AND METHODS
General procedure
Two experiments were carried out to estimate crude protein equivalence of the enzyme blend Natuzyme-p for broilers. Equivalence CP values of the product were estimated in two experiments. In each experiment, 160 feather-sexed male Ross 308 broilers were submitted to the dietary treatments between 0-28 (starter) and 28- 42 (grower) days of age.
Broilers with similar initial body weight were allotted to battery cages (55×85 cm, 0.94 m2/bird).
Each cage was equipped with a feeder and drinker. A 24 h lighting program was employed, and feed and water were provided ad libitum. Soft plastic wires were placed on the cage floor to minimize foot lesions.
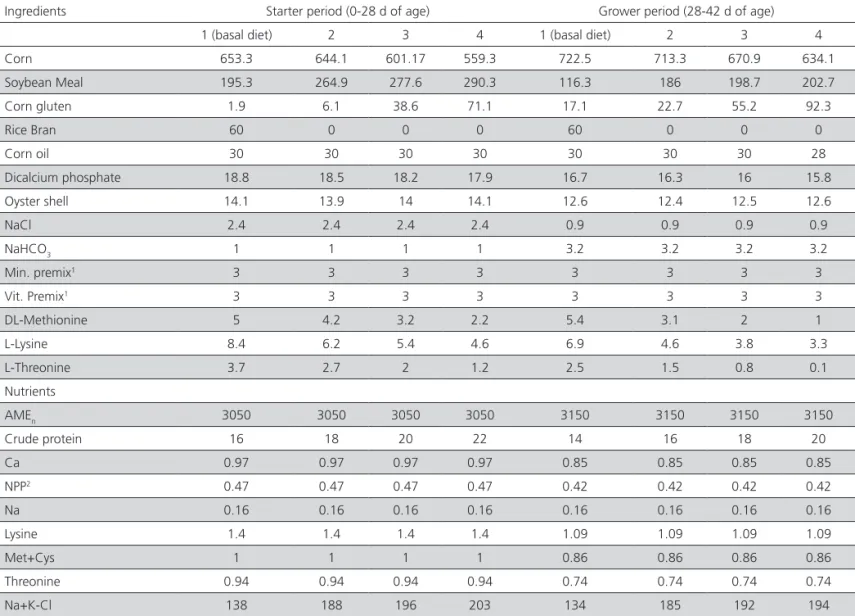
Table 1 – Ingredientsrientnutritional composition of experimental diets (0-28 and 28-42 d of age, Exp. 1)
Ingredients Starter period (0-28 d of age) Grower period (28-42 d of age)
1 (basal diet) 2 3 4 1 (basal diet) 2 3 4
Corn 653.3 644.1 601.17 559.3 722.5 713.3 670.9 634.1
Soybean Meal 195.3 264.9 277.6 290.3 116.3 186 198.7 202.7
Corn gluten 1.9 6.1 38.6 71.1 17.1 22.7 55.2 92.3
Rice Bran 60 0 0 0 60 0 0 0
Corn oil 30 30 30 30 30 30 30 28
Dicalcium phosphate 18.8 18.5 18.2 17.9 16.7 16.3 16 15.8
Oyster shell 14.1 13.9 14 14.1 12.6 12.4 12.5 12.6
NaCl 2.4 2.4 2.4 2.4 0.9 0.9 0.9 0.9
NaHCO3 1 1 1 1 3.2 3.2 3.2 3.2
Min. premix1 3 3 3 3 3 3 3 3
Vit. Premix1 3 3 3 3 3 3 3 3
DL-Methionine 5 4.2 3.2 2.2 5.4 3.1 2 1
L-Lysine 8.4 6.2 5.4 4.6 6.9 4.6 3.8 3.3
L-Threonine 3.7 2.7 2 1.2 2.5 1.5 0.8 0.1
Nutrients
AMEn 3050 3050 3050 3050 3150 3150 3150 3150
Crude protein 16 18 20 22 14 16 18 20
Ca 0.97 0.97 0.97 0.97 0.85 0.85 0.85 0.85
NPP2 0.47 0.47 0.47 0.47 0.42 0.42 0.42 0.42
Na 0.16 0.16 0.16 0.16 0.16 0.16 0.16 0.16
Lysine 1.4 1.4 1.4 1.4 1.09 1.09 1.09 1.09
Met+Cys 1 1 1 1 0.86 0.86 0.86 0.86
Threonine 0.94 0.94 0.94 0.94 0.74 0.74 0.74 0.74
Na+K-Cl 138 188 196 203 134 185 192 194
1Vitamin and mineral mix supplied the following per kilogram of diet: vitamin A, 11,000 IU; vitamin D3, 1,800 IU; vitamin E, 11 mg; vitamin K3, 2 mg; vitamin B2, 5.7 mg; vitamin
B6, 2 mg; vitamin B12, 0.024 mg; nicotinic acid, 28 mg; folic acid, 0.5 mg; pantothenic acid, 12 mg; choline chloride, 250 mg; Mn, 100 mg; Zn, 65 mg; Cu, 5 mg; Se, 0.22 mg; I, 0.5 mg; and Co, 0.5 mg.
The experiments were carried out according to a completely randomized design. Four replicates of five birds each were fed graded CP levels (four treatments) or product levels (four treatments) in each experiment. Feed intake and body weight were recorded at 28 and 42 d of age, and then feed conversion ratio (FCR) was calculated. Relative carcass, breast meat, gizzard, and abdominal fat pad weights were determined at slaughter.
Dietary treatments
Experiment 1
The objective of experiment 1 was to estimate CP equivalence values of the enzyme product when broilers were 28 and 42 days old. Graded CP levels
were supplied in the starter (16, 18, 20 and 22 %) and grower (14, 16, 18 and 20%) diets. Amino acid levels were kept similar between diets with different CP levels by adding synthetic amino acids, so that the only source of variation in this experiment was dietary CP level. Graded levels of the enzyme product (0.15, 0.25, 0.35 and 0.45 g/kg) were added to the basal diets (14 and 16 % CP in starter and grower diets, respectively).
Experiment 2
Because in experiment 1, the regression equations between BW (or FCR) and CP levels were not fit to estimate CP equivalence value due to a possible deficiency of essential amino acids, another experiment was conducted to reevaluate CP equivalence of the
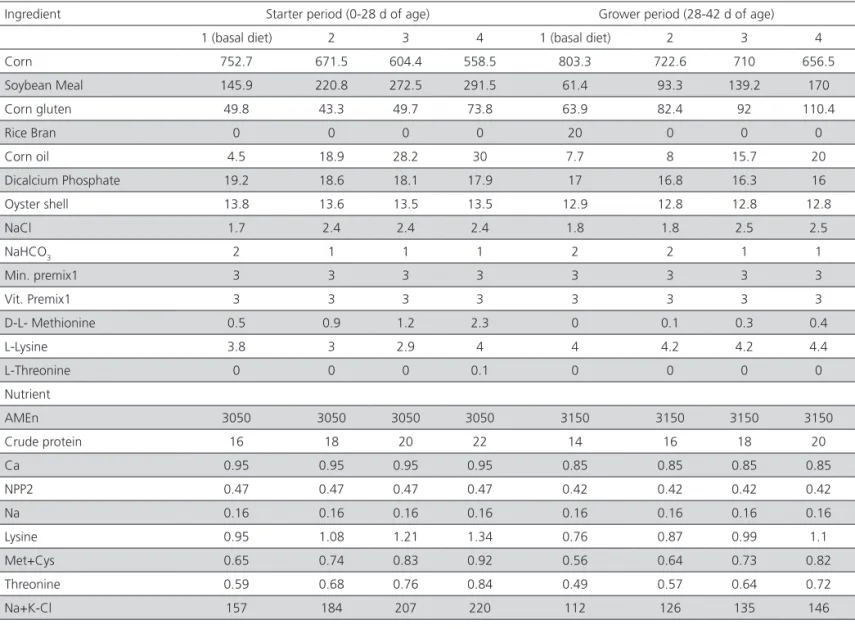
Table 2 – Ingredients and nutritional composition of experimental diets (0-28 and 28-42 d of age, Exp. 2)
Ingredient Starter period (0-28 d of age) Grower period (28-42 d of age)
1 (basal diet) 2 3 4 1 (basal diet) 2 3 4
Corn 752.7 671.5 604.4 558.5 803.3 722.6 710 656.5
Soybean Meal 145.9 220.8 272.5 291.5 61.4 93.3 139.2 170
Corn gluten 49.8 43.3 49.7 73.8 63.9 82.4 92 110.4
Rice Bran 0 0 0 0 20 0 0 0
Corn oil 4.5 18.9 28.2 30 7.7 8 15.7 20
Dicalcium Phosphate 19.2 18.6 18.1 17.9 17 16.8 16.3 16
Oyster shell 13.8 13.6 13.5 13.5 12.9 12.8 12.8 12.8
NaCl 1.7 2.4 2.4 2.4 1.8 1.8 2.5 2.5
NaHCO3 2 1 1 1 2 2 1 1
Min. premix1 3 3 3 3 3 3 3 3
Vit. Premix1 3 3 3 3 3 3 3 3
D-L- Methionine 0.5 0.9 1.2 2.3 0 0.1 0.3 0.4
L-Lysine 3.8 3 2.9 4 4 4.2 4.2 4.4
L-Threonine 0 0 0 0.1 0 0 0 0
Nutrient
AMEn 3050 3050 3050 3050 3150 3150 3150 3150
Crude protein 16 18 20 22 14 16 18 20
Ca 0.95 0.95 0.95 0.95 0.85 0.85 0.85 0.85
NPP2 0.47 0.47 0.47 0.47 0.42 0.42 0.42 0.42
Na 0.16 0.16 0.16 0.16 0.16 0.16 0.16 0.16
Lysine 0.95 1.08 1.21 1.34 0.76 0.87 0.99 1.1
Met+Cys 0.65 0.74 0.83 0.92 0.56 0.64 0.73 0.82
Threonine 0.59 0.68 0.76 0.84 0.49 0.57 0.64 0.72
Na+K-Cl 157 184 207 220 112 126 135 146
1Vitamin and mineral mix supplied the following per kilogram of diet: vitamin A, 11,000 IU; vitamin D3, 1,800 IU; vitamin E, 11 mg; vitamin K3, 2 mg; vitamin B2, 5.7 mg; vitamin
B6, 2 mg; vitamin B12, 0.024 mg; nicotinic acid, 28 mg; folic acid, 0.5 mg; pantothenic acid, 12 mg; choline chloride, 250 mg; Mn, 100 mg; Zn, 65 mg; Cu, 5 mg; Se, 0.22 mg; I, 0.5 mg; and Co, 0.5 mg.
enzyme product, changing essential and non-essential amino acids (including Lys, Met+Cys and Thr; Table 2). However, the ratios between CP and amino acids were kept constant. Graded levels of the enzyme product were added to the basal diets, which contained 16% CP, 0.95% Lys, 0.65 % Met +Cys and 0.59 % Thr in starter period and 14% CP, 0.76% Lys,0.56 % Met +Cys and 0.49 % Thr in grower period.
Statistical Analysis
Data were analyzed by the general linear models procedure of the SAS software (SAS Institute, 2003) with cage as experimental unit. Linear and quadratic effects of CP and enzyme product on body weight gain, feed conversion ratio and breast, thighs and abdominal fat weight percentage were tested using orthogonal polynomials. Linear and nonlinear response functions of body weight, feed conversion ratio and immune response that best fit the data were derived for CP and product levels. The models used were:
Linear function: Y = a+bX
Nonlinear functions: Y = a+b1X+b2X2 Y = a+b1X+b2X2+b3X3 Y = a (1-b(expcx)
Where Y=the responsedmeasurement and X=CP levels (percentage of diet) or multi-enzyme product (g per kg of diet). Nonlinear or linear response equations with the highest r2 value for added threonine and
the equations for added multi-enzyme product were set to be equal and were solved using the procedure described by Yi et al. (1996).
RESULTS
Experiment 1
Performance and carcass data of broiler chicks fed different levels of CP and NP are presented in Table 3. Different dietary CP levels significantly influenced BW and FCR at 28 and 42 d of age. Even with similar levels of amino acids, diets with higher levels of CP resulted in higher BW at 28 and 42 d of age. Furthermore, as dietary levels of CP increased, broilers utilized their feed more efficiently compared to their counterparts received low CP diets, which deposited significantly more abdominal fat and also presented significantly lower breast meat yield compared with those fed higher dietary CP levels. The addition of different levels of the enzyme product did not significantly affect performance or carcass parameters. No linear and nonlinear equations between NP enzyme levels and BW fit, and therefore the results obtained in this experiment were not used to estimate CP equivalence values of the enzyme product.
Experiment 2
The influence of different levels of dietary CP and amino acids on broiler performance (BW and FCR) and carcass parameters (carcass, abdominal fat, gizzard and breast meat relative weights) are presented in Table 4. At 28 and 42 d of age, broilers fed higher Table 3 – Effects of dietary treatments on performance and carcass parameters (Exp. 1)
Treatment BW at 28 d (g)
FCR at 28 d (g/g)
BW at 42 d (g)
FCR at 42 d
(g/g) Carcass (%)
Abdominal
fat (%) Gizzard (%)
Breast meat (%)
Protein levels
0-28 d 28-42 d
22 20 1328.13a 1.33c 2543.60a 1.57c 57.27a 1.43c 1.32b 24.42a
20 18 1168.75b 1.44b 2297.00b 1.65c 74.20ab 2.14c 1.46ab 23.38ab
18 16 1163.50b 1.49b 2251.80b 1.74b 72.50b 2.46b 1.24b 23.42ab
16 14 935.75c 1.65a 1776.8c 1.97a 72.80ab 3.14a 1.64a 21.15b
SE 29.42 0.02 76.2 0.027 0.8 0.2 0.01 0.79
Enzyme levels
0.45 935 1.65 1770 1.91 72.00 3.13 1.56 21.02
0.35 963 1.59 1866.80 1.90 71.77 3.22 1.43 21.26
0.25 1022 1.55 1780.20 2.01 72.25 3.08 1.46 20.42
0.15 976.6 1.70 1826.50 2.07 72.15 2.85 1.54 19.13
SE 46.37 0.052 81 0.062 0.97 0.27 0.11 0.92
protein and amino acid levels were significantly heavier than their counterparts fed low-density diets. The higher BW of these birds was associated with a more efficient utilization of the feed consumed. Although different levels of the tested enzyme product had no significant effect on broiler BW or FCR at 28 and 42 d of age, the equations fit these data and were used to estimate equivalence. In experiment two, enzyme supplementation resulted a numerical improvement in BW and FCR. Nonlinear response equations between graded levels of CP and the enzyme product with BW at 28 and 42 d of age are presented in Table 5. Crude protein equivalence values of Natuzyme-p enzyme during starter and grower period were estimated as 0.96 and 0.38 % respectively.
DISCUSSION
It has been shown that enzyme complexes with multiple enzyme activities are able to improve broiler
performance by increasing nutrient digestibility by interactions that occur among several enzymes. Zallena et al. (1999) and Meng & Slominski (2005)
reported higher protein and amino acid availability in corn-soybean meal diets supplemented with enzyme blends. The addition of different levels of the tested enzyme product to a low CP diet failed to influence either BW or FCR at any stage of broiler lifespan. In the first experiment, it seems that there was no influence of the tested product on broiler performance because the basal diet (which contained NP) was only deficient in CP when amino acids levels were kept at the recommended levels. Numerous studies have shown similar performance between broilers fed low CP diets supplemented with synthetic amino acids with those fed on diets with sufficient levels of CP (Par et al., 1991; Han et al., 1992; Namrud et al.,
2008). Denbow et al. (1995), Harper et al. (1997) and
Ravindran et al. (2001) used R2 as the criterion for
selecting either linear or non-linear regression models Table 4 – Effects of dietary treatments on performance and carcass parameters (Exp. 2)
Treatment BW at 28 d (g)
FCR at 28 d (g/g)
BW at 42 d (g)
FCR at 42 d (g/g)
Carcass (%) Abdominal fat (%)
Gizzard (%) Breast meat (%)
Protein levels
0-28 d 28-42 d
22 20 1268.13a 1.42b 2417.25a 1.65c 72.17a 2.06b 1.36 23.33a
20 18 1217.63a 1.48b 2267.98b 1.74bc 73.30a 2.13b 1.27 23.82a
18 16 1137.06b 1.49b 2109.05c 1.84b 71.59a 2.16b 1.37 21.88b
16 14 973.94c 1.75a 1767.18d 2.03a 69.42b 3.01a 1.48 20.27c
SE 23.8 0.03 28.8 0.03 0.68 0.18 0.08 0.33
Enzyme levels
0.45 1048.94 1.62 1848.70 1.94b 70.25ab 2.46 1.61 20.93
0.35 984.69 1.67 1804.38 1.95ab 70.88a 2.59 1.35 20.30
0.25 1001.31 1.71 1787.18 2.03a 69.16b 2.76 1.57 20.31
0.15 956.75 1.64 1765.60 1.99ab 69.79ab 2.69 1.43 19.78
SE 28.13 0.035 28.47 0.027 0.47 0.22 0.08 0.56
a-cMeans in the same column with no common superscript differ significantly (p<0.05).
Table 5 – Regression equations and estimated crude protein equivalence values of Natuzyme-p (Exp.2)
Trait Regression equation between
CP levels and BW R2
Regression equation between
enzyme levels and BW R2
CP equivalence values of the enzyme (%)
BW at 28 d Y=1.09x3-69.38x2+1491.2x-9603.3 88 Y=23677083x3-2081719x2+58720.6x+464.4 32 0.9647
BW at 42 d Y=3.61x3-217.8x2+4443.4x-28350 95 Y=10250000x3-840625+23226.2x+1571.8 28 0.3871
to describe the changes in certain response criteria to graded levels of phytase and supplemental inorganic phosphorous. The R2 values of linear and nonlinear
models generated from the growth performance data in this experiment were lower than those observed in literature (Adedokun et al., 2004; Denbow et al., 1995;
Ravindran et al., 2001; Yi et al., 1996). The differences may be attributed to the duration of the study and bird age. Denbow et al. (1995), Yi et al. (1996) and
Ravindran et al. (2001) conducted 21 d trials, whereas the duration of our trial was 42 d. Adedokun et al.
(2004) applied only linear regression equation and obtained higher R2 values using phytase. However,
the duration of their study was 14 d after allowing ad libitum access to a standard P-adequate starter diet for 7 days. However, in the present study, there were four weeks more, which allowed for higher variance as birds grew. Zaghari et al. (2008) showed the positive
effect of a multi-enzyme product (containing phytase: 1500 U/g, beta-glucanase: 700 U/g, alpha-amylase: 700 U/g, cellulose: 6,000 U/g, pectinase: 700 U/g, xylanase: 10,000 U/g, lipase: 30 U/g and protease: 3,000 U/g)on CP, which only difference to the blend used in the present experiment was phytase activity. In the current experiment the only source of variation between treatments was dietary CP level, while in previous experiment CP levels varied along with other nutrients, including AME, non-phytate P, and amino acids. Different responses may be therefore due both to different methodology and enzymes employed in the current experiment.
Based on the results obtained in the first experiment, the second experiment was designed so that CP levels varied together with amino acid levels. As expected, different dietary CP and amino acid levels resulted in significantly different performance responses at 28 and 42 d of age. These observations are consistent with those previously reported (Cheng, 1997; Kidd et al., 2004). The addition of different NP enzyme levels to the diet deficient both in amino acids and CP failed to influence BW and FCR at 28 and 42 d of age. As birds age, their amino acid requirements begin to decrease (Gao, 2007). It seems that the reduced amino acid requirements in later stages of broilers’ lifespan are the primary reason for lack of response to NP enzyme addition. The lack of influence of exogenous enzymes on broiler performance during later growth stages (Zaghari et al., 2008) or in old birds (Denbow, 1995) is well documented.
REFERENCES
Adedokun SA, Sands JS, Adeola O. Determining the equivalent phosphorus released by an Escherichia coli-derived phytase in broiler chicks. Canadian Journal of Animal Science 2004; 84:437-444.
Cheng TK, Hamre ML, Coon CN. Response of broilers to dietary protein levels and amino acid supplementation to low protein diets at various temperatures. Journal of Applied Poultry Research 1997; 6: 18-33.
Cohelho MB, Kornegay ET. Phytase in animal nutrition and waste management. Mount Olive: Direi BASF Corp; 1996.
Denbow DM, Ravindran V, Kornegay ET, Yi Z, Hulet RM. Improving phosphorous availability in soybean meal for broilers by supplemental phytase. Poultry Science 1995; 74:1831-1842.
Gao F, Jiang Y, Zhou GH, Han ZK. The effects of xylanase supplementation on growth, digestion, circulating hormone and metabolite levels, immunity and gut microflora in chickens fed on wheat-based diets. Brithish Poultry Science 2007; 48(4):480-488.
Han Y, Suzuki H, Parsons CM, Baker DH. Amino acid fortification of a low protein corn – soybean meal diet for maximal weight gain and feed efficiency of the chick. Poultry Science 1992; 71:1168- 1178.
Harper AF, Kornegay ET, Schell TC. Phytase supplementation of low-phosphorous growing-finishing pig diets improve performance, phosphorous digestibility and bone mineralization and reduces phosphorous excretion. Journal of Animal Science 1997; 75:3174-3186.
Jendza JA, Dilger RN, Sands JS, Adeola O. Efficacy and equivalence of an Escherichia coli-derived phytase for replacing inorganic phosphorus in the diets of broiler chickens and young pigs. Journal of Animal Science 2006; 84:3364–3374.
Khalaji S, Zaghari M, Shivazad M. Estimation of standardized ileal threonine equivalence values of a multi-enzyme and its effects on broiler chick’s performance. Italian Journal of Animal Science. 2011; 10: 47-50.
Kidd MT, McDaniel CD, Branton SL, Miller ER, Boren BB, Fancher BI. Increasing amino acid density improves live performance and carcass yields of commercial broilers. Journal of Applied Poultry Research 2004; 13:593-604.
Meng X, Slominski BA. Nutritive values of corn, soybean meal, canola meal, and peas for broiler chickens as affected by a multicarbohydrase preparation of cell wall degrading enzymes. Poultry Science 2005; 84:1242–1251.
Namroud NF, Shivazad M, Zaghari M. Effects of Fortifying Low Crude Protein Diet with Crystalline Amino Acids on Performance, Blood Ammonia Level, and Excreta Characteristics of Broiler Chicks. Poultry Science 2008; 87:2250–2258.
Par J F, Summers JD. The effect of minimizing amino acid excesses in broiler diets. Poultry Science 1991; 70:1540-1549.
Radcliff JS, Pleasant RS, Kornegay ET. Estimating equivalence values of microbial phytase for amino acids in growing and finishing pigs fitted with steered ileo-cecal valve cannulas. Journal of Animal Science 2006; 84:1119–1129.
Ravindran V, Selle PH, Ravindran GP, Morel CH, Kies AK, Bryden WL. Microbial phytase improves performance, apparent metabolisable energy and ileal amino acid digestibility of broiler fed a lysine-deficient diet. Poultry Science 2001; 80:338344.
Yi Z, Kornegay ET, Ravindran V, Denbow DM. Improving phytase phosphorus availability in corn and soybean meal for the broiler using microbial phytase and calculation of phosphorus equivalence values for phytase. Poultry Science 1996; 74:240-249.
Yu B, Chung TK. Effects of Multiple-Enzyme Mixtures on Growth Performance of Broilers Fed Corn-Soybean Meal Diets. Journal of Applied Poultry Research 2004; 13:178-182.
Zaghari M, Gaykani R, Shivazad M, Taherkhani R. Evaluation of Phytase nutrient equivalence for old laying hen. Asian journal Poultry Science 2008; 2(1); 24-29.
Zaghari M, Majdeddin M, Taherkhani R, Moravej H. Estimation of nutrient equivalence values of Natuzyme and its effects on broiler chick’s performance. Journal of Applied Poultry Research 2008; 17:446–453.