THIS REPORT WAS PREPARED EXCLUSIVELY FOR ACADEMIC PURPOSES BY [INSER STUDENT’S NAME], A MASTERS IN FINANCE STUDENT OF THE NOVA SCHOOL OF BUSINESS AND ECONOMICS.THE REPORT WAS SUPERVISED BY A NOVA SBE FACULTY MEMBER, ACTING IN A MERE ACADEMIC CAPACITY, WHO REVIEWED THE VALUATION METHODOLOGY AND THE FINANCIAL MODEL.
(PLEASE REFER TO THE DISCLOSURES AND DISCLAIMERS AT END OF THE DOCUMENT)
M
ASTERS IN
F
INANCE
▪ Major juridical problems may affect EDP in the future due to alleged wrongdoings during the computation of the figures to be given to the company under the CMEC’s regime following the liberalization of the Iberian electricity market.
▪ Typical utility company with very stable cash-flows from its operational businesses and giving current low interests rates from the central bank’s Quantitative Easing, our target price for EDP is 5.04€ and thus a BUY recommendation.
▪ Future gross margins will deeply depend on the company’s ability to deliver a generation mix with a high component of renewable electricity. However, in order to hedge itself more from weather conditions, the company should diverse even further its renewable installed capacity with a higher solar component.
▪ Great opportunities in Brazil as economic crisis becomes a thing of the past; First steps in the transmission segment in this country by EDP that promises good return rates and reinforce the low-risk profile of the company.
▪ Possible Gas Natural Fenosa merger very challenge with little interest showed from largest shareholder as well as deep political barriers due to strategic sector.
EDP
–
E
NERGIAS DE
P
ORTUGAL
C
OMPANY
R
EPORT
E
LECTRICITY
3
J
ANUARY2018
S
TUDENT
:
T
IAGO DE
S
OUSA
F
ERREIRA
[email protected]
The Ever-Present Regulatory Issues
Regulatory uncertainties coupled with critical
long-term decisions will shape future’s earnings
Recommendation: BUY
Vs Previous Recommendation HOLD Price Target FY17: 5.02 € Vs Previous Price Target 0.00 € Price (as of 3-Jan-18) 2.94 €
Reuters: EDP LS, Bloomberg: EDP:PL
52-week range (€) 2.64€-3.39€ Market Cap (€m) 10 610 Outstanding Shares (m) 3 656 Other (…)
Source: Financial Times
Source: Bloomberg
(Values in € millions) 2016 2017E 2018F Gross Margin 5738.0 5074.2 5339.6 EBITDA 3759.3 1649.9 1701.5 Net Profit 1200.1 845.9 1117.5 Profit to Shareholder 960.6 648.3 869.5 EPS 0.263 0.177 0.238 EBITDA/Gross Margin 0.66 0.675 0.681 Source: EDP and Analyst Estimates
“EDP–ENERGIAS DE PORTUGAL” COMPANY REPORT
Table of Contents
Company Overview ... 3
Shareholder Structure ... 4
Valuation ... 5
Iberia ... 7
Electricity Market Overview ... 7
Electricity Generation ... 10
Regulated Generation ... 10
Liberalized Generation and Supply ... 12
Distribution ... 19
Brazil ... 21
Valuation ... 22Gas ... 23
EDP Renováveis ... 24
Alternative Scenarios... 25
Appendix... 26
Financial Statements ... 26
“EDP–ENERGIAS DE PORTUGAL” COMPANY REPORT
Company overview
Portugal’s modern electricity market history is deeply related with EDP’s. Founded in 1976 after the merger of thirteen recently nationalized electrical companies, the newly vertically integrated company became a state-owned monopoly whose primary goal was to develop a public service in the electricity market as well as to upgrade and expand the existing infrastructure.
After a series of reforms aiming at liberalizing the electricity market (where there was a process called unbundling which led to the dismantling of vertically integrated companies and the openness of the production and commercialization activities of electricity to other private competitors), EDP was subjected to some transformations which ultimately led to its privatization. Furthermore, there was a juridical separation of the transportation and distribution activities, that were considered natural monopolies and thus not opened to competition. This alteration led to the creation of REN (Redes Energéticas Nacionais) in 1994, originally as a subsidiary of EDP until 2000 when it became its own separated company.
Today, EDP is a public listed company in the Portuguese Stock Exchange and one of the main utility companies in the Iberian Peninsula. Despite its key role at the Iberian level, at the European level it remains one of the smallest companies of its sector.
EDP is present in all four activities of electricity chain value – generation, distribution, transmission and commercialization – and has currently operations in thirteen countries. As far as generation activity is concerned, EDP operates not only in the Iberian Peninsula but also in some European countries and North America (through its subsidiary EDP Renewables) and in Brazil (through EDP Brasil). Regarding the distribution and commercialization activities, EDP operates only in Iberia and Brazil. Despite its main utility being electricity, EDP also commercializes natural gas.
Diversification and internationalization have been two of the main strategies followed by the company. As a result, EDP’s generation is relatively well diversified in terms of countries of origin. The strategy of diversification of energy sources has been carried out mainly by EDP Renewables due to its investments in wind-farms spread across North America as well as in Europe. These investments led EDP to balance its installed capacity from a hydro-based one to a more even one across different sources of energy.
Due to its value as a basic human need, the electricity sector is highly regulated across its value chain. As a consequence, EDP’s EBITDA is heavily originated from regulated activities. These regulated activities in Iberia comprise the generation EDP started as a state-owned
vertically integrated company and was given the exclusive concession of all operations in the electricity value chain.
Figure 1: EDP's EBITDA decomposition (2016).
“EDP–ENERGIAS DE PORTUGAL” COMPANY REPORT
under CMEC’s regime, the distribution segment and the commercialization of electricity in the Portuguese regulated market. The remainder of EDP’s plants in Iberia are in the liberalized market, and thus exposed to all types of risks that arise from being opened to competition. Regarding EDP Brasil, the majority of its activities is deeply regulated. Whereas generation plants benefit from long-term Power Purchase Agreements (PPA), the distribution and the transmission revenues are set by the regulatory authority. Finally, most of EDP Renewables’s electricity generation benefits from some sort of regime which may include a feed-in tariff or a premium over the pool price per MW.
Shareholder Structure
After que acquisition of the Portuguese State stake at EDP, China Three Gorges (CTG) became the largest shareholder of the company. More than a mere stakeholder, this deal was viewed by the two companies as a way to build a new “strategic partnership” where EDP and CTG would combine efforts to become worldwide leaders in renewable energy. These efforts would be translated in joint ventures carried out by the companies to develop hydro and wind electric projects worldwide.
Furthermore, upon the conception of this deal, EDP was committed a credit facility of up 2 billion euros from a Chinese financial institution at a corporate level for a maturity up to 20 years. Additionally, CTG committed to invest in equity stakes and ready-to-build renewable projects of EDP.
This strategic partnership has already materialized in the creation of a joint venture called Hydro Global, equally-owned by the two companies, whose goal is the development of medium-sized hydroelectric projects in non-traditional markets. In 2017, both companies announced the development of a hydro project in Peru with an installed capacity of 200 MW through Hydro Global, marking the entrance in a new geography for EDP. In Brazil, EDP and CTG also have joint ventures in some hydroelectric projects with an installed capacity of 1292MW.
In our view, this partnership was a positive factor for EDP since it gave the company more visibility through a world leader in the generation of electricity. Additionally, the similar global medium-long term visions of both companies, reflected in The final phase of EDP’s
privatization process was the alienation of the last 4.1444% of EDP’s shares still held by the Portuguese State in 2013.
“EDP–ENERGIAS DE PORTUGAL” COMPANY REPORT
the priority given to the renewable sector, gives EDP the opportunity to create synergies with CTG as well as the possibility of entering new geographies with potential generation capacity yet to be explored with a lower risk.
Valuation
For the purpose of this work, the sum-of-parts method was used to valuate EDP. This means that we accessed each one of EDP’s business segment individually using the Discount Factor Model – Weighted Average Cost of Capital (DFC – WACC) where we have assumed a time horizon of 8 years (except for the regulated generation in Iberia whose time horizon includes the remaining years until this business segment terminates in 2027). Regarding EDP Renováveis, we used its market value on the 3rd of January 2018, whereas some balance sheet
components are valued according with book value.
Despite having very similar operating businesses, each one of them have, however, different risks that arise from the fact that some are deeply regulated with quite stable cash flows and thus less correlated with the economic cycle. For that reason, in order to properly valuate each business segment, we had to have into account the different levels of risk. The cost of capital implied in each segment was computed by taking into consideration the opportunity cost of equity and debt and the company’s target capital structure.
To estimate the cost of equity, we used the assumptions underlined in the Capital Asset Pricing Model (CAPM). The first step was to estimate the risk-free rate. For European business segments, we have considered as a risk-free rate the German 10-year bond, since it is regarded as the safest and default-free country in the continent. For Brazil, since our forecasted cash flows were computed in the local currency (Brazilian Real) this rate was computed with the US 10-year bond adjusted by the inflation difference between that country and Brazil. We assumed a market premium of 5.75%, in accordance with some financial literature and computed the unlevered beta based on the average betas of companies with similar businesses as EDP1 and then re-levered it accordingly to EDP’s present
capital structure based on market values. As it was expected, beta from regulated activities and from Brazil are lower due to their stable cash flows under regulatory frameworks. Since beta represents the systematic risk of a company, we believe that it is not necessary to take into consideration the country risk of each business
1 Comparable companies: regulated activities in Iberia: National Grid (UK), REN (PT), Eversource Energy (USA) and
Xcel Energy (USA); liberalized activities in Iberia: Iberdrola (SP), Endesa (SP), Gas Natural Fenosa (SP), E.On (GER), EDF France (FR), ENEL (IT); Brazil: Eletrobrás, Companhia Energética de Minas Gerais, Companhia Energética do Estado da Bahia, Transmissão Paulista. Betas were computed through a regression for a 10 year-period against Stoxx 600 Europe, S&P 500 and BOVESPA Index for the European, American and Brazilian companies.
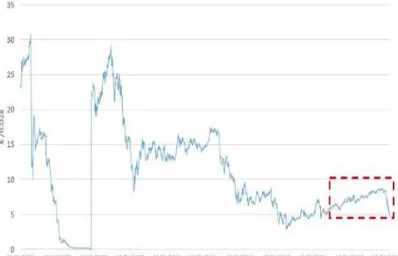
Graph 1: EDP's market price since the
acquisition by CTG on December 2011. EDP has already given its main stakeholder 780 million Euros worth of dividend. (Source: Yahoo Finance)
“EDP–ENERGIAS DE PORTUGAL” COMPANY REPORT
segment. Furthermore, we believe that the forecasted cash flows already reflect each country risk.
Finally, to estimate EDP’s cost of debt we have decided to measure the perceived risk that investors have regarding the company’s obligations. Therefore, if there is any risk the firm will default, we can use the market yield of the firm as an estimate of investors’ expected return and adjust it for the perceived risk based on the company’s credit rating. As such, for the cost of debt, we have used the yield-to-maturity of a liquid and long-term EDP bond2. Furthermore, bearing in mind
EDP’s credit rating again, we attributed a default probability of 0.38%3 and a
recovery rate equal to 56%4. We used the same cost of debt for all business
segments since the heavy majority of EDP debt emissions comes from EDP Finance and covers almost all group.
Reg. Activities in Portugal Lib. Activities in Portugal Reg. Activities in Spain Lib. Activities In Spain Brazil Risk-Free Rate 0.50% 0.50% 0.50% 0.50% 4.03% Market Risk Premium 5.75% 5.75% 5.75% 5.75% 5.75% Beta of the sector 0.419 1.088 0.419 1.088 0.543
Country Beta 1 1 1 1 1
Capital Cost of Equity 2.91% 6.75% 2.91% 6.75% 7.15%
Yield-To-Maturity 1.59% 1.59% 1.59% 1.59% 1.59% Probability of Default 0.38% 0.38% 0.38% 0.38% 0.38% Recovery Rate 56.00% 56.00% 56.00% 56.00% 56.00% Tax Rate 29.5% 29.5% 25.0% 25% 34%
Capital Cost of Debt
(after tax) 1.00% 1.00% 1.07% 1.07% 0.94%
Capital Structure
D/EV 58.80% 58.80% 58.80% 58.80% 58.80% E/EV 41.20% 41.20% 41.20% 41.20% 41.20%
WACC 1.79% 3.37% 1.83% 3.41% 3.50%
Following our valuation of the company, and bearing in mind three possible scenarios to happen, we attribute a price target of 5.04 € leading to BUY recommendation. The value of all EDP’s operating business were computed with the discount factor model except for EDP Renováveis. Additionally, some items that were used to get the equity value of EDP were valuate either using the respective market value or book value from the balance sheet. All information is summed up in the next table.
2 EDP’s 10-year bond yield-to-maturity (1.592%).
3 Moody’s “Annual Default Study: Corporate Default and Recovery Rates 1920-2016”, 2017 4 Renault and Scaillet (2004)
“EDP–ENERGIAS DE PORTUGAL” COMPANY REPORT
EDP ENTERPRISE VALUE (Values in thousands €) BASE SCENARIO (70%) CO2 PRICES INCREASE (20%) CMEC'S CUT (10%) Regulated Generation Iberia DFM-WACC 1 291 746 1 297 731 821 514 Liberalized Activities Iberia DFM-WACC 16 311 554 7 724 025 16 311 554 Regulated Networks Portugal DFM-WACC 3 956 029 3 956 029 3 956 029 Regulated Networks Spain DFM-WACC 3 105 503 3 105 503 3 105 503 Brazil DFM-WACC 7 930 645 7 930 645 7 930 645 EDP Renováveis Market Value 5 931 708 5 931 708 5 931 708 EDP Renováveis Debt Market Value 3 000 000 3 000 000 3 000 000
TOTAL 41 527 185 32 945 641 41 056 953
Assets held for sale, net Book Value 554 776 554 776 554 776 Other Assets and Financial Assets,
net Book Value 229 979 229 979 229 979 Provisions - non-operating Book Value -558 430 -558 430 -558 430 Employees Benefits Book Value -1 841 287 -1 841 287 -1 841 287 Financial Debt Market Value -15 257 180 -15 257 180 -15 257 180 Minority Interests Book Value -4 389 733 -4 389 733 -4 389 733 Contribution Energy Tax Market Value -132 628 -132 628 -132 628 Equity Value 20 132 683 11 551 138 19 662 450 #Shares 3 656 538 3 656 538 3 656 538 Stock Price 5.51 € 3.16 € 5.38 €
TOTAL Equity Value 18 369 351
Stock Price 5.02 €
Iberia
Electricity Market Overview
The electricity market in the Iberian Peninsula was subjected to numerous reforms that ultimately led to a regional electricity market in Portugal and Spain. The adoption of the 1996 Directive (96/92/CE) was a decisive moment since it established the common rules for a European Common Electricity Market. Later on, in 2001, the Portuguese and Spanish Governments signed a protocol for the creation of the Electricity Iberian Market (MIBEL), that was fully operational in 2007.
According to ERSE, “in the context of the markets liberalisation process, where the activities of the network operators are considered natural monopolies and are therefore subject to economic regulation, the production and selling of electricity are open to competition”. MIBEL is currently organized into two divisions: the OMIE (Operador del Mercado Ibérico de Energia, SA), the Spanish division, that manages the spot electricity market with daily transactions and intraday adjustments, wherein electricity sale and purchase programmes are established for the day following that of the trade; OMIP, the Portuguese division, that ensures the management of the MIBEL future’s market. The OMIP provides future, forward and SWAP contracts, offering instruments for agents to have a proper risk hedging strategy. Furthermore, MIBEL also has a bilateral market for the selling and purchasing of electricity.
The liberalization process of the electricity sector was relatively late compared with other industries.
It was mainly due to the liberalization of the English and Wales electricity markets under the Tatcher Administration as well as the development of technologies that allowed a better real-time monitoring of the electricity sector that propelled other European nations to do the same in their respective electricity systems.
“EDP–ENERGIAS DE PORTUGAL” COMPANY REPORT
One of the main challenges following the creation of MIBEL was the interconnection grid between both countries. Currently, eleven different points with an installed capacity of 2600 MW connect the Spanish and Portuguese grids which is expected to increase to 3000 MW in 2020. However, the delay that is affecting the interconnection project between Galiza and the North of Portugal may push that goal forward in time. The existence of a well interconnected grid between these two countries is crucial for a competitive Iberian Electricity market since it allows to considerably diminish the congesting during peak hours. These congestions mean that there will be two different wholesale prices of electricity in Portugal and Spain, where the country that is importing electricity faces a higher price than the other.
This liberalization process meant that domestic consumers had the possibility to migrate from the regulated market to the liberalized. In Portugal, 2017 was originally the year when all consumers were to migrate to the liberalized market. However, this year the Portuguese Government extended that goal to 2020. Furthermore, it now allows consumers to migrate back to the regulated market, a possibility that did not exist for those already in the liberalized market.
In order for a full convergence of the two countries’ prices additional interconnection capacity is required.
“EDP–ENERGIAS DE PORTUGAL” COMPANY REPORT
One of the main concerns that both countries face nowadays is the huge tariff deficits. These deficits, despite some specific natures among each country, were originated due to the massive generous subsidies granted under the special regime production (PRE). This regime, aimed at stimulating the investment on renewable and co-generation sources and reducing the fossil dependency of both countries, granted fixed tariff-in prices (that grew at the inflation rate) well above the wholesale price in the liberalized market for each MWh of electricity produced under that special regime. In Portugal, EDP Serviço Universal (initially a subsidiary from EDP Distribuição), the last resort electricity supplier, is the responsible for the purchase of PRE-electricity. After purchasing that electricity, the company then uses it to supply consumers in the regulated market or sells it in the wholesale market. Due to the fact that EDP SU sells its electricity at a price nearly half of what it had purchased, the result is a massive tariff deficit that all consumers have to pay in the final electricity price. Those deficits would oblige authorities to greatly increase electricity tariffs. However, for that not to happen, Portuguese authorities established a five-year period in which only 1/5 of that deficit would be passed to tariffs each year. As result, the country has accumulated a tariff deficit that has only started to decrease very recently. During Portugal’s bailout, IMF tried to address this problem by cutting the subsidies for renewable; however, little action was made.
This special production regime alongside the CMEC’s regime have been a huge burden for the national electrical system. Those costs are designated as general economic interest costs (CIEG in the Portuguese anacronym) and are reflected every year in the final electricity tariff via the Global Use of the System tariff that Figure 4: Portuguese tariff deficit (2007-2018E). Source: ERSE
Figure 3: Price paid for the PRE’s production by primary
source of electricity (2001-2018E). Legend from top to the bottom: Wind, Hydro, Cogeneration, RSU, Solar, Biomass, Biogas, Other micro production .Source: ERSE
“EDP–ENERGIAS DE PORTUGAL” COMPANY REPORT
alongside the Use of the Transportation and Distribution Grids tariffs makes the Grid’s Access Tariff. According to ERSE, these CIEG are responsible for more than 50% of the total Grid’s Access Tariff.
In order to relieve the Portuguese Electrical System from that burden, the Government has adopted some measures such as the Energetic Contribution Tax where companies from the energy sector have to pay a specific tax over their total fixed assets as well as a drastic reduction of feed-in tariffs to subsidy renewable projects. Furthermore, in 2016, the Government announced an alteration to the warrant regime where conventional thermal plants benefited from a fixed 6000 Euros per MW for their permanently disposition to produce electricity at any time. Now this warrant is made through an auction that according to ERSE allowed the electricity system to save 7.2 million Euros in 2017. Originally EDP benefited from this warrant regime on its CCGT power plants. In Spain, every company continues to receive 26 000€ per MW.
Electricity Generation
As of 2017, EDP has an installed capacity of 13.7 GW in the Iberian Peninsula (excluding wind), where hydro is responsible for more than half of that capacity (54%). Conventional thermal plants are responsible for 45% whereas nuclear has a residual contribution of 1% (EDP’s 15.5% stake at the Spanish Trillo nuclear plant). The share of hydro has been increasing over the years due to EDP’s huge investments of more than 2.5 billion euros in hydroelectric plants in Portugal. When compared with its peers in the Iberian Peninsula, EDP’s mix is, alongside with Iberdrola’s, the only one where renewable capacity is responsible for more than 50% of the total installed capacity.
Regulated Generation
Whereas EDP’s generation in Spain is fully liberalized, in Portugal EDP’s generation is divided into regulated and liberalized production. Regulated generation still contributes with a significant share to the company’s total EBITDA. Following the liberalization of the Iberian electricity market, there was the creation of a dual system for electricity trade at the wholesale and retail levels in Portugal. Alongside the newly liberalized market, the Portuguese Eletrical System also comprised the Public Service System, where all existing generation capacity was under a Power Purchase Agreement (PPA) framework. As such, all EDP’s plants under those contracts granted the company an annual return of 8.5% before
taxes and all the investments made during the life of the PPAs would also benefit
from this remuneration. The pass-through of contractual fixed and variable operational and maintenance costs (O&M), as well as the depreciation charge
Figure 5: EDP's (ex- wind) (top) and its peers
(bottom) installed capacity in the Iberian Peninsula (2017). Source: Company Report
“EDP–ENERGIAS DE PORTUGAL” COMPANY REPORT
was also assured to EDP by those contracts. Since PPA were not compatible with a liberalized market, they cessed in 2007, well before they were due to end. So, in order to compensate EDP for these early cessations, another regime was created with the approval of the European Commission - CMEC - whose main objective was to guarantee the same NPV that the now extinct PPA were to give to EDP. As such, CMEC’s value would be the difference between the revenues that EDP were to receive under PPA’s contracts and the revenues obtained from the electricity sold in the wholesale liberalized market. In June 2007, it was established that CMEC’s value would be equal to 833 467 thousand Euros to be reflected in the Global Use System tariffs paid by all consumers until 2027. Furthermore, an annual deviation was to be computed and equivalent to the difference between CMEC’s assumptions made in 2007 regarding electricity outputs, market prices, fuel and CO2 prices and
the real market data. If positive then EDP would have to receive that difference that would be reflected in future’s tariffs (two years after the occurrence of the deviation) paid by all consumers, otherwise it would be the company to incur that cost. In 2017, these annual deviations would give away to a final adjustment calculated by ERSE and to be receive by EDP each year until 2027. That was the case in September 2017 when ERSE arrived to a final adjustment of 154 million Euros during the remaining final 10 years of the CMEC’s regime, a value that has yet to be approved by the Portuguese Government. However, this figure is quite different from the one the company claims to be the true value of 250 million Euros. We believe, however, that ERSE’s value will prevail and that the Portuguese Government will not oppose to thisfigure given the current political landscape in Portugal where far-left parties that support the Government are fairly against the CMEC’s regime. However, EDP is currently under investigation from public authorities for alleged wrongdoings during the computation of CMEC’s value. Furthermore, ERSE has announced that “consumers had paid an additional 510 million Euros due to CMEC’s regime”. This may be a considerably problem to the company if ERSE decides in the future to recoup that value from EDP in favour of consumers. We discuss this issue in more detail in the “Alternative Scenarios” section.
Valuation
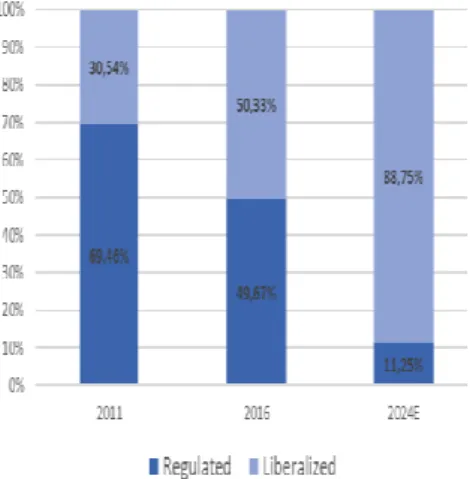
As the market progresses its full liberalization path we forecast a progressive decrease in the share of the regulated production in EDP’s total EBITDA. Furthermore, as the CMEC’s regime of each plant approaches its final year, those plants will migrate from the regulated to the liberalized market leading to a reduction of the installed capacity from 4027 MW in 2017 to just 376 MW in 2024.
On one hand we have assumed operational costs from these activities to behave according to the installed capacity. Since there will be a reduction of this latter one,
Figure 6: Evolution of Iberian Generation
EBITDA's composition (2011-2024E). Source: EDP and Analyst Estimate
Under the PPA contracts, REN was obliged to buy all the electricity produced by those plants and originally was a necessary condition for banks to finance the construction of additional capacity
Figure 7: Terminal year of CMEC's regime for
“EDP–ENERGIAS DE PORTUGAL” COMPANY REPORT
we expected a decrease on total operational costs as well. On the other hand, we forecast CAPEX to be only for maintenance purposes and to be mostly stable until 2024 when a bulk of the CMEC’s will extinct. We attribute a maintenance CAPEX equal to 8567 Euros per MW of installed capacity.
Liberalized Activities
For the purpose of this valuation, we have decided to compute the enterprise value of the liberalized generation and supply activities together.
The liberalized production in Iberia has seen its contribution to EDP’s EBITDA steadily rising since its lows in 2012 mainly due to massive investments between 2010-2017 period in hydro power (accounting for more than 2.5 billion Euros) and due to the migration of hydro plants from the regulated to the liberalized market. As such, EDP has a total installed capacity of 9.4 GW in 2017 most of it in Portugal.
After electricity is generated, it is sold in the Iberian wholesale market at a pool price which depends on the mix of electricity that is being sold at that moment. The pool price results from a merit order process where each source of electricity is ranked according to the respective marginal cost. The pool price at which all electricity is sold is equal to the marginal cost of the most expensive source of energy. Marginal cost varies differently across all sources of electricity, being closer to zero for renewables and higher for natural gas or coal plants. This happens due to the fact that, while renewables do not require any type of fuel to generate electricity, conventional thermal plants have different variable costs that result from the need to buy coal or natural gas as well as, in the European context, the obligation to
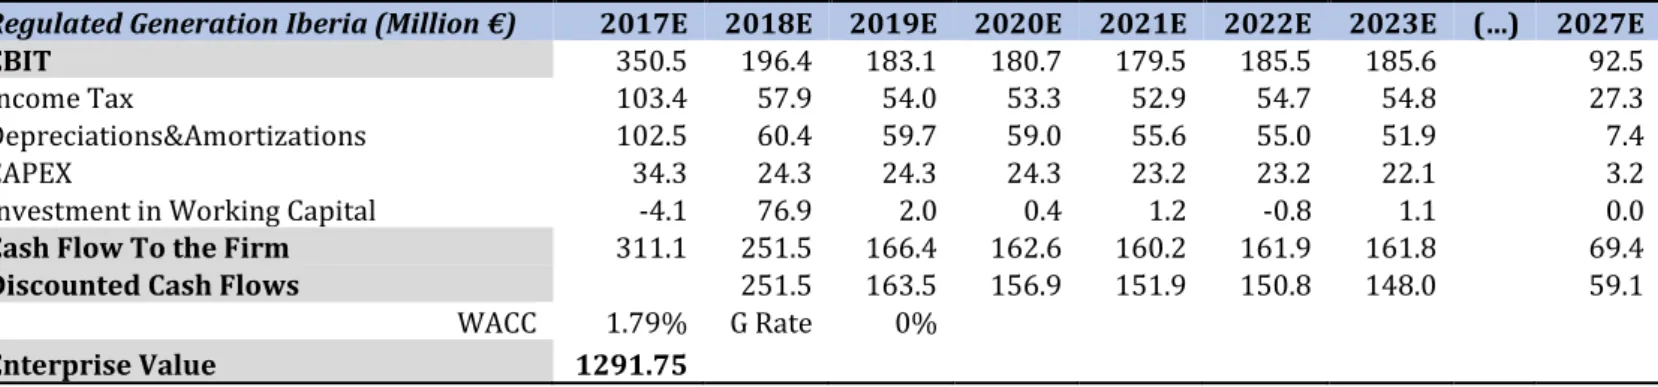
Regulated Generation Iberia (Million €) 2017E 2018E 2019E 2020E 2021E 2022E 2023E (…) 2027E
EBIT 350.5 196.4 183.1 180.7 179.5 185.5 185.6 92.5
Income Tax 103.4 57.9 54.0 53.3 52.9 54.7 54.8 27.3
Depreciations&Amortizations 102.5 60.4 59.7 59.0 55.6 55.0 51.9 7.4
CAPEX 34.3 24.3 24.3 24.3 23.2 23.2 22.1 3.2
Investment in Working Capital -4.1 76.9 2.0 0.4 1.2 -0.8 1.1 0.0
Cash Flow To the Firm 311.1 251.5 166.4 162.6 160.2 161.9 161.8 69.4
Discounted Cash Flows 251.5 163.5 156.9 151.9 150.8 148.0 59.1
WACC 1.79% G Rate 0%
Enterprise Value 1291.75
Figure 8: Typical Iberian merit curve. When there is a great production of
renewables, especially during Winter days, the supply curve is shifted to the right, eliminating the need for thermal plants to satisfy demand.
“EDP–ENERGIAS DE PORTUGAL” COMPANY REPORT
pay for the CO2 emissions that result from generating electricity. As such,
companies need to purchase licenses for the right to pollute, driving marginal costs from thermal plants up.
For that reason, although demand levels play a key role, pool prices are heavily dependent on weather conditions since during rainy and windy weathers, due to the higher production of hydro and wind electricity, those sources will satisfy a significantly share of total demand. As a consequence, less and more expensive electricity will be required from conventional power plants driving pool prices down. So, due to its high hydro installed capacity, EDP’s gross margins will vary according to weather conditions, being higher when hydro output is high (due to its low marginal costs) and lower otherwise.
Compared with its peers in the Iberian Peninsula, it is possible to conclude that the production of all companies varies significantly with the hydrological index5
due to the lack of solar capacity in their portfolios. However, the way the production varies differs across each company. Iberdrola, with a higher share of renewable capacity, benefits from wet weather, whereas Endesa and Gas Natural Fenosa benefits from dryer weather.
5 The hydrological index (HI) measures the relation between the historical average amount of rainfall with the actual
rainfall in a certain year. So, a HI = 1 means that in that year, the amount of rainfall is according with its historical values, whereas a HI < 1 means that the rainfall was below average, and vice-versa.
A perfect example of EDP’s dependence on wet weather is the current drought that the Iberian Peninsula is undertaking, which leads EDP to use more of its thermal plants which are more expensive compared with hydro plants, driving gross margins down.
“EDP–ENERGIAS DE PORTUGAL” COMPANY REPORT
Iberian’s additional installed capacity has been driven almost solely by renewables. For that reason, it would be expected to pool prices to converge to a marginal cost equal to zero, as a higher contribution of renewables satisfies total demand. However, weather conditions in Iberia are very unstable and for that reason thermal plants act as a backup electricity generator. As consequence, it is almost impossible for renewables to systematically satisfy demand (where due to a relatively residual solar installed capacity, renewable contribution is very dependent on rainy and wind weathers). The need for thermal plants will continue to remain pool prices at higher levels.
Liberalized supply is carried out by EDP Comercial and comprises EDP’s commercialization units in Portugal and Spain. Since the creation of MIBEL, consumers were given the possibility to migrate from the regulated market to the
2008 2009 2010 2011 2012 2013 2014 2015 2016 Hydrological Indedx Portugal 0.56 0.77 1.31 0.92 0.47 1.17 1.27 0.74 1.33 Spain 0.66 0.81 1.34 0.83 0.46 1.17 1.2 0.8 1.1 Endesa Installed Capacity (%) Thermal Plants 50.1% 59.2% 63.7% 63.6% 63.7% 63.6% 63.8% 63.0% 58.3% Nuclear Plants 15.0% 16.3% 15.9% 16.0% 15.9% 15.9% 15.2% 15.5% 14.5% Renewable 30.8% 24.5% 20.5% 20.4% 20.4% 20.5% 21.0% 21.5% 27.2% Cogeneration 0.0% 0.0% 0.0% 0.0% 0.0% 0.0% 0.0% 0.0% 0.0% Generation (GWh) 88189 72707 67049 75132 77386 69690 69681 73061 69831 Iberdrola Installed Capacity (%) Thermal Plants 33.87% 30.56% 28.74% 27.90% 26.50% 26.5% 26.0% 25.1% 25.0% Nuclear Plants 12.68% 13.01% 13.27% 13.30% 13.40% 13% 13.5% 13.0% 13.0% Renewable 52.01% 54.94% 56.42% 56.60% 58.50% 58.60% 59.0% 60.4% 60.4% Cogeneration 1.43% 1.48% 1.57% 1.60% 1.60% 1.50% 1.5% 1.5% 1.5% Generation (GWh) 67626 65316 71935 63711 57127 58076 61053 55512 62784
Gas Natural Fenosa
Installed Capacity (%) Thermal Plants 75.5% 74.5% 76.7% 72.1% 71.7% 74.8% 71.5% 71.0% 70.9% Nuclear Plants 4.4% 4.4% 4.0% 4.7% 4.7% 5.0% 5.0% 4.7% 4.7% Renewable 20.1% 21.1% 19.3% 23.2% 15.7% 24.4% 23.0% 23.8% 24.4% Cogeneration 0.0% 0.0% 0.0% 0.0% 0.0% 0.6% 0.5% 0.5% 0.0% Generation (GWh) 49802 38024 38338 38081 37144 33785 30542 31568 28504
With the development of renewable technologies at lower costs, there has been a dramatic increase in the renewable installed capacity.
“EDP–ENERGIAS DE PORTUGAL” COMPANY REPORT
liberalized one. Despite the slow pace of transition from one market to the other in the first years since its implementation, the liberalized market has in 2012 onwards attracted a large proportion of Portuguese consumers. However, there are still 1.4 million consumers in the regulated market. Regarding Spain, only in 2016 the majority of Spanish consumers were in the liberalized market.
The reality of EDP in both market is quite distinct. While in Portugal the company has a large majority of consumers’ market share, with over 80% of total consumers, in Spain it has a modest 9% share. However, in terms of GWh of electricity commercialization, EDP sells more in Spain (19129 GWh in 2016) than in Portugal (16 222 GWh). Furthermore, of all electricity commercialized in Portugal, EDP is only responsible for 46% despite its huge share in the domestic sector. This is due to the fact that EDP has approximately 20% market share
in the large consumers and industrial segments which have larger volumes of electricity consumptions.
Valuation
In order to evaluate this business, we assumed that all electricity generated by EDP is sold in the wholesale market at the pool price. Furthermore, all electricity that EDP sells in the retail market is purchased in the wholesale market adjusted by potential grid losses. As we will mention later in this text, the wholesale price at which EDP buys and sells electricity is not the same, although that difference is shrinking. Regarding the cost of producing electricity, it will depend on the energy mix used by the company.
To calculate the generation-mix of each year, we have considered each year’s installed capacity and the respective load factor. Additionally, we have computed the forecasted electricity demand in the Iberian Peninsula6 as well as
the electricity-mix that will satisfy that demand. In order to do so, we have forecasted the installed capacity by primary source of energy in Iberia as well as the respective load factor. As it was said before, the merit order effect makes electricity that was produced with low marginal costs to be the first used to satisfy demand. This means that renewable and nuclear electricity will be the first to be despatched. Using this logic in the model would mean that, theoretically, CCGT power plants would never be used due to their high marginal costs. However, since it is not plausible for renewable to fully satisfy total demand (due to specific weather conditions that had to be in place every year, especially in dryer days during the summer), we assumed CCGT’s load
6 We assumed that electricity demand in Iberia varies according with Iberia’s GDP. ΔElectricityt = α + β ΔGDPt , where α = 0.001 and β = 0.8191
for Portugal and α = -0.006 and β = 0.7006 for Spain. Electricity Production Iberia (2016)
Source of energy Capacity (MW) Production (GWh) Hydro 27 297 50 215.56 Nuclear 7 573 56 388.56 Coal 11 292 89 026.13 Combined cycle 28 777 239 482.19 Wind 27 946 61 201.74 Solar 7 168 14 442.09 Other Ren 1 005 5 282.28 Other Non-Ren 13 56.94 Cogeneration 7 828 32 915.17 Waste 677 2 372.21 Total theoretical production 551 382.87 GWh Total consumption 305 621.00 GWh
Electricity Prudction in Iberian (2024E) Source of energy Capacity
(MW) Production (GWh) Hydro 31 159 57 320.10 Nuclear 7 107 52 918.72 Coal 8 716 68 716.94 Combined cycle 29 513 245 607.19 Wind 35 216 77 123.04 Solar 11 634 23 440.18 Other Ren 1 779 9 348.32 Other Non-Ren 17 74.46 Cogeneration 10 684 44 924.08 Waste 1 341 4 698.86 Total theoretical production 584 171.90 GWh Total consumption 334 525.00 GWh
“EDP–ENERGIAS DE PORTUGAL” COMPANY REPORT
factor to be equal to its historical average and that all of that production is certain to be used to satisfy part of the demand. For the same reason we have considered that a fix percentage of total demand is always satisfy by coal production and, as such, we assumed that in each year, at least 10% of total demand is satisfied by coal power plants. To sum up, these productions are what we have considered to be the ones where conventional plants are used as backup sources of electricity.
Based on the generation mix of Iberia, we assumed that EDP’s share on its contribution to coal electricity will increase given that coal installed capacity in Iberia in decreasing whereas it is expected that EDP’s to remain the same. Regarding natural gas, we believe that EDP’s historical contribution will remain unchanged. For that reason, we project that future natural gas and coal production of EDP to be equal to those shares multiplied by the demand satisfied by natural gas and coal electricity in Iberia.
Coal and natural gas prices are expected to remain the highest among the different sources of energy. After a significantly leap in 2017, where coal prices reached 85$/ton (mainly driven by the Chinese efforts to reduce coal supply in order to fulfil environmental goals), World Bank expects a reduction to 70$/ton in 2018 and to 55$/ton in 2020. In 2021 onwards, coal prices will increase at a constant rate of about 0.9% per year. Regarding European natural gas prices, the same institution expects a constant increase of about 0.2$/MMBTu per year. This means that fuel costs in euros in EDP’s CCGT plants per MWh will increase at an average rate of 2.73%% every year assuming no alterations in the efficiency of its thermal plants7. Natural gas electricity cost per
MWh varies significantly with total production. Given the high fix costs that EDP faces for its CCGT plants, if production is low then the price per MWh will be very high. Since we assume a load factor around 10% for CCGT plants, we assumed a total cost per MWh (including fuel costs, CO2 licenses and other costs) equal to 60€/MWh (the same cost as in 2015, when the load factor was approximately 10%, adjusted by today’s lower natural gas prices) and increasing at a rate of 3.02%8 per year.
7 EDP’s Efficiency Rate: Coal plants: 36%, CCGT plants: 49%. (Source: EDP IR) Figure 9: Price of electricity by primary source for EDP (€/MWh)
“EDP–ENERGIAS DE PORTUGAL” COMPANY REPORT
Additionally, we assume that carbon prices will remain unchanged until and increasing very slightly 2020 onwards due to lack of political willingness to address the issues of the European Trading System. For that reason, we believe that coal power plants will remain more competitive than their natural gas counterparts.
Regarding nuclear, due to its stable and low marginal costs, we assumed a cost of 5 € /MWh as well as a load factor of 85%. Finally, costs from hydro power plants are mainly related with the electricity that is needed when EDP uses pumping technology. For that reason, we assumed that the electricity used to pump the water has a price per MWh equal to the pool price, thus varying accordingly to it. We used a load factor of 21% based on historical figures.
Finally, we assumed that the price per MWh that EDP pays to purchase electricity in the wholesale market is deeply related with the company’s cost of producing its electricity. For that reason, we believe that EDP’s cost of generating electricity acts as a proxy of a benchmark for the wholesale electricity price in Iberia. Furthermore, we believe that, as the MIBEL market matures even further, the difference between the price that EDP sells and buys electricity in the wholesale market to continue its past trajectory and to reduce to an average of 1€/MWh in the future.
Capital expenditures are expected to decrease from their historical figures given that EDP has already finalized its investments in hydro power. The only project that is currently under way is Fridão’s dam whose construction waits for authorities’ permission that was delayed to the year of 2019 following the revision of the Portuguese National Dams Programme. However, as a consequence of this year’s drought, the Portuguese Government addressed the need to build more dams, so we believe that authorities will give the “OK” to Fridão’s project. As such, assuming that the dam will start to be built in 2020, we expect to take 5 years for the project to be ready to produce electricity. For that reason, we assume CAPEX to be mostly for maintenance purposes in 2018 and 2019 and increasing in 2020 onwards following the construction of the dam.
For the valuation of the supply unit, we need to address some variables that most affect EDP’s gross margin.
The first one is pace of migration of consumers from the regulated market to
the liberalized market in Portugal, upon which we remain cautious. Given that the
final year for consumers to transit from one market to the other has already been changed once (from 2013 to 2020) as well as the possibility for consumers to go back again to the regulated market, we believe that the current final year will be CAPEX per MW will remain
unchanged from its historical values both for maintenance and for investment purposes.
Figure 11: Electricity clients in the regulated and
liberalized market in Portugal (%) (2008-2016):
Source: EDP Distribuição
Figure 10: Forecasted load factor by primary source of electricity for
“EDP–ENERGIAS DE PORTUGAL” COMPANY REPORT
delayed five more years. For that reason, we think that 2025 will mark the end of the regulated market in the country meaning a slower pace of migration from one market to the other.
Future’s electricity demand on both countries will vary according with the
respective GDP. However, we assume that the growth of electricity demand will not be equal to the GDP’s growth due to the reduction of the energetic intensity9
following efficiency gains in both countries.
We expect EDP’s market share to remain high among domestic consumers in Portugal. Furthermore, we believe that the majority of clients that leave the regulated market will opt to remain in EDP. That is an important assumption since domestic clients in the regulated market are still responsible for approximately 4000 MWh of electricity consumption. As for the Spanish segment we believe that EDP share to remain constant at 12%.
Finally, we believe that EDP’s retail price will remain constant over the years. Although the final electricity price for both household and industrial consumers has been increasing over the past decade, the energy component (the one that reflects utility companies’ retail price and varies accordingly with the cost of producing electricity) has remained relatively stable specially since 2013 despite some volatility regarding the pool price. This component may have suffered from the competition of the first years of the liberalized market, however we assume that competition forces will play a key role in stabilizing in the future. For that reason, we believe that EDP’s retail price to be around 60€/MWh, meaning that potential alterations in the cost of the electricity mix will not implicate a significantly change in the retail price.
Liberalized Generation Iberia (Millions €) 2017E 2018E 2019E 2020E 2021E 2022E 2023E 2024E
EBIT -94.6 251.2 302.7 310.0 291.2 263.4 267.5 439.2
Income Tax 0.0 74.1 89.3 91.4 85.9 77.7 78.9 129.6
Depreciations&Amortizations 277.3 319.1 312.2 305.6 303.3 298.2 296.0 345.9
Provisions 1.5 2.4 2.5 2.6 2.1 2.0 2.2 2.3
CAPEX 132.9 67.3 67.3 134.8 135.6 135.6 136.4 151.7
Investment in Working Capital -77.2 35.7 5.2 1.2 -3.7 -7.8 -11.8 -21.6
Cash Flow To the Firm -25.9 467.0 466.0 393.0 371.3 342.5 338.5 484.5
Discounted Cash Flows 467.0 450.8 367.8 336.1 299.9 286.8 397.0 WACC 3.37% G. Rate 1% Value 13 706.2 T.
Enterprise Value 16 311.6
9 Energy intensity is a measure of the energy efficiency of a nation's economy. It is calculated as units of energy per unit of GDP. High energy
intensities indicate a high price or cost of converting energy into GDP and vice-versa.
Figure 12: Components of final electricity tariff (left axis) in
Portugal and Portuguese pool price (right axis) 2008-2016.
“EDP–ENERGIAS DE PORTUGAL” COMPANY REPORT
Distribution
As it was said before, the distribution activity is considered natural monopoly. In Portugal, the concession of the national distribution of high and medium voltage electricity was given to EDP Distribuição for a period of 35 years started in 2009 whereas the distribution of low voltage was given to each municipality that then gives the concession to EDP Distribuição for a period of 20 years in exchange for a specific rent. The company is thus responsible for the exploration of 225 000 kms of the distribution grid. Since it is a natural monopoly, the remuneration of this activity is ERSE’s responsibility and has historically been relatively stable over the years. In Spain, EDP’s subsidiary HC Distribucion is responsible for operating a network grid of more than 22 000 kms in seven autonomous Spanish communities (Asturias, Huesca, Barcelona, Zaragoza, Valencia, Madrid and Alicante).
The primary principle in the remuneration system of this activity is to allow companies to have the necessary revenues that compensate them for the investments and operational costs from managing the distribution networks. However, regulatory authorities will have to create strategies that prevent distribution companies from over or under-invest in order to prevent negative consequences for consumers.
Valuation
Since it is a deeply regulated market, the assumptions used to evaluate this segment are very dependent on the parameters used by the regulator authority of each country.
Following the new regulatory framework adopted by ERSE for the 2018-2020 period, some parameters were altered for the calculation of the allowed revenues that resulted in a 12% decrease of that amount compared with the previous framework. That significant drop was the result of ERSE’s revision of EDP’s cost base due to the change in some unit variables used to calculate the amount of controllable costs. Furthermore, another alteration established new boundaries for the Return on Regulated Asset Base (RoRAB) for the High and Medium Voltage Distribution segment that may vary between 5% and 10%. ERSE estimates a RoRAB of 5.75% for 2018 (vs 6.48% in 2017). During the remainder of this regulatory period, since RoRAB is indexed to the Portuguese Government 10y Bonds, we expect this figure to increase giving the announced end of the current ECB’s Quantitative Easing program. Assuming Portuguese bonds will converge to their historical pre-crisis values, we believe RoRAB will increase to approximately 6.07%. On the other hand, ERSE calculated a preliminary RoRAB of 6% for the Low Voltage
Allowed Revenues under the Portuguese Regulatory framework: Pass-Through Costs: Costs of Transportation of electricity, Global Use of the System Costs and Low Voltage Concession Fees;
High and Medium Voltage: Price-cap
regulation for operational costs + Return on Regulated Asset Base (indexed to Portuguese 10y-Bonds) + acceptable depreciations;
Low Voltage: Price-cap regulation for
total costs;
Efficiency Factor of 2%;
Other costs not submitted to efficiency obligations and possible adjustments.
“EDP–ENERGIAS DE PORTUGAL” COMPANY REPORT
Distribution segment. No further explanations were given on how this rate might vary in the future, so we believe that it will change according with the Portuguese Bonds also like it did on previous regulatory frameworks.
Furthermore, the efficiency factor decreased from 2.5% to 2% reflecting ERSE’s belief that the company has done a good effort in reducing its controllable operational costs. As a consequence, the operational costs base and, for the Low Voltage Distribution segment the CAPEX base as well, should be adjusted annually for an efficiency factor equal to Portugal’s GDP’s deflator minus 2%. So, assuming GDP’s deflator projected by Conselho das Finanças Públicas to 2018 onwards, it is not expected for it to be higher than the efficiency factor, meaning a reduction in those allowed costs. Despite believing that EDP Distribuição has already made significant efforts to reduce controllable costs, ERSE thinks, however, that the company is able to reduce those costs even further. Since EDP benefits from matching allowing costs with its actual costs, we believe that the company will continue its efforts to reduce those costs, primarily the ones related with supplies and services and personnel costs. Finally, we assumed future’s electricity distribution to grow according to future’s electricity demand in Portugal. As of 2017, current tangible assets were valued at 2998.24 million Euros10.
CAPEX expenditures are expected to remain at their current levels due to a well-developed network grid in Portugal that does not require any type of very significant investments. For that reason, CAPEX will ultimately be used for maintenance purposes and to replace depreciation costs.
Regarding the Spanish operational business, EDP’s subsidiary HC Distribucion was one of the companies that most benefited from the overhaul of the remuneration system to distribution companies in 2016. As a result, from that reform, allowed revenues to HC Distribucion increase 20%. Under the current Spanish regulatory framework, the RoRAB is equal to 6.5%. CAPEX is not expected to change significantly from its historical values given the well-developed Spanish distribution grid and will be used to restore the depreciation costs each year.
10 Source: ERSE
“EDP–ENERGIAS DE PORTUGAL” COMPANY REPORT
Distribution Portugal (Million €) 2017E 2018E 2019E 2020E 2021E 2022E 2023E 2024E EBIT 251.01 185.73 168.02 186.26 82.99 89.75 97.69 104.30
Taxes 74.05 54.79 49.56 54.95 24.48 26.48 28.82 30.77
Amortizations and Depreciations 400.89 303.64 252.02 241.04 238.62 234.26 229.12 225.54
CAPEX 400.89 303.64 252.02 241.04 238.62 234.26 229.12 225.54
Working Capital 0.00 23.01 9.76 -1.09 14.74 -0.46 -0.55 -0.63
Cash Flow to the Firm 176.96 153.95 128.21 130.22 73.25 62.81 68.32 72.91 Discounted Cash Flows 153.95 125.96 125.68 69.46 58.51 62.53 65.55
WACC 1.79% G. Rate 0% T. Value 3 294.39
Enterprise Value 3 956.03
Distribution Spain Million €) 2017E 2018E 2019E 2020E 2021E 2022E 2023E 2024E
EBIT 108.38 101.47 81.03 79.63 80.32 80.13 82.74 81.27
Taxes 27.10 25.37 20.26 19.91 20.08 20.03 20.68 20.32
Amortizations and Depreciations 34.65 35.29 35.82 36.29 36.51 36.59 35.86 36.06
CAPEX 34.65 35.29 35.82 36.29 36.51 36.59 35.86 36.06
Working Capital -0.11 -0.11 2.49 0.00 0.00 0.00 0.00 0.00
Cash Flow to the Firm 81.17 75.99 63.26 59.72 60.24 60.09 62.05 60.95
Discounted Cash Flows 75.99 62.13 57.60 57.05 55.90 56.68 54.68
WACC 1.83% G. Rate 0% T. Value 2 685.48
Enterprise Value 3 105.50
EDP Brasil
The Brazilian Electricity Sector has faced major transformations since the beginning of the 90’s decade. The need for large sums of investments to develop new capacity in order for supply to keep up with an ever more increasing demand was incompatible with high-indebted companies, leading to the creation of the New Brazilian Electrical model. Under this major overhaul, there was the unbundling of vertically integrated companies and the generation, transportation, distribution and commercialization of electricity became separated operations. Furthermore, the private sector was now allowed to participate in the electrical sector and new regulatory institutions were created to oversee the entire sector. However, the main goal of that reform was not fully accomplished and by the time consumption had overcome demand in 2001 there was a severe shortage of electricity that obliged authorities to implement tough consumption restrictions. More changes were thus necessary. In 2004, new reforms were adopted that led to the implementation of a dual regulated and liberalized system as well new institutions. In the liberalised market, electricity is traded among production concessionaires, independent power producers, auto-producers, agents and free consumers and all contractual conditions are traded freely. On the other hand, in the regulated market, distribution companies play a key role in estimating the electricity demand for a period of 3 or 5 years that they have to buy through regulated auctions where generating companies compete to sell their production. Until the early years of the 90’s
decade, electricity related activities were mostly state-owned and poorly managed.
Due to the systemic production deficit since 2012 generating companies had to resort to the Short-Term Market and face the negative consequences of the exposure to spot prices. Furthermore, the economic crisis affecting Brazil led to a reduction of electricity demand that was below the one distribution companies were obliged to buy under the contracts with generation companies.
“EDP–ENERGIAS DE PORTUGAL” COMPANY REPORT
As such, generating companies sell a fix amount of electricity to distribution companies and a variable revenue depending on the operating costs. In case the producer is unable to deliver the contracted electricity, it has to buy it in the Short-Term Market being exposed to the Liquidation Differences Price (PDL in the Portuguese anacronym). Distribution companies may only operate in the regulated market. Most of the electricity generated is sold in the regulated market. The economic and political crisis that affected Brazil specially after 2015 turned out to be very challenging years for distribution companies due to reductions in the electricity demand. However, as Brazil stabilizes and recovers from its economic crisis, we believe that the country offers great potential to EDP. On the other hand, there has to be high doses of caution due to the fragile political landscape, yet very vulnerable to scandals that may create more challenges to the economic activity.
Valuation
EDP is present in the generating, distribution and commercialization activities in Brazil. In 2016, the company took its first steps in the transmission business. Regarding the generating business, EDP’s installed capacity is focus on hydropower, with a thermal coal plant in Pecém. This installed capacity is very dependent on regulation with most of them under PPA frameworks. Tariffs paid for electricity from hydro plants are fixed by regulatory authorities and indexed to the annual inflation rate.
In the distribution segment, EDP has full control of EDP Escelsa and EDP Bandeirante. This business segment is also deeply regulated and allowed costs are computed by the regulatory authority for a four-year period, with annual adjustments. These costs comprise two components: component A are the non-controllable costs that distribution companies cannot affect and component B that
includes the controllable costs. Since non-controllable costs are recouped through a pass-through process whereas controllable are not, this means that EDP is immune to the costs it cannot influence and that the company’s earnings in this operating business will vary accordingly with controllable costs. As such, we assumed that EDP’s distribution revenues as well as its controllable costs to increase at the same rate. In 2016, EDP greatly increased its CAPEX claiming to prioritize a modernization of its grid. We expect CAPEX to remain at levels higher than its historical figures due to the existence of projects already under way to expand the network as well as the efforts to combat grid losses in line with the
regulatory authority’s target.
EDP took its first steps in the transmission activity in 2016 when it won the right to build and explore 113 km of network lines. This year the company has expanded Distribution Activity:
Non-Controllable Costs:
-Cost of purchasing electricity to generation companies;
-Transmission Costs; -Other Sectorial Costs.
Controllable Costs:
-Personnel and some materials costs; -Return on Regulatory Assets; -Depreciation and Amortizations Costs.
Figure 14: EDP Brasil's EBITDA decomposition in
“EDP–ENERGIAS DE PORTUGAL” COMPANY REPORT
its portfolio, having won approximately 1150 km of additional network projects. These projects will require investments of 3 billion Reais and are granted a fixed revenue to be paid when the project is under full operation that we have assumed to be indexed to the inflation rate. According to ANEEL, these projects have an implied rate of return of 13% after taxes so, giving our estimated WACC of 3.5%, we believe that not only is a good opportunity to EDP to diversify its businesses but also to reinforce its low-profile risk in the country.
Generation&Supply Brazil
(Million B. Reais) 2017E 2018E 2019E 2020E 2021E 2022E 2023E 2024E
EBIT 1120.43 1225.81 1280.53 1334.79 1391.66 1451.89 1515.30 1581.65
Taxes 380.95 416.78 435.38 453.83 473.17 493.64 515.20 537.76
Amortizations and Depreciations 213.20 218.89 224.85 230.80 236.55 241.45 245.77 249.87
CAPEX 558.00 576.72 581.35 575.11 534.99 508.71 499.84 486.00
Working Capital -334.96 0.84 -27.83 -15.20 -15.09 -15.69 -16.32 -16.97
Cash Flow to the Firm 59.73 452.05 460.82 521.45 604.97 675.30 729.72 790.79 Discounted Cash Flows 452.05 445.24 486.77 545.64 588.47 614.39 643.29
WACC 3.50% G. Rate 1% T. Value 20 929.05
Enterprise Value 24 704.91
Transmission Brazil (Million B. Reais) 2017E 2018E 2019E 2020E 2021E 2022E 2023E 2024E
EBIT 0.00 0.00 0.00 0.22 0.05 -6.24 -2.98 0.41
Taxes 0.00 0.00 0.00 0.07 0.02 0.00 0.00 0.14
Amortizations and Depreciations 0.00 0.00 0.00 3.35 8.76 87.79 87.79 87.79
CAPEX 28.50 611.88 611.88 611.88 583.38 537.38 0.00 0.00
Working Capital 0.00 0.00 0.00 -2.95 -4.34 -60.19 -2.70 -2.81
Cash Flow to the Firm -28.50 -611.88 -611.88 -611.34 -578.92 516.02 - 82.11 85.26 Discounted Cash Flows -611.88 -591.19 -570.69 -522.15 449.67 - 69.14 69.36
WACC 3.50% G. Rate 1% T. Value 2 820.43
Enterprise Value 213.35
Distribution Brazil (Million B. Reais) 2017E 2018E 2019E 2020E 2021E 2022E 2023E 2024E
EBIT 300.33 442.73 432.76 461.06 488.93 518.55 550.06 583.53
Taxes 102.11 150.53 147.14 156.76 166.24 176.31 187.02 198.40
Amortizations and Depreciations 190.26 204.11 211.12 217.88 224.24 230.42 236.35 242.02
CAPEX 536.52 379.45 380.01 376.97 378.81 378.60 378.13 378.51
Working Capital 115.67 -53.50 -10.75 -27.73 -27.67 -28.72 -29.81 -30.95
Cash Flow to the Firm -32.38 63.36 105.98 117.48 140.45 165.34 191.44 217.68
Discounted Cash Flows 63.36 102.39 109.66 126.68 144.08 161.19 177.08
WACC 3.50% G. Rate 1% T. Value 5 761.26
“EDP–ENERGIAS DE PORTUGAL” COMPANY REPORT
Gas
EDP’s gas operations has seen its contribution to the company’s EBITDA greatly reduced in 2017 following the sale of its gas distribution units in Portugal (Portgás) and Spain (Naturgas). The deals were valued at 532 and 2591 million Euros, respectively leaving EDP only present in the supply segment in the gas market. In our opinion, these divestments reduce the low risk-profile of EDP in Iberia and marks the end of stable cash flows that regulated companies provide, however with low growth opportunities. Furthermore, regarding the ratio between the EBITDA and the selling price of these units, we believe that EDP, when compared with other similar deals, made a good business regarding the Spanish business (15.70 vs 13.82 average multiples) and a poorly one in the Portuguese one (10.86 vs 13.82). However, if we compared the multiple of the deal when EDP acquire 29.43% Naturgas in 2009, the implied multiple was 9.411.
EDP Renováveis
EDP Renováveis (EDPR) is a subsidiary of EDP that went public in 2008 with an IPO price of 8 €. Its main activity is the generation of electricity based primarily from wind-sources and has operations in 11 countries.
EDPR’s EBITDA has been increasing over the years with its share in the group’s total EBITDA rising to 31.15% in 2016. With an installed capacity of 10.24 TW, the subsidiary is responsible for most of the additional installed capacity of EDP and has currently investment-plans worth of 3150 million Euros to allocate primarily in its North America’s business segment. The company has been taking advantage of the generous subsidies giving by countries to renewables sources of energy leading to a highly regulated generation mix that benefits from long-term PPAs. For that reason, EDPR has enjoyed very predictable cash flows from its operations.
11 Source: EDP
Following the failed attempt to buy all EDPR’s shares in 2017, EDP saw nevertheless its control over its subsidiary to rise from 77.5% to 82.5%.