THIS REPORT WAS PREPARED BY “STUDENT’S NAME”, A MASTERS IN FINANCE STUDENT OF THE NOVA SCHOOL OF BUSINESS AND ECONOMICS, EXCLUSIVELY FOR ACADEMIC PURPOSES. THIS REPORT WAS SUPERVISED BY ROSÁRIO ANDRÉ WHO REVIEWED THE
VALUATION METHODOLOGY AND THE FINANCIAL MODEL. (SEE DISCLOSURES AND DISCLAIMERS AT END OF DOCUMENT)
See more information at WWW.NOVASBE.PT Page 1/33
MASTERS IN FINANCE
E
QUITY
R
ESEARCH
We have started the valuation on Iberdrola with a Hold recommendation, with a target price 6.24 EUR, which is a 6.14% return on Iberdrola`s current share price. The stock trades above its peers in P/E (+8.07%) and in EV/EBITDA (+32.13%)
Until 2020, Iberdrola intends to primarily invest in highly regulated sectors such as the Networks and Renewables (78% of the CAPEX). Wind offshore will see an unprecedented investment and many CCGTs will open in Mexico
The CO2 and renewable targets that were defined in COP 21 for renewables and the gap between current wind installed capacity and the one targeted by the EU, entails that investment in renewables will be eased over time (less regulatory risk)
The issue of the Spanish tariff deficit appears to be behind as for the past two years surpluses have been accomplished and the system debt is on a sustainable path
The ambitious expansion plan until 2020 will marginally increase Financial Leverage (+1.96%)
Company description
Iberdrola is the biggest utility company operating in Spain with a leading position in renewables (mostly wind energy). Iberdrola is a global, vertically integrated value chain, which can be separated into three different businesses: power generation, power transmission and distribution and, finally, supply of electricity and gas to end-users.
I
BERDROLA
C
OMPANY
R
EPORT
U
TILITIES
6
J
ANUARY2017
S
TUDENT
:
J
OÃO
R
AMOS
[email protected]
Betting on Stability
Improving earnings visibility for the future
Recommendation: HOLD
Price Target FY17: 6.24 €
Price (as of 6-Jan-17) 6.13 €
Bloomberg: IBE SM Equity
52-week range (€) 6.597-4.80 Market Cap (€m) 36.432 Outstanding Shares (m) 6362.08 Free Float 76,08%
YTD (%) -3.99%
Source: Bloomberg
Source: Bloomberg
(Values in € millions) 2015 2016E 2017F Revenues 31,419 31,042 30,642
EBITDA 7,306 7,555 7,815
Net Profit 2,422 2,172 2,295
EPS 0.382 0.341 0.361
DPS 0.275 0.256 0.271
P/E 16.88 17.96 16.99
Div Yield (%) 4.26 4.18 4.41
ROE (%) 6.52 5.91 5.23
ROIC (%) 4.57 3.85 3.98
EV/EBITDA 9.55 9.08 8.88
Net Debt/EBITDA 3.96 3.92 3.89 Leverage (%) 41.38 41.64 41.92
20 40 60 80 100 120 140 160 180 04- 01-201 1 18- 04-201 1 02- 08-201 1 14- 11-201 1 27- 02-201 2 12- 06-201 2 24- 09-201 2 09- 01-201 3 25- 04-201 3 07- 08-201 3 19- 11-201 3 06- 03-201 4 20- 06-201 4 02- 10-201 4 19- 01-201 5 05-201 5 17- 08-201 5 27- 11-201 5 14- 03-201 6 28- 06-201 6 10-201 6
“IBERDROLA S.A.” COMPANY REPORT
PAGE 2/33
Table of Contents
EXECUTIVE SUMMARY ... 3
COMPANY OVERVIEW ... 4
COMPANY INTERNATIONAL PATH ... 4
BUSINESS DESCRIPTION ... 5
SHAREHOLDER STRUCTURE ... 6
LEVERAGE ANALYSIS ... 7
MACROECONOMIC ENVIRONMENT ... 7
ECONOMIC AND POLITICAL SUMMARY ... 7
ELECTRICITY MARKET DYNAMICS AND OUTLOOK ... 9
POWER PRICES ... 10
RENEWABLES NEW WAVE ... 12
IBERIAN PEER ANALYSIS ... 13
SEGMENTAL FORECAST ...14
OUTLOOK FOR THE OVERALL BUSINESS ... 14
NETWORK BUSINESS ... 15
RENEWABLES ... 18
GENERATION AND SUPPLY ... 20
VALUATION ...24
DISCOUNT RATES ... 24
SENSITIVITY ANALYSIS ... 25
FAIR VALUE AND FINAL REMARKS ... 26
FINANCIAL STATEMENTS ...29
APPENDIX ...30
APPENDIX 1:NET DEBT/EBITDA VS %REGULATED ACTIVITIES (2015) ... 30
APPENDIX 2:INTEGRATED UTILITIES MULTIPLES ANALYSIS ... 30
APPENDIX 3:COST OF CAPITAL SEGMENTAL ANALYSIS ... 30
APPENDIX 4:UNLEVERING THE EQUITY BETA OF THE COMPARABLES ... 31
APPENDIX 5:SUM OF THE PARTS VALUATION ... 31
APPENDIX 6:IBERIAN PEER ANALYSIS ... 32
APPENDIX 7:POWER PRICES AND COMMODITY FORECAST ... 32
“IBERDROLA S.A.” COMPANY REPORT
PAGE 3/33
Executive summary
Iberdrola is the largest utility company in Spain and is the leader in wind energy in the world. As of the end of 2015, the company`s installed capacity was equal to 44,574 MW and its overall net production was 130,594 TWh. Furthermore, the main employed technologies in decreasing order are the following ones: Wind Power, Gas combined Cycles, Hydraulic, Coal, Nuclear and Cogeneration. In fact, 64% of the generation mix is emission free, as a result of the continuous bet of Iberdrola in clean and efficient energy. Due to the CO2 and renewables targets defined in COP 21 along with the UK carbon tax (₤18/ ton of CO2) and policy to close all coal plants until 2025, Iberdrola closed in early 2016 a 2300 MW coal plant in UK. Moreover, the company will the launch of many CCGTs and Cogeneration plants in Mexico (3450 MW until 2020), as well as the opening of a very large Hydroelectric complex in Portugal (1200 MW). As far as renewables are concerned, we must highlight the two substantial investments: onshore wind in the US (1443 MW will be added until 2020) and an unprecedented bet on offshore wind in the UK and in the RoW. The latter will take 45% of all the investment in renewables until 2020 – 2,925 M€ - and 1639 MW will be added. Most of the investments will not take place in Spain thanks to the lower allowed returns in renewables and networks than in other regions as well as stagnant liberalised business. Nevertheless, the Spanish electric tariff deficit has entered into a sustainable path after 14 years of annual deficits. In the end of 2015, 54.29% of Iberdrola`s EBITDA derived from outside Iberia, which is a higher percentage than its Iberian peers (EDP, Gas Natural and Endesa). The comfortable balance sheet of the company will allow the realization of the ambitious target of 21.172bn€ investments for the period of 2016-20 (leverage will increase slightly from 41.38% to 42.20%, from 2015 to 2020). The fact that 78% of this investment will be directed into regulated and long-term contacted activities (70% will take place in the UK and in USA) provides great visibility, security and cash-flow stability on the future of the company. The company will only begin to create value from 2020 onwards (total ROIC of 4.33% will exceed the WACC of 4.25%), as a result of its heavy investments that take time to create value
In 2016, Iberdrola`s performance outperformed the sector (SX6E) outperformed by 3% (Iberdrola had a return of -4.82%) mostly due to the strong impact from Brexit (great devaluation of the sterling) and also due to fall in power and commodity prices. I start covering Iberdrola with a Hold recommendation and I have achieved a target price of 6.24€, through a SOTP valuation (6.14% upside).
Iberdrola`s performance has been weaker than SX6E due to the impact from Brexit and fall in power and commodity prices
64% out of 130,594 TWh generated in 2015 was emission free
78% of the investment until 2020 will be directed into regulated and long-term contacted activities Iberdrola will close coal plants, launch more CCGTs and continue to bet on onshore and offshore wind
“IBERDROLA S.A.” COMPANY REPORT
PAGE 4/33 Company Overview
Company International Path
In 1992, Hidroeléctrica Espanola and Iberduero joined to become Spain`s largest private electricity utility (Iberdrola). Then, from 2001, Iberdrola consolidated its position as a global leader in the development of clean energies, looking ahead to future trends in the sector at an early stage. This bet had to do with the company`s prediction in 2001 that there would be a surge in world energy demand that would only be satisfied by clean and sustainable energy sources. In 2007, Iberdrola decided to get involved on a major expansion process, through the increase of its presence in the UK via the integration of Scottish Power (purchased for 17.1bn EUR in April 23rd 1). As a result of this acquisition, net
income increased 42% relative to 2006 and assets have more than duplicated (+106%). More importantly, since shareholders` equity increased 163.3% and net debt increased only by 56%, financial leverage2 decreased from 55.3% in 2006 to
42.4% in 2007. All in all, it allowed to create value for shareholders as in 2007 shares rose 25.6%, while the EuroStoxx Utilities rose 24.2% and the Ibex-35 grew 7.3%. In 2008, Iberdrola expanded to the US and Energy East3 was
purchased for 6.4bn EUR in June 25th. In 2011, as part of the expansion to
high-growth economies to offset the weaker Spanish home market, the company acquired the Brazilian company Elektro for a value around 1.6bn EUR4. The
purpose was to merge Elektro with the Neoenergia (Iberdrola owned 39% of this company), making the combined entity one of the largest utilities in Brazil. Finally, in 2015, Avangrid5 is created from the amicable merger between Iberdrola UDA
and UIL holdings corporation for 3bn USD. This made that total financial debt to increase from 14.352bn € (2006) to 30.561bn € (2015).
The company has the following business lines and is present in the following countries: Networks (Spain, USA, UK and Brazil), Liberalised and Supply (Spain, Mexico and UK) and Renewables (Spain, USA, UK, Latan and Rest of the World).
1This acquisition was one of the largest Spanish history and three capital increases were carried to enable the transaction. Scottish Power contributed
24% to 2007 Iberdrola`s EBITDA and electricity production increased 34.2% in that year. Immediately after the acquisition was announced the stock lost more than 2%, as the market turned disappointment that the offer was not all cash (54% debt financed)
2 Financial leverage= Net Debt / (Net Debt + Shareholders` Equity)
3Also known as Iberdrola USA, this deal was 48% debt financed. In June 25th the stock fell 3.8% and in the space of a month the stock did not recover, So, in the short term this deal did not add value for the shareholders, maybe due the fast pace of capital increases and expansion of debt to fund the acquisitions made in 2007.
4 All cash deal, but Iberdrola assumed 369M € of debt of Eleckro. At the date of the announcement Iberdrola´s shares rose 0.9% to 6.22€
5Iberdrola has a 81.5% stake in Avangrid. When this deal was announced in 24th of February the stock rose 2.4%. This company is the result of the merger between Iberdrola USA and UIL Holdings, creating a larger and more diversified utility company with seven highly regulated electric and gas utilities and a 6.5 GW long term contracted in renewables with 30bn USD in assets. It was expected to offer stable returns to offset the sluggish economy in Spain
From an early stage, Iberdrola decided to invest in
sustainable sources energy that would meet the global rise of energy consumption and has been exploring growth opportunities outside the Spanish market.
“IBERDROLA S.A.” COMPANY REPORT
PAGE 5/33
Business Description
As most of the Utilities, Iberdrola is vertically integrated, meaning that it owns all levels of the supply chain. In the first phase of the value chain, Iberdrola generates electricity through the construction, operation and maintenance of generating plants and purchase/sale of energy on the wholesale markets. The fact that Iberdrola`s portfolio is highly comprised of gas and wind power is quite valuable as, according to the World Energy Outlook 2015, most of the capacity
added until 2040 will be in gas, wind and solar. In the second phase it transmits and distributes power needed to transfer electrical power from the production centres to the end users. Finally, the retail sale of energy consists of the supply of energy to end users. As of the end of 2015, 90.2% of all end users were in the residential segment. In Iberdrola`s activity, there is a clear focus on basic and regulated businesses, and approximately 76% of the EBITDA (as of September of 2016) came from regulated businesses and long-term contracts (Networks+ Renewables + Regulated Contraction). The main risk arising from these regulated activities is the regulatory risk, due to the unexpected introduction of laws, regulations or amendments to the already existing ones, but are less exposed to market and demand risks. However, this segment is not necessarily more stable, as the measures in this sector in Spain came to prove in 20126.
Also, the recent result of the US elections have also come to add more regulatory risk to renewables, which are also highly regulated and subsidized. It is worth saying that the majority of the overall regulation that affects Iberdrola has a long visibility window (only two operations in the US have a regulatory review in 2017). On the other side, the generation and supply business is mainly affected from fluctuations in commodity prices, plant availability, change in electricity and gas demand and changes in weather, which affects hydroelectric and wind energy. These variations will affect the load factor of each technology, which will make the earnings of this sector to vary accordingly7.
As it will be further covered in the “Discount Rates”chapter, it is fair to say that utilities with more regulated activities have a lower systematic risk, than the ones with a higher percentage of liberalised operations8. Indeed, this systematic risk
can be measured by the average of the unlevered betas of the comparables. For
6In fact, in 2013 EBITDA fell 16.45% relative to the previous year. In 2012 and 2013, the Spanish government cut in the remuneration of networks,
increased access tariffs, introduced a 7% on electricity generation and cut renewables, waste and co-generation compensation. This was done to tackle the unsustainable electricity deficit. In fact, accumulated deficit peaked at the end of 2013 at 29bn €. According to IEA, it should disappear over the next 15 years
7 For example, a contraction in electric demand along with an increase of the variable cost of gas in Spain (if, for instance Brent were to increase its
price), would probably drastically reduce the remuneration of Gas central plants as now they would be less and less remunerated at market prices (would enter less in the merit curve), This would have more negative impact in Gas Natural than Iberdrola, since the former had a 57% market share and Iberdrola just 9% of all the installed capacity of CCGTs as of 2015, in Spain. Further clarification will be provided in the “Electricity Market
Dynamics and Outlook”
8This analysis was based on the main European utilities (Iberdrola peers) in the in the “Discount Rates” chapter
Figure 1: EBITDA of business lines in 9M 2016
Figure 2: 2015 Net Output from Iberdrola`s Generation Plants Source: Iberdrola’s Website
“IBERDROLA S.A.” COMPANY REPORT
PAGE 6/33 regulated utilities we ended up with a beta unlevered of 0.434 and for utilities with higher percentage of liberalised activities we achieved a value of 0.525 (21% higher).
As far as the share of earnings is concerned, the majority of Iberdrola`s earnings comes from outside of pain and is now close to 55%. This is mostly due to the continuous regulatory and economic instability that the country has been witnessing, as it was already mentioned. Inversely, a significant portion of the earnings has been coming from stable and high-rating countries like the US and the UK, and from emerging economies such as Mexico and Brazil.
Finally, the company is the number one renewables producer among European utilities and its emissions are 30% below average of the European sector. Additionally, Iberdrola has the commitment of 50% emission reduction by 2030 and to be Carbon Neutral by 2050, which helps to explain the closure of the 2300 MW coal plant and the continuous bet on wind and hydroelectric energy.
Shareholder Structure
The main shareholders of Iberdrola are Qatar Investment Authority with 9.73%
and Kutxabank SA with 3.60% of current shares and total voting rights. Also, the
percentage of free float is more than three quarters, entailing that there is a lot of liquidity in Iberdrola`s shares. No major changes are expected to take place in the future from the major shareholders and Iberdrola will continue its scrip dividend program. This shareholder remuneration system was implemented to allow a shareholder to decide if he wishes to receive all or a portion of their compensation in cash or in paid-up shares of Iberdrola. The shareholder can sold his rights to Iberdrola and he will receive cash at the guaranteed fixed price per right9 or he can sell them on the market. This system has been in practice in
previous years and is expected to be maintained in the future. The future payout should be between 65%-75%10, according to Iberdrola`s guidance. Also, the
number of shares was assumed to be kept equal to the number registered in the end of September of 2016 - 6,362M
In the financial year of 2015, the most significant changes in the shareholding structure were the following ones, as described in the 2015 annual report:
Actividade De Construcción Y Servicios, S.A decreased their share capital to below 3% in late March and Norges Bank in late December increase their share capital to above 3%.
9 Since in the first nine months of 2016 net profit stood at 2,042M€, up 6.4% with respect to the same period in 2015, Iberdrola has decided to increase shareholder remuneration by 8%, which will be done by the purchase of each allocation right of at least 0.135€ (share buyback to avoid dilution of its shares)
10Based on the past payout ratios that we have computed for Iberdrola, a 75% payout ratio was assumed from 2016 until perpetuity The International share of the
earnings has been increasing and is now close to 55%, due to the continuous political and economic instability in Spain
Figure 3: EBITDA per
Country (% M€) 2015
Figure 4: Shareholder
Structure as of the end of 2015 Source: Analyst`s Research and Company Report
“IBERDROLA S.A.” COMPANY REPORT
PAGE 7/33
Leverage Analysis
First of all, as a result of the expansion plan already described above from Iberdrola, a lot of debt has been accumulated since 2007. Financial Leverage has been gradually reducing from 2008 after the acquisitions of Scottish Power (2007) and Energy East (2008) from 52.50% to 41.38%, in the end of 201511.
According to our future expansion program for Iberdrola, since net debt grows at a slightly larger pace than shareholder`s equity12 financial leverage is estimated
to increase 2%, from 41.38% to 42.20%. Note that thanks to the significant growth estimated in EBITDA from these investments, Net Debt/EBITDA is estimated to decrease from 3.96 (2016) to 3.68 (2020). Finally, gross financial debt is estimated to increase 9.26% to 33,422bn € and Net debt to 9.88% (27,358bn €).
In 13th of February of 2016 Moody`s attributed the Baa1 rating for the senior unsecured Iberdrola`s debt. The rating rationale had to do mostly with Iberdrola`s exposure to a weakening power price environment due to the fall in commodities prior to this rating decision (coal declined over 20%). Generally, the higher the percentage of the regulated business, the higher is the ability of utilities companies to contract more debt without hurting its credit rating. This is mostly due to the higher degree of cash flow visibility of regulated activities relative to liberalised ones (this evidence is shown in Appendix 1). In September of 2016, Iberdrola`s overall regulated business represented 76% of Iberdrola`s EBITDA, which was above most of its closest peers average (shown in Appendix 6), which supports superior overall cash flow stability and predictability.
Iberdrola`s has taken advantage of the current low interest rate environment, reducing financial costs from 2013 until 2015 as its floating rate debt (mainly in EUR) increased from 37% to 54.4%. There is a structural FX hedge by having a similar percentage debt in the same currency that the funds from operations are coming from.
Macroeconomic Environment
Economic and Political Summary
The consensual macroeconomic outlook is that there will be a global moderate economic recovery and that interest rates will gradually increase as monetary
11Total financial debt increased from 14.352bn € in 2006 to 30.561bn €, in the end of 2015
12Total shareholder equity was estimated to increase 7.8%, without any future capital increases from shareholders. The only growth driver is the
positive difference between the net profit and the distributed dividends in each year
Iberdrola`s leverage will marginally increase in the future, after having
accumulating a lot of debt on its international expansion plan in the past. From 2008 until 2015 financial leverage was gradually reduced
Moody`s attributed Baa1 rating to Iberdrola`s debt and S&P attributed BBB+
Source: Iberdrola`s Website Source: Iberdrola`s annual Report 2015
Figure 5: Historical
Leverage and Financial Debt Analysis
Figure 6: Real GDP Growth Rate Historical and Estimates Source: Analyst`s Estimates and Company Report
“IBERDROLA S.A.” COMPANY REPORT
PAGE 8/33 policies normalize, with the exception of Brazil where rates will be cut. According to the IMF, World`s GDP growth rates should be around 3.4%-3.6% in the next 5
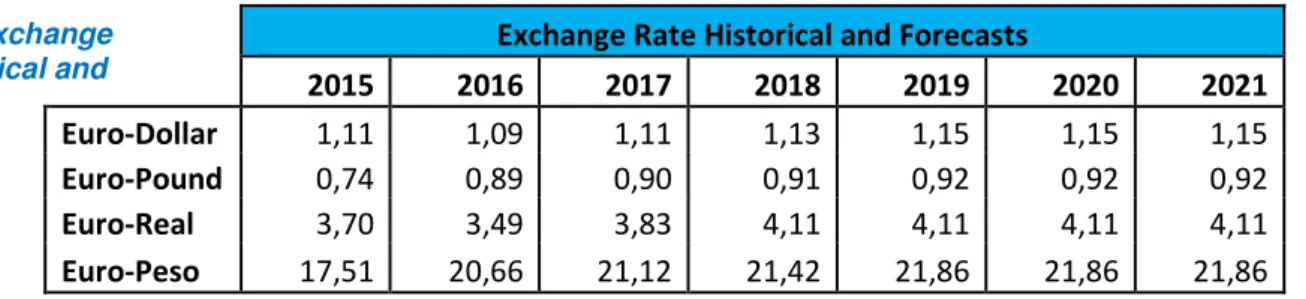
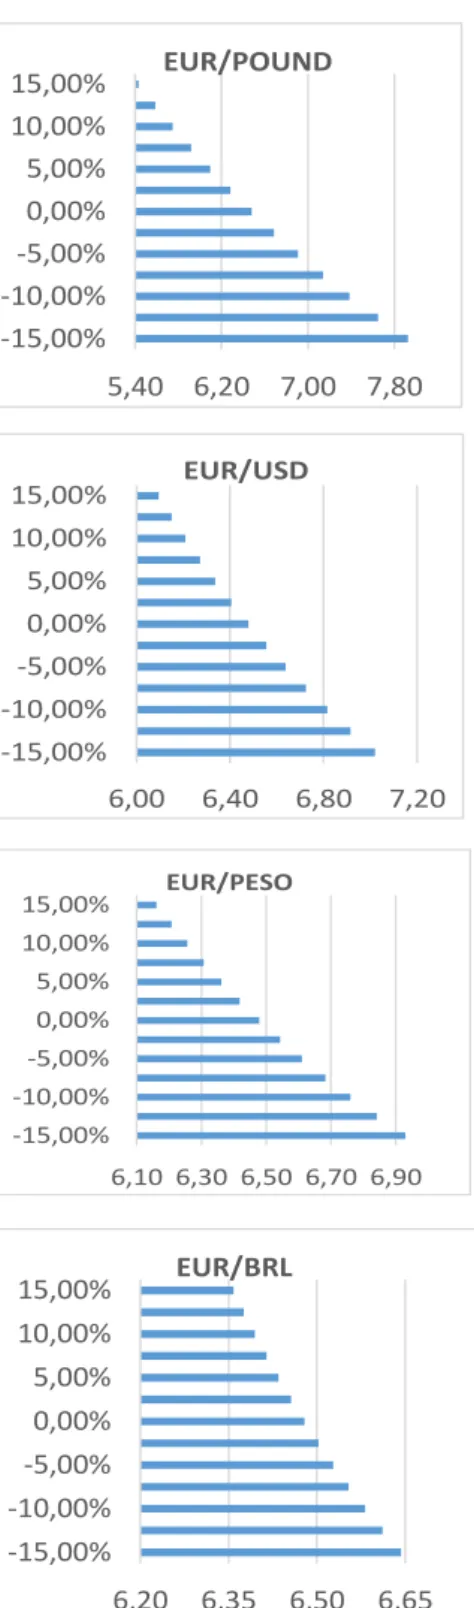
years and this growth will be mostly fuelled by emerging economies (4.3%-4.7%), whereas advanced economies should continue to modestly recover (1.9%-2.1%). The ECB should continue its accommodative monetary policy in a context of low inflation and low interest rates, which benefits dividend-like stocks such as utilities. On the other hand, in the US, gradual tightening of the monetary policy will continue to take place due to the continuous strong performance of the economy. As to Latin America, the rapid fall in oil and commodity prices has been having a negative impact and have come to exacerbate the ongoing troubles in the region. Thus, investors will also require a higher interest rate due to the higher expected rate of depreciation of the currencies, as seen in the forward market (in which all the exchange rates were drawn upon).
In Spain, after the country struggled until recently after the crisis, the macroeconomic outlook appear to be stable, especially now that there is a solid government in the country. In the UK, the impact on Brexit is so far negligible on UK utilities. However, despite the limited sector risk, the P&L will look weaker when earnings are converted into EUR in the future, as after the exchange rate against the EUR is significantly higher than it was in 2015. In the US, with the recent and unexpected election of President Trump, there might be some instability for the growth of renewables projects and wind farms in particular, since he highly supports coal and fossil fuels. Despite, some controversial statements regarding CO2 emissions and the Paris agreement from the President, production tax credits of renewables do not appear to be under pressure (vital to renewables in the US). Moreover, we might have ahead of us a tighter monetary policy as a consequence of the increase in public spending that Trump supports. In Brazil, GDP growth is not expected until 2017/18, with the economy approaching the 2% in 2020. Inflation rate should decrease from the 9% registered in 2015 to 5% in 2020. It remains the most challenging market for Iberdrola, whereas, in Mexico both GDP growth and inflation by 2020 should be nearly 3%, this region is expected to be one of the growth drivers for the group.
Exchange Rate Historical and Forecasts
2015
2016
2017
2018
2019
2020
2021
Euro-Dollar
1,11
1,09
1,11
1,13
1,15
1,15
1,15
Euro-Pound
0,74
0,89
0,90
0,91
0,92
0,92
0,92
Euro-Real
3,70
3,49
3,83
4,11
4,11
4,11
4,11
Euro-Peso
17,51
20,66
21,12
21,42
21,86
21,86
21,86
In the US, renewables will go through a volatile process after Trump presidency; in the UK, Brexit we expect future
currency devaluation; in Brazil the economic scenario is the darkest as the country recovers from the latest economic recession
Figure 7: Long term Inflation estimates
Source: Analyst`s Estimates and IMF data
Figure 8: Exchange Rate Historical and
“IBERDROLA S.A.” COMPANY REPORT
PAGE 9/33
Electricity Market Dynamics and Outlook
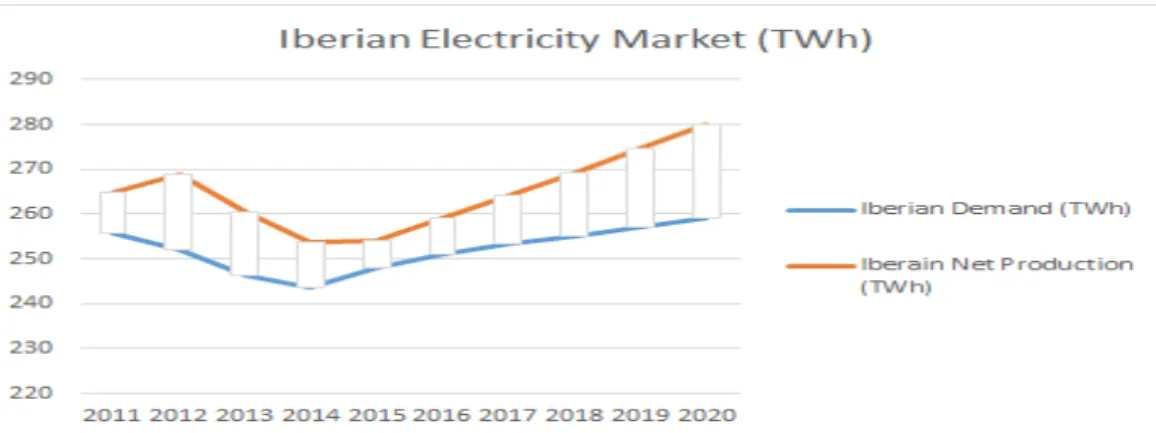
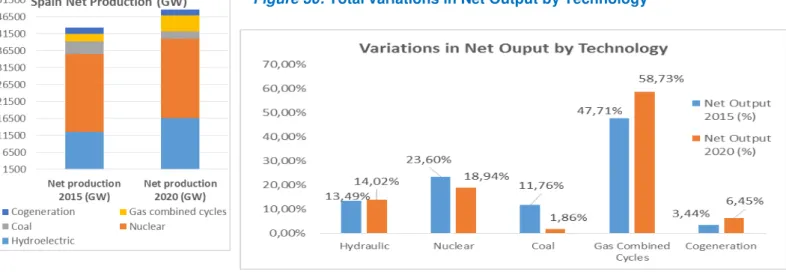
In Spain, electricity generation peaked at 311 TWh in 2008, after years of booming. From that year onwards, generation has been following a downward trend, with electricity generation reaching to 254 TWh in 2015. This value is expected to expand by 10% to 279 TWh by 2020, according to Iberdrola`s predictions (we have incorporated these estimates to predict the future net production in Spain). In this country the major sources of electricity production are the following ones: renewables (39%), nuclear power (22%) and coal (20%). While wind and solar power generation have boomed over the past decade (in the future should increase at a slower rate), coal and oil fired generation have halved and will decrease further. Annual demand growth has a relation with GDP growth, as a consequence of industrial consumption. Its growth was equal to 1.8% in 2015, at 248 TWh. In fact, demand peaked at 2008 at 261 TWh in 2008 and, after decades of mild growth and since 2011, it has decreased consecutively until 2014 at an average annual pace of 1.67%. This was due to tax increases during this period, increasing energy prices and reducing demand. We predict that until 2020 annual demand electricity growth should expand annually, on average, 0.87%. This estimate came after analysing data from 2011 we have concluded that annual electricity increases only 40% of the real GDP of that year, on average.
Another issue that is important to approach is the Spanish tariff deficit, as it was already referred. In 14th March of 2016, Moody`s declared that the electricity tariff debt was decreasing and heading towards sustainable levels and would enjoy future stability. As of the end of 2015, the system debt was cut by 7% to EUR 25.056 bn in comparison to a year earlier. This was possible due to cuts on regulated activities and on public subsidies to renewables energy from EUR 9.3 bn in 2013 to EUR 6.8 bn (-27%) in past years. It was the first year of surplus (EUR 550M) after 14 consecutive years of deficit. This has contributed to the system`s deleveraging, which constitutes good news for Iberdrola. In 2016,
Demand of the Spanish electricity market will
expand at an annual average pace of 0.87% and supply at a pace of 1.97%
Figure 9: Spanish
Production Mix Estimates
The severe cuts on renewables and regulated returns and increase of taxes on electricity generation were vital to
decrease and put the Spanish tariff deficit on a sustainable path, decreasing the burden on Iberdrola
Source: Iberdrola`s Website
Source: Iberdrola`s website, IMF and Analyst`s estimates
“IBERDROLA S.A.” COMPANY REPORT
PAGE 10/33
CNMC (National Markets and Competition Commission) estimates that EUR
2.871 bn of debt will be paid.
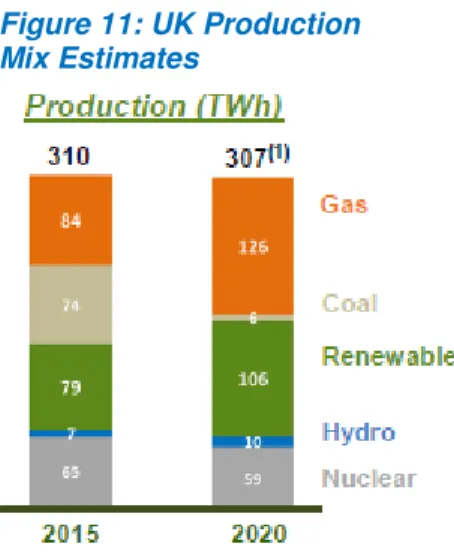
In the UK, total electricity generation in 2015 was 310 TWh and the major sources of electricity production were more or less evenly distributed with a higher share of gas (27%), followed by renewables (25%), coal (24%) and nuclear (21%). According to Iberdrola`s estimates, production should decrease just slightly to 307 TW (we have incorporated these estimates to predict the future net production in the UK). However, UK policies to close all coal-fired power stations by 2025 along with the 18₤ carbon tax floor has contributed to the closure of many coal plants (including Iberdrola´s 2.3 GW coal plant in early 2016) and to the increase capacity of renewables and gas. In fact, coal`s share decreased from 20.3% in 2015 Q2 to a record low of 5.8% in 2016 Q2, while gas increased from 29.9% to 45.2% in the same period. On the other side, final consumption of electricity during the Q2 2016 was equal to 303 TWh and was in line with 2014. These policies along with the intention of retiring the majority of the its ageing nuclear fleet and cut in renewables subsidies conflict with the likely higher energy demand in 2025. As a result, a significant electricity gap might appear in the future and the solution passes through the construction of CCGTs, nuclear and fossil fuels and through electricity imports in order to plug this gap. In Mexico, as of the end of 2015, total electricity generation was 65 GW, and it has remained rather flat over the last four years, with renewables capturing a share of 25% (including hydro and nuclear) and the rest being generated from fossil fuels (dominated by natural gas, which has surpassed oil as the main fuel for power generation). Also, almost all of the 14 GW of capacity additions since 2002 were in the form of CCGT and Iberdrola plans to increase its CCGT installed capacity in this area. The major fossil fuels` share along with ageing assets has resulted in high prices of electricity in recent years, which explains the bet on natural gas and renewable/non-fossil fuels for electricity production. The Energy Reform Act of 2014 is aimed at ending the state monopoly in the hydrocarbon and electricity sector (networks will still remain state-owned), encouraging new projects in new generation, increasing the efficiency and competition. Mexico’s electricity demand is forecasted to grow by 4% annually from 2015 until 2024.
Power Prices
For Iberdrola`s liberalized business in Spain and in the UK, it is very important to evaluate the future evolution of commodities prices (crude oil brent for gas in Iberia, NBP for gas in UK and coal API2) and CO2 allowances. This analysis serves the purpose of forecasting the marginal cost of each generating
Figure 11: UK Production Mix Estimates
UK regulation on the closure of coal plants, introduction of carbon tax floor and cut in renewables might create insufficient power supply to meet the rising demand
Figure 12: Mexican Gas Additions
“IBERDROLA S.A.” COMPANY REPORT
PAGE 11/33 technology, which is vital to understand the evolution of the power prices in these two regions. The Iberian electricity market is represented by the OMIP and in the UK it is represented by N2EX. As it is known, low emission technologies have low variable costs but high fixed and installations costs, while more polluting technologies have higher variable costs and are dependent on commodity prices and CO2 allowances. In the end of 2015, 47% of Iberdrola`s net production was exposed to these factors (cogeneration, CCGTs and conventional thermal), so this analysis is quite relevant. Our predictions of the future OMIP, N2EX, commodity prices and CO2 allowances should follow the latest market expectations, so we have recurred to the forward markets (Appendix 7).
From 2008 to 2014, there`s been a strong decline in market prices for electricity and the main causes are the following ones: decreasing of coal prices, oversupply of carbon allowances which ultimately results in its prices decrease (-73% variation from 2008 until 2014) and an overcapacity of power production plants (caused by stagnant electricity demand growth and growth of renewables). The daily electricity price in a market is determined by the last unit of a particular technology needed to satisfy demand13. For instance, lower prices for coal and
carbon allowances reduce the variable cost of coal plants but for this to have an impact on market prices depends on whether or not coal is the price-setting technology.
In the end of 2015, Spanish wholesale prices remained quite high in 2015 due to low hydro generation (dry season) coupled with low wind generation, which led to an increase in electricity generation costs (share of fossil fuels, more expensive, went up in the power mix). In the Q1 of 2016 there`s been a decrease in wholesale prices since rainier weather has enabled a ramp-up of hydro generation and renewables assured 54% of the whole generation (was only 28% in December of 2015). In normal conditions of demand (medium or high) gas is the marginal setting technology and will continue to be in future, as it was in the past.
In Q1 of 2016, UK wholesale price went down significantly in the last two years due to the renewables boom, lower gas prices (NBP) and lower demand. Clean Spark Spreads have gone up as spot gas prices fell faster than electricity prices, while Clean Dark spread are turning negative, which has been pushing coal-fired plants out of the money. Normally, coal is still cheaper than gas, even though gas prices have collapsed. However, from 2016 onwards the implemented carbon tax
13As a result, in the auction, each successful supply offer is rewarded with the same price, independent of its offering price, which illustrated by the
Merit Curve. Normally, this curve comes in an increasing source price order: renewables (wind and sun are for free), hydro, nuclear, coal, gas (running costs are typically lower than CCGT for low carbon permit prices) and finally peak plants (run by diesel) and are meant to cover rare peaks in demand.
Figure 15: Electrciy UK Pool
Prices: N2EX(₤/MWh)
Figure 14: OMIP: Spanish Pool Prices
Source: Bloomberg and Analyst`s estimates
Source: ZBW – Leibniz Information Centre for Economics
Figure 13: General Merit Curve
“IBERDROLA S.A.” COMPANY REPORT
PAGE 12/33 means of 18₤/ton is more than enough for gas to run ahead coal. This means that until 2015 gas used to be the marginal technology and from 2016 onwards it will be coal thanks to the mentioned tax, leading to the closure of many UK coal plants. Appendix 7 illustrates this, as we have calculated the marginal cost of gas and coal in the UK.
Renewables New Wave
It is widely known that in the last years there`s been a so-called “energy transition” that has been sweeping across Europe through the de-carbonization of the economy, which will ultimately change the generation based in a marginal pricing system. However, at an European level, unless a Capex step-up takes place, for sure that the EU decarbonisation binding targets will be missed. China and the US have already introduced decarbonisation plans just ahead of COP21 last year, for the first time, which intends to limit the temperature increase below 2 degrees (commitments from 195 countries). The main growth drivers of the future of new renewables capacity is the greenhouse gas (GHG) emission cut targets set at a European level14, ongoing decline costs in renewables CO2
pricing (emission reduction mechanism) and lower subsidies to fossil fuels. It is expected that by 2020 in Spain, 39% of electricity demand should be covered by renewables and the EU has defined a goal of 42.7% in 2030 and 50.1% in 205015.
Renewables additions in Europe continue at a pace of 10GW per year (1.5% of overall European installed base) and by 2025, it is estimated that wind and solar will account for 50% of the EU installed base. In fact, according to the EU renewables targets for installed capacity both wind onshore and offshore are the sources of renewables that are still very much apart from its 2020 EU targets (wind onshore 2014 was 220 TWh and offshore was 15 TWh and their target for 2020 is 352 TWh and 134 TWh, respectively), which entails that massive investment is bound to take place in this source in particular. Nevertheless, these environmental goals and major investment in renewables must be compatible with security of supply, so power grids16 will have to be upgraded and digitalized
to cope with the inherent output volatility of renewables (i.e: less wind for example in a certain year). It is estimated that there will be more storage of energy and increased conventional generation (back-up capacity).
14The emissions targets was the following ones: by 2020 20% cut from 1990 levels, by 2030 40% cut and renewables should represent 20% of all
energy by 2020 and 27% of all energy by 2030
15Notice that renewables targets are only binding at the EU level with no specific targets by country, meaning that the combination of all countries
must match the EU target
16According to the IEA: World Energy Outlook 2015, it is estimated that until 2040, Networks will see the length of installed power lines doubled and
70% will happen in Emerging economies and the rest in OECD countries, to satisfy the higher energy demand in less mature economies
In Europe, it is expected investment in renewables to increase in order for the EU decarbonisation targets not be missed, so a more favourable regulatory environment awaits
Installed capacity of Onshore and offshore wind are the ones that are more apart from the EU renewables targets, so Iberdrola should benefit from further regulatory ease for this technologies
Renewables have over time become increasingly more competitive at a cost level than other
conventional generation sources
“IBERDROLA S.A.” COMPANY REPORT
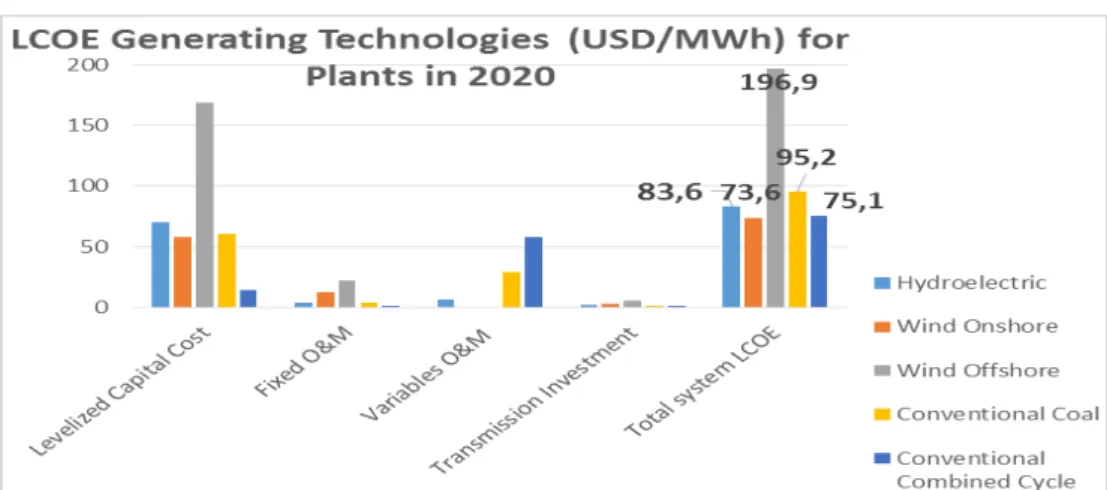
PAGE 13/33 Moreover, another important driver for the widespread expansion on renewables in Europe (mainly onshore wind and solar) is the LCOE17of each technology. As
far as the predictions for 2020 are concerned in the USA, wind offshore will remain the technology with the highest LCOE due to its very high capital costs, while wind onshore will have the lowest value (one of the reasons why there is less and less government subsidies to wind onshore). As it will be seen in the
“Renewables” chapter, Iberdrola is committed to invest substantially in offshore
wind, because despite the higher capital cost, it has a higher load factor and better revenue per MWh.
Iberian Peer Analysis
In the Appendix 6 we have made an extensive summary of the main metrics for the most important Iberian Utilities: Iberdrola, EDP, Gas Natural and Endesa, as of the end of 2015. This small set of Iberian companies has a lot in common with Iberdrola, as most of their earnings come from Iberia and they are also vertically integrated utilities that operate in the same core businesses, namely: Networks, Liberalised activities and Renewables.
From the analysis of this Appendix, on the one hand, we quickly see that the largest utility companies in the Iberian market in terms of their overall business (Revenues, EBITDA and Net Profit) are Iberdrola and Gas Natural. However, it is important to point out that the majority of Iberdrola`s EBITDA comes from outside Iberia, which shows that the company has a superior earnings diversification relative to its Iberian peers, which is deemed vital considering the weak Spanish sovereign outlook. On the other hand, EDP and Iberdrola share similar value in other metrics. They both are the most efficient ones (lowest OPEX/Gross Profit) and they have the highest percentage of renewable installed capacity. Besides,
17The Levelised cost of electricity is a good measure of the competiveness of different generating technologies and includes capital costs, fuel costs,
fixed and variable O&M and financing costs. It represents the cost of building and operating a generating plant over its financial time and duty cycle Source: US Energy Information Administration
“IBERDROLA S.A.” COMPANY REPORT
PAGE 14/33 we notice that they are the most leveraged companies (highest net debt/EBITDA) and they also share the highest percentage of regulated activities, which confirms the analysis performed in the “Leverage”Chapter.
We have also done an historical electricity load factor analysis from 2012 to 2015 in order to have an idea of the efficiency of the technological portfolio of each one the of Iberian companies18. The purpose of this analysis is the following one: if for
some reason electricity prices were to decrease a lot19, we would like to know
which companies would be affected the most. Since gas is and will continue to be the marginal technology in Spain, we should pay attention to the load factors of the CCGTs of these companies20. From this analysis we conclude that Gas
Natural and EDP`s CCGTs entered first in the merit curve than Iberdola`s CCGTs, which is negative for the latter. However, EDP and Gas Natural`s CCGTs installed capacity as a percentage of the total capacity is higher than Iberdrola as of the end of 201521, which would put them more at risk if a
significant drop in electricity prices were to take place. Finally, the reasons why Iberdrola in 2015 had the lowest load factor among the competitors were the following ones: Iberdrola has the highest percentage of hydroelectric capacity (38.46%) which had a load factor of just 15% and their CCGTs also had a really low load factor of 4.60% and its installed capacity represents 22.55% of all its capacity.
Segmental Forecast
Outlook for the Overall Business
According to the provided business overview outlook by Iberdrola, it is expected that from 2016 to 2020, there will be a strong investment and growth on regulated business and clean energies. More concretely, we have estimated that 78% of the investment until 2020 will take place in regulated or long-term contracted activities22 and 70% in dollars and sterling, with only 16.37% coming from Spain,
which revels the lack of growth opportunities in the domestic market. This is particularly reassuring, as most of the growth will come from countries with a high credit rating. Total capex estimated was 21.172bn€, which is just will come just a
little bit below of Iberdrola’s guidance (23.7bn€). Companies usually tend to
18This load factor was calculated including renewables for all companies in each one of the four years that were analyzed. Note that this analysis was
not conducted for the electricity market in the UK, since, according to my predictions, the EBIT in 2016 in this region will be four times smaller than in the Iberian region.
19Note that according to our previsions (from the forward market) OMIP Pool Price, as shown before, are expected to decrease relative to 2015. This
year was very dry year (Iberdrola´s hydroelectric production decreased 30,7%), which led to exceptionally high prices, as gas (more expensive) entered more in the curve
20It is vital to check which CCGTs in Spain are the most efficient and enter first in the merit curve. In 2015, the load factor of the CCGT of Iberdrola,
EDP, Gas Natural in Iberia were the following ones: 4.60%, 11.20%, 23.63%
21These percentages for Gas Natural, EDP and Iberdrola are the following ones, respectively: 54.83%, 32.99% and 21.81%
22More concretely, investment until 2020 in Networks in the Liberalized sector and in Renewables follow these percentages, respectively: 47.23%,
22.07% and 30.70% Figure 17: CAPEX Plan for 2016-2020 by Region
Source: Company Report and Analyst`s estimates
16,37%
38,44% 31,19%
3,01%
10,99%
Spain UK USA
“IBERDROLA S.A.” COMPANY REPORT
PAGE 15/33 overstate their ambitions expansion plans, so we are being more cautions (our CAPEX is just 11% lower than the one provided by Iberdrola). Note that the 2012-2014 Capex plan, Iberdrola`s total investment was only 8.3bn€, which contrasts with the 10.5bn€ announced in 2012 for that time period.
If we consider the hydroelectric complex that will be operational in 2020 in Portugal, the many CCGTs and Cogeneration plants that will open in Mexico as well the investment in renewables (according to Iberdrola guidance), an additional 8632MW will be added until 2020. This increase in renewables and the closure of the already mentioned coal plant, will contribute for Iberdrola green policy, as CO2 is expected to decrease. In a nutshell, in Networks we expect an increased contribution from the USA, mild growth in the other geographies and overall growth to be around low single digit until 2020. In renewables, it is predicted a strong growth in offshore and in onshore (USA and UK) and overall growth should come of high single digit until 2020. Finally, in generation and supply, most growth is supposed to come from Mexico (Spain and UK to remain stable) and a medium-low digit growth is expected to be registered in this business until 2020. According to our estimates for the CAGR 15-20 for the total Iberdrola´s EBITDA came at 3.59%: For Networks we have estimated a CAGR 15-20 in the EBITDA of 1.60%, for the Liberalised sector of 1.94% and for the Renewable sector of 7.38%.
Network Business
First of all, the network is the vital element of the electrical system, which allows the integration of renewables and distributed generation. This is a highly regulated business, due to the fact that the companies in a given location have no competitors thanks to the high fixed costs and initial capital required - natural monopoly. That is why the regulators in each region set an allowed return over the invested capital of a company in this business – RAV23. This return is set
according to the particular risk and capital structure of the network business in a certain location. In the specific case of Iberdrola, grid regulation enjoys high visibility in Spain (review in 2020), UK (review in 2022 and 2024), US (review in 2017 and 2018) and in Brazil (review 2020). In September of 2016 this was the most influential line of business, as it represented 51% of Iberdrola`s EBITDA. As of the end of 2015 it distributed 243.0 TWh of energy with Spain representing 38% and the US 40% of all the energy distributed. For all the regions in which Iberdrola operates, for simplicity reasons, I have computed the allowed revenues
23 Regulatory Asset Value: RAV
“IBERDROLA S.A.” COMPANY REPORT
PAGE 16/33 (remuneration for investment24+ depreciation + net operating expenses) and then
other revenues25 in order to get to the whole revenues caption. Due to the
weak/instable macroeconomic outlook in Spain as well as the fact that it has the lowest return on RAV, only 15% of the predicted total investment in this segment will be directed in the national territory (according to Iberdrola guidance). On the other hand, 32% of the investment is expected to take place in the UK and 48% in the US26, once the regulatory outlook in these countries appears to remain
stable in the future and they both have the highest allowed return rates. As it will be explained in the “Discount Rates” we estimated a common WACC for all the network business of 4.06%. Since all of the allowed returns over the RAV are higher than this WACC, Iberdrola is creating value for of its shareholders, especially in the US and in the UK, where this difference is larger, and that is why it is investing more in these regions. Finally, I have estimated that total investment between 2016 and 2020 will be of 10bn€, which is just below Iberdrola`s guidance of 11bn€. Additionally, I have predicted that total RAV will increase from 24,665bn € to 27,090bn€, which constitutes a growth of 9.36%.
In Spain, energy distribution increased 2.2% increase compared to the previous year to 94,113 GWh along with 10.8 supply points. In this business. The RDL 9/2013 fixes the methodology that will govern the remuneration distribution activities until 2019 (6 year regulatory period). The remuneration on investment will be based on the RAV (was estimated to be around 8,689bn €27 in the end of 2015) multiplied 10y Spanish bonds plus a 200bp spread (6.5% nominal before-tax) plus estimated operating costs plus depreciation. In Spain, according to our estimates, 300M € will be invested annually from 2016-2020, which is slightly less than the 2012-2015 average of 321M€. As depreciations will exceed annual investments Spanish RAV is estimated to decrease -6.6% until 2020 relative to
24 Remuneration on Investment
t = RAV t × Allowed Return t
25This caption refers to the difference between historical revenues and allowed revenues, which includes other services provided by the networks 26 The remaining 5% of all the investment will be in Brazil, though this region is not that important as the RAV is the lowest of all
27Spanish RAV was estimated in the following manner: dividing the financial retribution of 2016 (565M €) by the remuneration rate (6.5%). These
values were set by the regulator in 2016 for the year of 2015. The other countries` RAV were taken from the most recent Iberdrola Capital Markets Day
Country
Electrcity Distributed (GWh)
2015
RAV 2015 (M €)
RAV 2020 (M €)
Return on
RAV after tax
Spain
94,113
8689
8113
4,68%
UK
34,009
7434
7871
6,39%
USA
31,337
7838
10337
7,1%
Brazil
16,190
810
769
5,34%
Figure 19: Networks Spain RAV and EBITDA evolution
Source: Company Report and Analyst`s estimates Figure 18: Main Networks metrics evolution
“IBERDROLA S.A.” COMPANY REPORT
PAGE 17/33 2015 EBITDA (M EUR) should decrease just -3.84%. Since, as of the end of 2015, total regulated retribution was 1,65bn€, the remaining 0.3 bn€ of the revenues should increase a rate of 5% per year, as they derived from the installation of the smart meters. Therefore, all things considered, the regulatory framework for distribution in Spain will remain rather stable in the next 3 years, and Iberdrola will not prioritize in terms of investments this area due to the weak macroeconomic outlook and low return on RAV after taxes
In the UK, Iberdrola has 3.5M supply points and electricity distributed during 2015 came at 34,009 GWh, falling just 0.6% comparing to the previous year. In this geography, Iberdrola is present with two distribution companies: Scottish Power Distribution (SPD) and Scottish Power Manweb (SPM) and one Transmission company: SP Transmission (SPT). All are under the regulatory authority is the GEMA (Gas Electricity Markets Authority), which is supported by the OFGEM. Prices have been controlled, which is achieved through the new RIIO framework (Revenue = Incentives +Innovation + Outputs) for an eight year period (before it used to be five years, and this gives more stability to investors). This framework encourages networks to deliver an increasing low carbon energy sector, while protecting its consumers. As far as Iberdrola is concerned, the long-term conditions agreed in the UK are the following ones: RIIO-ED1 (distribution) and RIIO-T1 (transmission). RIIO-ED1 runs from 2015-2023 at a 7.5% allowed return (before tax) with a maximum allowed TOTEX of 3.2 bn £ and RIIO-T1 runs from 2013-2021 at a 8.75% (before tax) allowed return with a maximum allowed TOTEX of 2.5 bn£. In this region EBITDA in pounds is expected to see a significant increase as a result of the increase of the RAV, increasing, in turn the remuneration on investment. This has to do with the fact that the average annual investments until 2020 (551.1M₤) will just a bit higher than the historical average
of 2012-2015 of 530M₤. The percentual increase of both the RAV and EBITDA
(M£) is actually close to 30%. However, when converted to euros the EBITDA increase is actually very low (6%). This comes as a result of the forward, which is expecting a great pound devaluation from 2017 onwards as a result of the Brexit.
In the US, Iberdrola operates in Maine, in the distribution and transmission business in the Central Maine Power (CMP), in New York through the New York State Electric & Gas Corporation (NYSEG) and Rochester Gas and Electric Corporation (RG&E). As of the end of 2015, overall electric power distributed was 31,337 GWh, with 2.2M users of electricity and 0.8M of gas. Revenues are essentially regulated and are based on tariffs set in accordance with the various regulatory bodies and are based on the cost of providing service. More specifically, they must be enough to cover its operating costs (energy costs,
Figure 20: Networks UK RAV and EBITDA evolution
Source: Company Report and Analyst`s estimates
Figure 22: Networks Brazil RAV and EBITDA
evolution
Figure 21: Networks USA RAV and EBITDA evolution
Source: Company Report and Analyst`s estimates
$8.000 $9.000 $10.000 $11.000 $12.000
2015 2016 2017 2018 2019 2020 $700 $800 $900 $1.000 $1.100 $1.200 $1.300
R
A
V
E
BI
T
DA
Networks USA (M $)
“IBERDROLA S.A.” COMPANY REPORT
PAGE 18/33 finance costs and the costs of equity) and also they must reflect the Company's capital ratio and the reasonable return on equity28. Tariffs reviews cover various
years (three in New York). In general, there is regulatory visibility in New York until 2019 and in Main and Connecticut there will be reviews in 2017. This is the area where most of the growth of this business is expected, with EBITDA (M USD) growing 44.82% and the RAV (M USD) 34%, as a result of the average annual investment between 2016-2020 of 1,061M USD, which is much higher than the 2012-205 average of 646M USD.
Finally in Brazil, electricity distribution activity is carried through multiple Iberdrola joint ventures and through Elektro Electricidade e Serviços, S.A. (ELEKTRO). Electrcity power distributed came at 16,190 GWh for Elektro with 2.5M users of electricity, as of the end of 2015. In May 2015, the Fourth Tariff Review Cycle was approved and applied to ELEKTRO in its tariff review in August 2015, in which the approved regulatory allowed return was 8.09% after tax (higher than the previous 7.5%) and all investments made were recognized in the RAV. Among the ANEEl Ranking (includes 64 distributors) ELEKTRO has moved from the 13th position (2011 in the 3rd Tariff Cycle) to the second position in 2015 in the 4th Tariff Cycle. It is thus, one of the most efficient distributors in Brazil. We estimated that the RAV (M REAL) will increase 2.4%, despite and EBITDA (M Real), as a consequence of the increase in the annual investments. In fact, the annual average 2016-2020 investment is estimated to be around 391M Real, which is a lot higher than the annual 2013-201529 average (245 M Real). Finally,
EBITDA (M Real) was estimated to decrease 6.3%. This might have to do with the fact that, according to our estimates, the other revenues was kept constant and carried a value five times as high as the regulated revenue, due to lack of information.
Renewables
Iberdrola has been consolidating its leading position in renewables with 14,184 MW of installed capacity dispersed in many countries, with a special emphasis in Spain (5861 MW) and in the US (5540 MW). As of the end of 2015, Iberdrola`s renewables was comprised of 97.1% of wind and the remaining (409 MW) was composed of hydraulic, solar thermal hybrid and photovoltaic. Overall production at the end of 2015 was 31,228 GWh and it has decreased 2.6% from a year earlier. In 2015, Iberdrola proceeded to the installation of 139 MW in new renewables (all of it was in onshore wind). The company`s expansion strategy
28 US Remuneration on Investment: Allowed Return * Capital Ratio * RAV
29The investment of 2012 was excluded from this average, as a one-off investment of 1238M Real was registered, which is 6 times as high as the
annual investments between 2013-2015 Source: Company Report and
Analyst`s estimates
Source: Company Report and
Figure 23: Renewables Installed Capacity Evolution (2015-2020)
Source: Company Report and Analyst`s estimates
“IBERDROLA S.A.” COMPANY REPORT
PAGE 19/33 passes through: less future share on Spanish renewables, betting massively on offshore wind, new onshore wind parks in the US and in the UK, which offer an attractive and granted remuneration per MW. Despite the fact that offshore wind is more expensive as the onshore (2.75M€ / MW vs 1.23M€ / MW), it has a much higher and stable Revenue/MW (182€/MW30 vs 80€/MW). Two general business
drivers that are important to highlight are the following ones: 1) electrification of the economy as planned in COP21 to integrate renewables into the power mix and to compete fairly with other sources and 2) the solid business in strategic markets via the high regulatory through long term prices stability as the remuneration is guaranteed for the future through via feed-in tariffs.
As it was explained before, renewable energy sources are the first ones to come in the merit curve (marginal cost is close to zero), therefore they are never the marginal setting technology which depends on demand. This is because renewables operate under special regime, while conventional technologies are under ordinary regime. However, renewables production is dependent on external factors (wind, sun), once the load factors will vary accordingly. Firstly, Iberdrola renewables portfolio is geographically widely dispersed, which ensures a stable overall load factor31. Second, 32% of the total 3982 MW new capacity
will come from offshore wind in the UK and in the RoW with a future 24.78% load factor and higher Revenue per MWh (agreed remuneration per MW for more than a decade for all the offshore wind projects). Notice that in the end of 2015 Iberdrola only had 194MW and in the end of 2020 we predict that, based on its CAPEX plan, there will be 1258MW. However, they require substantial initial investments, which are twice as expensive as the onshore wind and that is why 45% of total expected Capex will be directed to offshore wind. The expected annual Capex should come at around €1.3bn and total output should be around 41630.5 GWh (increase of 32% relative to 2015), according to the planned future installations and estimated load factors (equal to the average of 5 years before for each location). While in Spain and in the RoW evolution in production until 2020 should remain rather stable (Spain should increase 8% and RoW decrease -5.30%), we expected great growth thanks to new offshore and onshore wind installations in the regions.
In Spain, in June of 2014, RD 413/2014 (6 year horizon) is the current remuneration system that regulates the energy production activity generated from renewables. It takes into account the remuneration for investment at a pre-defined fair rate of 7.5%, which is based on the 10 year Government bond plus a
30This value was obtained through the average of the future Revenue (€) per MW, after having converted from pounds to euros as we are considering
that almost all offshore projects will take place in the UK
31The 2012-2015 total Load factor weighted average was equal to 27.15% and the highest value was 27.94% and the lowest was 26.18%
Figure 24: Load factor future estimates
Source: Company Report and Analyst`s estimates
Figure 25: Installed
Capacity and Total Output Predictions until 2020
10000 11000 12000 13000 14000 15000 16000 17000 18000 19000 0 5000 10000 15000 20000 25000 30000 35000 40000 45000 2 0 1 2 2 0 1 3 2 0 1 4 2 0 1 5 2 0 1 6 2 01 7 2 0 1 8 2 0 1 9 2 0 2 0 In sta ll e d Ca p a c ity (M W ) N e t Pr o d d u c ti o n ( G W
) Total Installed Capacity
(MW) Total Output (GWh)
“IBERDROLA S.A.” COMPANY REPORT
PAGE 20/33 300bp spread and the remuneration for operation. This is intended to level the playing field for fair competition with conventional technologies, as these facilities have higher initial costs. In fact, in the past, as a way to decrease the tariff deficit, in 2013, the government announced measures to cut the renewables remuneration (before, the feed in tariff led to higher returns than the current return under framework). Similarly to the Networks, Revenues in Spain are the to the sum of the depreciations plus operating costs plus the regulated operating profit (total fixed assets32 × 7.5%). This past instability and lower returns has to
do with the fact that, for the foreseeable future, Iberdrola does not intend to install additional capacity in Spain, and is rather focused on operating efficiency. In the US, Iberdrola is the second largest operator of wind energy in the country and there is a great potential for growth which is supported by a solid regulatory support. In fact, half of the 1400 MW development plan that Iberdrola has in the US has long-term PPA, which is very much reassuring the stability of the business. Both the RPSs (Renewable Portfolio Standards) that require utilities to generate a minimum amount electricity from renewables (15-33% of all electricity generation until 2025), tax incentives, through PTC (Production Tax credits; valued at 23USD/MW and have been extended until 2020) and five-year accelerate depreciation have foster investment in renewables. Their purpose is to make electricity production from renewable resources more competitive relative to fossil fuel and nuclear power facilities and has led to the installation of many renewables facilities in recent years. This stability and regulations should not be affected by Trump`s presidential mandate. Due to this stability we have assumed that Revenue per MW will be kept constant in the future (80 USD/MW)
The UK intends to source 30% of electricity from renewable sources by 2020 and to deliver this commitment the RO (Renewable Obligation) has been implemented. The RO will be closed in 2017 and it will be replaced by a new system based on Contracts for differences (CFDs) to support low carbon generation, which constitute solid opportunities for growth with long term guaranteed revenues. We have also assumed that Revenue/MW will continue to be 157₤/MW in the future as it was in 2015.
Generation and Supply
This business line is composed of two different activities which are bundled since 2011: production of electricity through hydro, nuclear, coal, combined cycle and cogeneration and, at a second stage, it supplies electricity and gas to end-consumers. By the end of 2015, total installed capacity was 30,388 MW
32Total Fixed Assets were almost 5bn € in the end of 2015 and they will marginally increase in the future (+1.28%), according to Iberdrola`s
investments in renewables in Spain
Figure 27: Liberalized
Installed Capacity 2015 (excluding renewables)
Source: Company Report and Analyst`s estimates
1.400 €
1.600 €
1.800 €
2.000 €
2.200 €
2.400 €
2015 2016 2017 2018 2019 2020
Figure 26: Renewables
EBITDA historical and future estimates
“IBERDROLA S.A.” COMPANY REPORT
PAGE 21/33 excluding renewables with 19,745 MW in Spain, 4835 MW in the UK and 6282 MW in Mexico. Total capacity has a special and increasing focus on combined cycle and hydro. On the other hand, electricity production, in the same period, was equal to 97,789 GW and most of it came from combined cycle, nuclear and hydro. As it was explained before, the higher the load factor of a certain technology the higher will be its annual total production.
Firstly, in the more mature markets (Spain and UK) we expect moderate demand growth and there is a clear trend towards more cleaner, efficient and more flexible generation through the investment in Hydro. We have also estimated that the gradual reduction of coal will entail the increase production of gas and in renewables. The sale of electricity and gas has become increasingly competitive with margins pushed to the limit, as a result of increasing regulation and taxation. Secondly, in Mexico, Iberdrola will take advantage of the growth opportunities with the recent market opening and of the long term capacity auctions, and will almost duplicate its installed capacity through the investment in thermal plants (CCGTS and Cogeneration) with PPAs. The investment in the UK will be done through Smart Meters (obligation to deploy them to all customers by 2020) and in Portugal it will be done through the construction of the Tâmega hydroelectric complex (1200 MW), which will be operational by 2020. In the Retail business, in Spain and in the UK, there is an increasing high competition, but bear in mind that Iberdrola in Spain is the leader in costs by a 10€ per contract vs competitors.
I n
S p a i n ,
In Spain installed capacity was, at the end of 2015, 19,745MW, in which hydro and combined cycle assumed a greater role (49% and 29%, respectively). After renewables, hydro is the cheapest source of electricity production but its load factor varies significantly (rainfall variations) and has a low load factor (around 20%), whereas nuclear have a load factor around 84%. Gas will still be the marginal technology as we estimated that its marginal cost to be above coal from Source: Analyst`s estimates
Figure 28: Liberalized
Predicted Installed Capacity 2020
Source: Analyst`s Estimates
Figure 29: Spain Net
Production (GW) Estimates
Source: Company Report and Analyst`s Estimates