Are there differences in the quality of the
diet of working and stay-at-home women?
Daniela de AssumpçãoI, Caroline SenicatoI, Regina Mara FisbergII, Ana Maria CanesquiI, Marilisa
Berti de Azevedo BarrosI
I Universidade Estadual de Campinas. Faculdade de Ciências Médicas. Departamento de Saúde Coletiva.
Campinas, SP, Brasil
II Universidade de São Paulo. Faculdade de Saúde Pública. Departamento de Nutrição. São Paulo, SP, Brasil
ABSTRACT
OBJECTIVE: To verify whether there is an association between the quality of the diet and the inclusion of women in the labor market and whether the education level would modify this association. We have analyzed the differences according to education level and evaluated whether the insertion or not in the market modifies the association between the quality of the diet and education level.
METHODS: This is a cross-sectional population-based study that has used data from the Campinas Health Survey (2008 ISACamp). We have evaluated the diet of 464 women, aged 18 to 64 years, using the Brazilian Healthy Eating Index – Revised. We have estimated the means of the total score and index components using simple and multiple linear regression.
RESULTS: We have observed no difference in the quality of diet of working and stay-at-home women. The analysis stratified by education level showed a lower intake of fruits among stay-at-home women in the segment of lower education level, in relation to working women. Among all women, a lower education level was associated with lower overall quality of the diet, higher intake of sodium, and lower intake of fruits, vegetables, whole grains, milk, and saturated fat. On the other hand, the inclusion in the labor market changed the effect of the education level on the quality of the diet. In the stay-at-home stratum, a low education level was associated with poorer quality of the diet and lower consumption of fruits, dark green and orange vegetables, and whole grains. Among the working women, a low education level was associated with higher intake of sodium and lower intake of vegetables, whole grains, and milk and dairy products. CONCLUSIONS: The results show inequities in the profile of food in relation to education level and inclusion in the labor market, which shows the relevance of public policies that increase the access to education and provide guidance on a healthy diet.
DESCRIPTORS: Women. Women, Working. Healthy Diet. Socioeconomic Factors. Health Inequalities. Diet Surveys.
Correspondence: Daniela de Assumpção
Rua Tessália Vieira de Camargo, 126 Cidade Universitária
13083-887 Campinas, SP, Brasil E-mail: [email protected]
Received: Mar 2, 2017 Approved: Sep 19, 2017
How to cite: Assumpção D, Senicato C, Fisberg RM, Canesqui AM, Barros MBA. Are there differences in the quality of the diet of working and stay-at-home women? Rev Saude Publica. 2018;52:47.
Copyright: This is an open-access article distributed under the terms of the Creative Commons Attribution License, which permits unrestricted use, distribution, and reproduction in any medium, provided that the original author and source are credited.
INTRODUCTION
In the last decades of the twentieth century, economic, demographic, social, and political
changes have increased the access of women to education and the labor market1. According
to the 2010 Population Census, 55% of the economically active population in Brazil consisted
of women, of whom 19.2% had complete higher education2.
On average, the main job demands approximately 36 hours per week for women and 42 hours for men; however, women spend 21 hours on household chores, which is more than twice the time spent by men3. Given the need to reconcile professional functions with those related
to the care of the family and the home, women who work outside the house dedicate less
time to prepare food4–7.
A cross-sectional study conducted in Minnesota, USA, with 3,709 parents or guardians of adolescents, has shown that women working full-time spent 8.8 hours per week cooking, a significantly shorter time in relation those who worked part-time (10.1 h) or who were unemployed (11.5 h)6.
The Brazilian traditional diet pattern has undergoing profound changes, in which fresh or minimally processed food, such as rice, beans, and cassava and the meals prepared from
them, is being replaced by ready-to-consume food products8.
The finding on these inadequate food changes leads us to question whether the participation of women in the labor market would have contributed to these transformations. This discussion should consider a broad set of factors that contributed to changes in the food pattern. Among them, we can highlight the conformation of a food system based on monocultures that are transformed into food products by the industry and the action of transnational food companies in the national market, disseminating products of poor nutritional quality in all social strata and investing in marketing strategies that create “needs” in response to a daily life that requires time saving, practicality, satiety, and pleasure9,10. Another relevant
issue is the lack of distribution of domestic activities related to food. Every family member should develop and share culinary skills so that this task is not attributed solely to females8.
The quality of the diet can be assessed and monitored using indexes, which bring together in a single measure a set of components based on food, nutrients, and culinary ingredients with proved health implications, such as whole grains, vegetables, saturated fat, and sodium11. The
Brazilian Healthy Eating Index – Revised (BHEI-R) is an instrument adapted and validated for the Brazilian population, which allows the diagnosis of the level of quality of the diet of individuals or groups, based on nutritional recommendations12,13.
Considering the significant female participation in the workforce, the influence of women on family nutrition, the unfavorable changes in food culture, and the importance of adequate diet for the prevention of health problems, the objectives of this study were: to verify whether there is a distinction in the quality of the diet of working and stay-at-home women and whether the education level modifies these differences, to verify whether there are differences according to education level, and to evaluate whether or not being included in the labor market modifies the association between quality of the diet and education level.
METHODS
This is a cross-sectional population-based study that used data from the Campinas Health
Survey (2008 ISACamp), carried out from February 2008 to March 2009.
confidence interval, and a design effect of two, resulting in 1,000 individuals for each age group. Predicting an 80% response rate, we corrected the sample size to 1,250 individuals.
The 2008 ISACamp sample was obtained by probabilistic sampling, by clusters, and in two
stages: census tract and household. In the first stage, after ordering the census tracts by the percentage of heads of families with university education, 50 tracts were systematically draw for the urban area of the city of Campinas, state of São Paulo, Brazil, with probability proportional to the number of households. In the second stage, a systematic sampling of
households was carried out.
Independent household samples were selected for each age group, corresponding to 2,150 interviews for adolescents, 700 for adults, and 3,900 for older adults. All the residents of the household that belonged to the domain drawn were interviewed. Further information on the sampling plan is available in Alves14.
In this study, we analyzed only data from female adults in the age group of 18 to 64 years. This group is used by international and national studies to classify women of productive age15,16.
Data on the demographic, socioeconomic, and health conditions, health-related behaviors, and food habits were obtained from a structured previously tested questionnaire, which was applied by trained and supervised interviewers. Food consumption was estimated by a 24-hour recall (24HR), a method that consists of the collection and quantification of all
types of food and beverages consumed the day before the interview17.
The variables analyzed here were:
• Brazilian Healthy Eating Index – Revised (BHEI-R)12. The instrument has twelve components
classified into adequacy (total fruits, whole fruits, total vegetables and legumes, dark green and orange vegetables and legumes, total grains, whole grains, milk and dairy products, meats, eggs and legumes, oils) and moderation (sodium, saturated fat, SoFAAS – which evaluates the energy percentage from solid fats, alcohol, and added sugar) (Box). Each component receives a specific score, ranging from zero to five, or from zero to ten, or from zero to twenty. The minimum score is attributed to the non-consumption of the adequacy components (1 to 9) or consumption above the recommended limit of the moderation components (10 to 12). The maximum score is given by reaching or exceeding the recommended value of intake for each component. Intermediate values of intake are given proportional scores. The sum of the scores of the components results in the total BHEI-R, which can reach up to 100 points (Box).
Data from a 24-hour recall were used to calculate the BHEI-R. After confirming the quality of the filling, the recalls were quantified by a nutritionist to convert the information from home measures into grams or milliliters. The quantification was done using tables of home
measurements18,19, food labels, and consumer services.
The software Nutrition Data System for Research, 2007 version (University of Minnesota), was used to calculate the nutrients of the food ingested. The recalls with an energy value of less than 800 kcal or more than 3,500 kcal went through a consistency analysis, with a
review of all content.
According to the method proposed by the 2005 Healthy Eating Index, the BHEI-R transfers
the energy from the legumes to the component of meat and eggs, if the consumption of these
types of food falls below the recommended value. If the component of meat and eggs reaches
the maximum score and there is energy left for legumes, this surplus goes to two other components: total vegetables and dark green and orange vegetables, respectively. In this study,
• Inclusion in the labor market: categorized into working and stay-at-home women. In the
group of working women, we included women who performed some paid activity at the time of the research, those who were temporarily away from work because of illness, and those who were retired and continued to have a paid work. We considered as stay-at-home women those who had no paid work and who reported to be stay-at-home women. In this study, we excluded women who were unemployed (n = 38), retired (n = 101), and students (n = 34) because they were not included in the labor market or because they received retirement or unemployment benefits.
• Education level: evaluated in years of study and categorized into zero to eight years and
nine years or more.
• Demographic and socioeconomic variables: age group (years), education level, monthly
family income per capita (minimum wage), self-reported race, marital status, number of
children, number of persons in the household, and presence of housekeeper.
In this study, the dependent variables were the scores of the total DQI-R and of each component, and the independent variables were the inclusion in the labor market and the education level of the women. We used the demographic and socioeconomic variables to describe the social characteristics of the working and stay-at-home women.
The associations between the demographic and socioeconomic variables and occupation were determined by the Rao-Scott chi-square test, with a 5% significance level. The means of total BHEI-R and of each component were estimated by simple and multiple linear regression, considering a 5% significance level. The multiple model was adjusted for age, income, marital status, and number of children. The energy (kcal) did not enter the model as an adjustment variable because the BHEI-R was produced at a density of 1,000 kcal.
We analyzed the data in the svy module of the Stata 11.0 program, considering the study
sampling design. This research was approved by the Research Ethics Committee of the
Universidade Estadual de Campinasand the National Commission for Research Ethics
(CEP/CONEP system), under CAAE 37303414.4.0000.5404.
Box. Criteria of the score of the components of the BHEI-R.
Components of the BHEI-R Score range (minimum to maximum)
Criteria of the minimum score
Criteria of the maximum score Adequacy (higher score means higher consumption)
1. Total fruitsa 0 to 5 No consumption 1.0 portion/1,000 kcal
2. Whole fruits 0 to 5 No consumption 0.5 portion/1,000 kcal 3. Total vegetables 0 to 5 No consumption 1.0 portion/1,000 kcal 4. Dark green and orange vegetables 0 to 5 No consumption 0.5 portion/1,000 kcal 5. Total grains 0 to 5 No consumption 2.0 portions/1,000 kcal 6. Whole grains 0 to 5 No consumption 1.0 portion/1,000 kcal 7. Milk and dairy products 0 to 10 No consumption 1.5 portion/1,000 kcal 8. Meat and eggsb 0 to 10 No consumption 1.0 portion/1,000 kcal
9. Oilsc 0 to 10 No consumption 0.5 portion/1,000 kcal
Moderation (higher score means lower consumption)
10. Saturated fat 0 to 10 ≥ 15% of TEV ≤ 7% of TEV
11. Sodium 0 to 10 ≥ 2.0 g/1,000 kcal ≤ 0.75 g/1,000 kcal
12. SoFAAS 0 to 20 ≥ 35% of TEV ≤ 10% of the TEV
Total BHEI-R 0 to 100
Source: Previdelli et al.12 (2011)
BHEI-R: Brazilian Healthy Eating Index – Revised; TEV: total energy value; SoFAAS: calories from solid fat, alcohol, and added sugar
RESULTS
We excluded 235 women from the analysis: 160 hypertensive, 52 diabetic, and 23 pregnant women. Thus, the study population consisted of 464 women aged 18 to 64 years. Mean age was 36.3 years (95%CI 35.1–37.5) for all women evaluated, 35.3 years (95%CI 33.9–36.6) for working women, and 40.3 years (95%CI 37.7–42.8) for stay-at-home women.
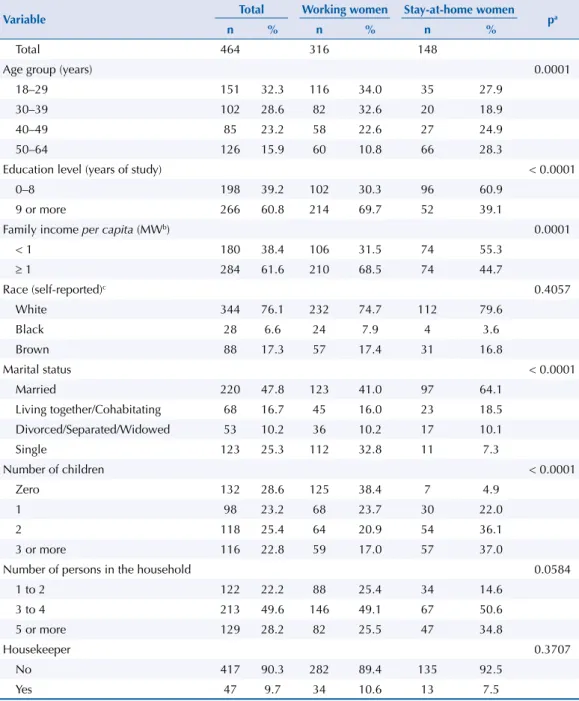
Table 1 shows that most full-time stay-at-home women are older, married, with lower
education level and family income per capita, and with three or more children.
We found no differences in the scores of the components and overall quality of the diet among working and stay-at-home women (Table 2).
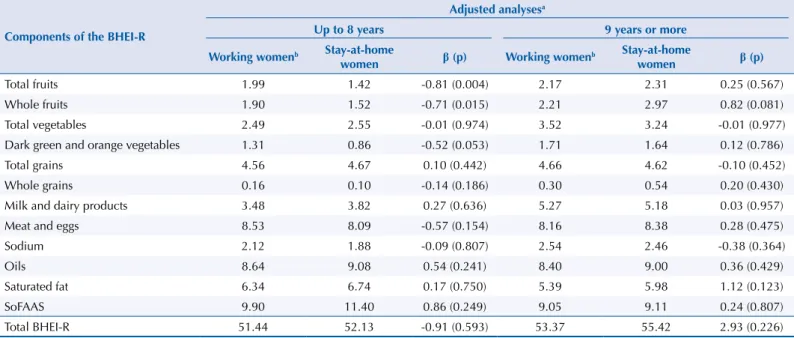
When analyzing the inclusion in the labor market stratified by education level, the only difference we found was that the scores for total fruits and whole fruits were lower in
Table 1. Demographic and socioeconomic characteristics according to inclusion in the labor market
of women aged 18 to 64 years. Campinas Health Survey (2008 ISACamp).
Variable Total Working women Stay-at-home women pa
n % n % n %
Total 464 316 148
Age group (years) 0.0001
18–29 151 32.3 116 34.0 35 27.9
30–39 102 28.6 82 32.6 20 18.9
40–49 85 23.2 58 22.6 27 24.9
50–64 126 15.9 60 10.8 66 28.3
Education level (years of study) < 0.0001
0–8 198 39.2 102 30.3 96 60.9
9 or more 266 60.8 214 69.7 52 39.1
Family income per capita (MWb) 0.0001
< 1 180 38.4 106 31.5 74 55.3
≥ 1 284 61.6 210 68.5 74 44.7
Race (self-reported)c 0.4057
White 344 76.1 232 74.7 112 79.6
Black 28 6.6 24 7.9 4 3.6
Brown 88 17.3 57 17.4 31 16.8
Marital status < 0.0001
Married 220 47.8 123 41.0 97 64.1
Living together/Cohabitating 68 16.7 45 16.0 23 18.5 Divorced/Separated/Widowed 53 10.2 36 10.2 17 10.1
Single 123 25.3 112 32.8 11 7.3
Number of children < 0.0001
Zero 132 28.6 125 38.4 7 4.9
1 98 23.2 68 23.7 30 22.0
2 118 25.4 64 20.9 54 36.1
3 or more 116 22.8 59 17.0 57 37.0
Number of persons in the household 0.0584
1 to 2 122 22.2 88 25.4 34 14.6
3 to 4 213 49.6 146 49.1 67 50.6
5 or more 129 28.2 82 25.5 47 34.8
Housekeeper 0.3707
No 417 90.3 282 89.4 135 92.5
Yes 47 9.7 34 10.6 13 7.5
a Rao-Scott chi-square test.
b Minimum wage (MW) valid at the time of the research: January to April/2008: R$415.00; May/2008 to
April/2009: R$450.00.
stay-at-home women among the women with up to eight years of education, which meant lower consumption of fruits and natural juices (Table 3).
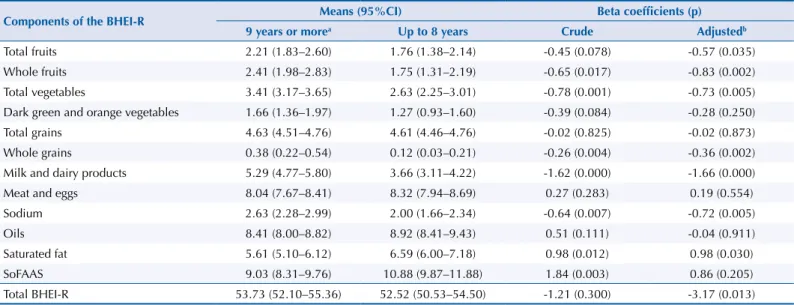
Table 4 shows the association between education level and the quality of the diet. Women with
lower education level had worse overall quality of the diet, higher intake of sodium, and lower intake of fruits, total vegetables, whole grains, milk and dairy products, and saturated fat.
Table 5 shows that stay-at-home women with low education level presented lower overall quality of the diet and lower intake of whole fruits, dark green and orange vegetables, and whole grains. Among working women, those who had up to eight years of education had higher intake of sodium and lower intake of total vegetables, whole grains, milk and dairy products, than the more educated women.
Table 2. Mean scores and beta coefficients of the components of the BHEI-R of working and stay-at-home women aged 18 to 64 years.
Campinas Health Survey (2008 ISACamp).
Components of the BHEI-R Means (95%CI) Beta coefficients (p) Working womena Stay-at-home women Crude Adjustedb
Total fruits 2.11 (1.77–2.46) 1.77 (1.34–2.19) -0.35 (0.135) -0.35 (0.110)
Whole fruits 2.12 (1.72–2.52) 2.09 (1.59–2.59) -0.03 (0.901) 0.03 (0.891)
Total vegetables 3.20 (2.99–3.42) 2.82 (2.38–3.26) -0.38 (0.050) 0.0004 (0.998) Dark green and orange vegetables 1.59 (1.35–1.83) 1.16 (0.80–1.53) -0.43 (0.028) -0.25 (0.277)
Total grains 4.63 (4.52–4.74) 4.65 (4.47–4.83) 0.02 (0.832) 0.04 (0.658)
Whole grains 0.26 (0.12–0.40) 0.27 (0.07–0.46) 0.01 (0.928) 0.003 (0.981)
Milk and dairy products 4.72 (4.18–5.27) 4.35 (3.69–5.00) -0.38 (0.361) 0.23 (0.529) Meat and eggs 8.27 (7.97–8.57) 8.21 (7.71–8.70) -0.06 (0.810) -0.11 (0.705)
Sodium 2.42 (2.07–2.76) 2.11 (1.67–2.54) -0.31 (0.218) -0.22 (0.448)
Oils 8.48 (8.04–8.92) 9.05 (8.51–9.59) 0.57 (0.098) 0.38 (0.334)
Saturated fat 5.67 (5.19–6.16) 6.44 (5.71–7.17) 0.77 (0.074) 0.58 (0.201)
SoFAAS 9.31 (8.57–10.05) 10.51 (9.31–11.70) 1.20 (0.077) 0.68 (0.322)
Total BHEI-R 52.79 (51.24–54.34) 53.42 (50.97–55.86) 0.63 (0.590) 1.03 (0.436) BHEI-R: Brazilian Healthy Esting Index – Revised; SoFAAS: calories from solid fat, alcohol, and added sugar
a Reference category used for comparison.
b Adjusted for age, education level, income, marital status, and number of children.
Table 3. Mean scores and beta coefficients of the components of the BHEI-R, according to the inclusion in the labor market and the education
level of women aged 18 to 64 years. Campinas Health Survey (2008 ISACamp).
Components of the BHEI-R
Adjusted analysesa
Up to 8 years 9 years or more
Working womenb Stay-at-home
women β (p) Working women
b Stay-at-home
women β (p)
Total fruits 1.99 1.42 -0.81 (0.004) 2.17 2.31 0.25 (0.567)
Whole fruits 1.90 1.52 -0.71 (0.015) 2.21 2.97 0.82 (0.081)
Total vegetables 2.49 2.55 -0.01 (0.974) 3.52 3.24 -0.01 (0.977)
Dark green and orange vegetables 1.31 0.86 -0.52 (0.053) 1.71 1.64 0.12 (0.786)
Total grains 4.56 4.67 0.10 (0.442) 4.66 4.62 -0.10 (0.452)
Whole grains 0.16 0.10 -0.14 (0.186) 0.30 0.54 0.20 (0.430)
Milk and dairy products 3.48 3.82 0.27 (0.636) 5.27 5.18 0.03 (0.957)
Meat and eggs 8.53 8.09 -0.57 (0.154) 8.16 8.38 0.28 (0.475)
Sodium 2.12 1.88 -0.09 (0.807) 2.54 2.46 -0.38 (0.364)
Oils 8.64 9.08 0.54 (0.241) 8.40 9.00 0.36 (0.429)
Saturated fat 6.34 6.74 0.17 (0.750) 5.39 5.98 1.12 (0.123)
SoFAAS 9.90 11.40 0.86 (0.249) 9.05 9.11 0.24 (0.807)
Total BHEI-R 51.44 52.13 -0.91 (0.593) 53.37 55.42 2.93 (0.226)
BHEI-R: Brazilian Healthy Eating Index – Revised; SoFAAS: calories from solid fat, alcohol, and added sugar
DISCUSSION
The results of this study expose the presence of iniquities in the living conditions between working and stay-at-home women. Stay-at-home women are older, married, poorer, with more children, and with lower education level. Research studies indicate that stay-at-home
women with lower education levels and family income had worse quality of life related to health20 and higher prevalence of chronic non-communicable diseases, mental disorders,
and depression15,21,22. However, the benefits of employment depend on the position held at
work and the socioeconomic level of the women16,23,24.
Regarding the quality of the diet according to the female inclusion in the labor market, we found no difference in the initial analysis. The lack of disparities in the diet was confirmed
Table 4. Mean scores and beta coefficients of the components of the BHEI-R, according to the education level of women aged 18 to 64
years. Campinas Health Survey (2008 ISACamp).
Components of the BHEI-R Means (95%CI) Beta coefficients (p) 9 years or morea Up to 8 years Crude Adjustedb
Total fruits 2.21 (1.83–2.60) 1.76 (1.38–2.14) -0.45 (0.078) -0.57 (0.035)
Whole fruits 2.41 (1.98–2.83) 1.75 (1.31–2.19) -0.65 (0.017) -0.83 (0.002)
Total vegetables 3.41 (3.17–3.65) 2.63 (2.25–3.01) -0.78 (0.001) -0.73 (0.005) Dark green and orange vegetables 1.66 (1.36–1.97) 1.27 (0.93–1.60) -0.39 (0.084) -0.28 (0.250)
Total grains 4.63 (4.51–4.76) 4.61 (4.46–4.76) -0.02 (0.825) -0.02 (0.873)
Whole grains 0.38 (0.22–0.54) 0.12 (0.03–0.21) -0.26 (0.004) -0.36 (0.002)
Milk and dairy products 5.29 (4.77–5.80) 3.66 (3.11–4.22) -1.62 (0.000) -1.66 (0.000)
Meat and eggs 8.04 (7.67–8.41) 8.32 (7.94–8.69) 0.27 (0.283) 0.19 (0.554)
Sodium 2.63 (2.28–2.99) 2.00 (1.66–2.34) -0.64 (0.007) -0.72 (0.005)
Oils 8.41 (8.00–8.82) 8.92 (8.41–9.43) 0.51 (0.111) -0.04 (0.911)
Saturated fat 5.61 (5.10–6.12) 6.59 (6.00–7.18) 0.98 (0.012) 0.98 (0.030)
SoFAAS 9.03 (8.31–9.76) 10.88 (9.87–11.88) 1.84 (0.003) 0.86 (0.205)
Total BHEI-R 53.73 (52.10–55.36) 52.52 (50.53–54.50) -1.21 (0.300) -3.17 (0.013) BHEI-R: Brazilian Healthy Eating Index – Revised; SoFAAS: calories from solid fat, alcohol, and added sugar
a Reference category used for comparison.
b Adjusted for age, income, marital status, and number of children.
Table 5. Mean scores and beta coefficients of the components of the BHEI-R, according to education level of working and stay-at-home
women aged 18 to 64 years. Campinas Health Survey (2008 ISACamp).
Components of the BHEI-R
Adjusted analysesa
Stay-at-home women Working women
Up to 8 years 9 years or moreb β (p) Up to 8 years 9 years or moreb β (p)
Total fruits 1.42 2.31 -0.88 (0.066) 1.99 2.17 -0.42 (0.235)
Whole fruits 1.52 2.97 -1.60 (0.001) 1.90 2.21 -0.56 (0.153)
Total vegetables 2.55 3.24 -0.79 (0.118) 2.49 3.52 -0.94 (0.002)
Dark green and orange vegetables 0.86 1.64 -1.04 (0.014) 1.31 1.71 -0.07 (0.827)
Total grains 4.67 4.62 0.12 (0.505) 4.56 4.66 -0.14 (0.314)
Whole grains 0.10 0.54 -0.67 (0.040) 0.16 0.30 -0.30 (0.009)
Milk and dairy products 3.81 5.18 -1.29 (0.115) 3.48 5.27 -1.84 (0.001)
Meat and eggs 8.09 8.38 -0.82 (0.089) 8.53 8.16 0.66 (0.084)
Sodium 1.88 2.46 -0.09 (0.799) 2.12 2.54 -0.75 (0.028)
Oils 9.01 8.99 -0.03 (0.947) 8.64 8.40 -0.18 (0.689)
Saturated fat 6.74 5.98 0.83 (0.319) 6.34 5.39 0.86 (0.164)
SoFAAS 11.40 9.11 0.43 (0.694) 9.90 9.04 0.12 (0.889)
Total BHEI-R 52.13 55.42 -5.83 (0.026) 51.44 53.37 -3.54 (0.075)
BHEI-R: Brazilian Healthy Eating Index – Revised; SoFAAS: calories from solid fat, alcohol, and added sugar
when we compared working and stay-at-home women with the same education level, and we could only note that the intake of fruits was lower among stay-at-home women than among working women in the stratum of lower education level. Research studies that have analyzed data from 187 countries indicate that the consumption of healthy food, including fruits and fruit juices, is directly related to the income level of the countries25,26. In Brazil, the
Household Budget Survey (2008–2009 POF) shows that the consumption of fruits and natural juices increases with increasing family income27. This result is consistent with that obtained
by a study that has evaluated the quality of the diet of the population of Campinas, state of São Paulo, Brazil, which has verified increasing score for fruits with increasing education
level of the head of the family28. Some hypotheses could partially explain the higher intake
of fruits among working women only in the lower education stratum. It is known that more than 19.5 million Brazilian workers are served by the Worker’s Food Program (PAT), whose menus must contain at least a portion of fruit in each meal provided29,30. Buffet restaurants,
which is a model spread throughout the country, offer a wide variety of affordable food, including fruits and natural juices, enabling persons to make healthy food choices8,31.
Studies that analyze the profile of food of women according to their participation in the labor market are scarce and present controversial results. A qualitative study carried out in Viçosa, state of Minas Gerais, Brazil, has found that factors such as age, income, family support, occupation, and health concern modified the diet more than being included in the
labor market7. Analyzing 1,555 Australian women aged 18 to 65, Thornton et al.32 have found
that the work outside the house did not modify the consumption of fruits, vegetables, and fast foods; however, the supply of healthy food near the workplace was associated with a higher intake of fruits and vegetables. On the other hand, in the study by Bauer et al.6, women
who worked full-time ate less fruits and vegetables, had fewer family meals, and gave their children less information about a healthy diet compared to the women who did not work or who worked part-time.
In this research, education level clearly differentiated the quality of the dietary pattern of the women. Lower education level was associated with poorer quality of the diet, as well as higher intake of sodium and lower intake of fruits, vegetables, whole grains, and saturated fat.
Other researchers have detected an association between the increase in education level and
the improvement of the overall quality of the diet, from the greater consumption of healthy
food28,33. The results of the 2008–2009 POF show that the low-income family segments have
a lower consumption of food high in saturated fats, such as meats, sausages, milk, cheese,
and butter27. Higher intake of sodium in the low education segment is consistent with the
results of a study that has observed higher household availability of sodium and food high
in sodium among economically disadvantaged persons34.
Although the education level can positively affect the diet, a study carried out in Campinas, state of São Paulo, Brazil, has found that even in the stratum of 12 years or more of education, the score of the total BHEI-R was very low (54.4 points on a scale from zero to 100), which shows the importance of promoting healthy eating habits in the entire population28.
Education encourages assertiveness, autonomy, and social participation of the women, which is essential to promote physical and mental health, in addition to more appropriate
food choices35. In a population of low-income women, Lins et al.36 have found that the
consumption of fruits and vegetables and the report of having a healthy diet were more prevalent among those with higher income and education. A qualitative study has observed that higher education level and income differentiated the food repertoire of the meals of the families studied, providing the inclusion of fruits, vegetables, cheese, yogurt, whole-wheat bread, and different types of meat37.
The Food Guide for the Brazilian Population (2014) warns that the loss of the custom of transmitting culinary skills between generations has contributed to the lack of autonomy and experience in food preparation in younger persons, who become increasingly dependent
on ready-made or almost ready-made food8. Faced with the change in the transmission of
culinary knowledge, Diez-Garcia and Castro37 indicate the importance of interventions
aimed at the development of the aptitude and autonomy in the preparation of food and the realization of meals at home as strategies to improve the quality of the diet of families. The loss of the value in cooking is reinforced by food advertising campaigns that spread the idea that modern women do not have time to lose to prepare food, disregarding the social and symbolic meaning of eating and cooking8,10.
Canesqui38 shows in an ethnographic study with low-income, urban working families the
changes in the transmission and use of culinary knowledge between two generations of women, noting that the generation of older women, who had a rural past, early socialized their daughters as future stay-at-home women, including the transmission of this knowledge, incorporating them effectively in the household chores of cooking food. The second generation of women, with the accumulation of experience of living in the city, on the contrary, socialized late their daughters in these tasks, did not delegate the cooking activity to them, generally giving them the work of cleaning the food and washing the household appliances and kitchen floors. This latter generation spared their adolescent daughters from household chores, ideologically devaluing the unpaid domestic work among the activities of the women, aspiring for them the reward for their investments in their education, preparation, and qualification for paid work. The evaluation of the results of this study needs to consider some limitations. One of them refers to the use of a single 24-hour recall, hindering the analysis of the usual intake of an individual given the great variability in food consumption17. However, we can estimate a mean
intake for the population when the recall is applied on a population basis and it considers
the different days of the week and months of the year, as in the 2008 ISACamp survey39.
The cross-sectional study hinders the interpretation of the associations found as resulting from cause and effect relationships. The ISACamp is not a specific nutrition research, therefore
it does not present detailed information related to food consumption. The knowledge about the frequency and types of food consumed at home and away from home and who buys and prepares the food could broaden the discussion of the results found in this study.
We can conclude that the quality of the diet of the women is modified by the inclusion in the labor market and the education level. Therefore, social policies are needed to increase the access of women to the educational system, as well as actions that promote healthy eating habits in the entire population.
REFERENCES
1. Bruschini MCA. Trabalho e gênero no Brasil nos últimos dez anos. Cad Pesq. 2007;37(132):537-72.
https://doi.org/10.1590/S0100-15742007000300003
2. Instituto Brasileiro de Geografia e Estatística. Censo Demográfico 2010: trabalho e rendimento. Rio de Janeiro: IBGE; 2010.
3. Instituto Brasileiro de Geografia e Estatística. Síntese de indicadores sociais: uma análise das condições de vida da população brasileira 2013. Rio de Janeiro: IBGE; 2013. [cited 2018 Jan 4]. (Estudos e Pesquisas: Informação Demográfica e Socioeconômica, 32). Available from: http:// biblioteca.ibge.gov.br/visualizacao/livros/liv66777.pdf
4. Jabs J, Devine CM. Time scarcity and food choices: an overview. Appetite. 2006;47(2):196-204.
https://doi.org/10.1016/j.appet.2006.02.014
5. Johnstone M, Lee C. Young Australian women’s aspirations for work and family: individual and
sociocultural differences. Sex Roles. 2009;61(3-4):204-20. https://doi.org/10.1007/s11199-009-9622-8
6. Bauer KW, Hearst MO, Escoto K, Berge JM, Neumark-Sztainer D. Parental employment and
work-family stress: associations with family food environments. Soc Sci Med. 2012;75(3):496-504.
7. Lelis CT, Teixeira KMD, Silva NM. A inserção feminina no mercado de trabalho e suas
implicações para os hábitos alimentares da mulher e de sua família. Saude Debate.
2012;36(95):523-32. https://doi.org/10.1590/S0103-11042012000400004
8. Ministério da Saúde (BR), Secretaria de Atenção à Saúde, Departamento de Atenção Básica. Guia alimentar para a população brasileira. 2.ed. Brasília (DF); 2014 [cited 2018 Jan 4]. Available from: http://bvsms.saude.gov.br/bvs/publicacoes/guia_alimentar_populacao_ brasileira_2ed.pdf
9. Burlandy L, Maluf RS. Soberania alimentar: dimensões de um conceito em construção e suas implicações para a alimentação no cenário contemporâneo. In: Taddei JAAC, Lang RMF, Longo-Silva G, Toloni MHA, editores. Nutrição em Saúde Pública. Rio de Janeiro: Rubio; 2011. p.457-69.
10. Monteiro CA, Castro IRR. Por que é necessário regulamentar a publicidade de alimentos. Cienc
Cult. 2009;61(4):56-9.
11. US Department of Agriculture; US Department of Health and Human Services. Dietary guidelines for Americans, 2005. Washington (DC); 2005 [cited 2018 Jan 4]. Available from: https://health.gov/DietaryGuidelines/dga2005/document/default.htm
12. Previdelli AN, Andrade SC, Pires MM, Ferreira SRG, Fisberg RM, Marchioni DM. Índice de
Qualidade da Dieta Revisado para população brasileira.Rev Saude Publica. 2011;45(4):794-98.
https://doi.org/10.1590/S0034-89102011005000035
13. Andrade SC, Previdelli AN, Marchioni DML, Fisberg RM. Avaliação da confiabilidade e
validade do Índice de Qualidade da Dieta Revisado. Rev Saude Publica. 2013;47(4):675-83.
https://doi.org/10.1590/S0034-8910.2013047004267
14. Alves MCGP. ISA-Campinas 2008/09: plano de amostragem. Campinas: Faculdade de Ciências Médicas da UNICAMP; 2008 [cited 2018 Jan 4]. Available from: http://www.fcm.unicamp.br/ fcm/sites/default/files/plano_de_amostragem.pdf
15. Klumb PL, Lampert T. Women, work, and well-being 1950-2000: a review and methodological
critique. Soc Sci Med. 2004;58(6):1007-24. https://doi.org/10.1016/S0277-9536(03)00262-4
16. Artazcoz L, Borrell C, Benach J, Cortès I, Rohlfs I. Women, family demands and health: the
importance of employment status and socio-economic position. Soc Sci Med. 2004;59(2):263-74.
https://doi.org/10.1016/j.socscimed.2003.10.029
17. Fisberg RM, Colucci ACA, Marques M, Castro MA. Inquéritos alimentares: métodos e bases científicas. In: Waitzberg DL. Nutrição oral, enteral e parenteral na prática clínica. 5. ed. rev. atual. São Paulo: Atheneu, 2017.
18. Fisberg RM, Villar BS. Manual de receitas e medidas caseiras para cálculo de inquéritos alimentares. São Paulo: Signus; 2002.
19. Pinheiro ABV, Lacerda EMA, Benzecry EH, Gomes MCS, Costa VM. Tabela para avaliação de consumo alimentar em medidas caseiras. 5.ed. São Paulo: Atheneu; 2004.
20. Senicato C, Lima MG, Barros MBA. Ser trabalhadora remunerada ou dona de casa
associa-se à qualidade de vida relacionada à saúde? Cad Saude Publica. 2016;32(8):e00085415.
https://doi.org/10.1590/0102-311X00085415
21. Araújo TM, Almeida MMG, Santana CC, Araújo EM, Pinho PS. Transtornos mentais comuns
em mulheres: estudo comparativo entre donas-de-casa e trabalhadoras. Rev Enferm UERJ.
2006;14(2):260-9.
22. Noordt M, IJzelenberg H, Droomers M, Proper KI. Health effects of employment: a
systematic review of prospective studies. Occup Environ Med. 2014;71(10):730-6.
https://doi.org/10.1136/oemed-2013-101891
23. Thomas C, Benzeval M, Stansfeld S. Psychological distress after employment transitions: the role
of subjective financial position as a mediator. J Epidemiol Community Health. 2007;61(1):48-52.
https://doi.org/10.1136/jech.2005.044206
24. Butterworth P, Leach LS, Strazdins L, Olesen SC, Rodgers B, Broom DH. The psychosocial quality of work determines whether employment has benefits for mental health: results from
a longitudinal national household panel survey. Occup Environ Med. 2011;68(11):806-12.
https://doi.org/10.1136/oem.2010.059030
25. Imamura F, Micha R, Khatibzadeh S, Fahimi S, Shi P, Powles J, et al. Dietary quality among men
and women in 187 countries in 1990 and 2010: a systematic assessment. Lancet Glob Health.
26. Singh GM, Micha R, Khatibzadeh S, Shi P, Lim S, Andrews KG, et al. Global, regional, and national consumption of sugar-sweetened beverages, fruit juices, and milk: a systematic
assessment of beverage intake in 187 countries. PLoS One. 2015;10(8):e0124845.
https://doi.org/10.1371/journal.pone.0124845
27. Levy RB, Claro RM, Mondini L, Sichieri R, Monteiro CA. Distribuição regional e socioeconômica
da disponibilidade domiciliar de alimentos no Brasil em 2008-2009. Rev Saude Publica.
2012;46(1):6-15. https://doi.org/10.1590/S0034-89102011005000088
28. Assumpção D, Domene SMA, Fisberg RM, Barros MBA. Social and demographic
inequalities in diet quality in a population-based study.Rev Nutr. 2016;29(2):151-62.
https://doi.org/10.1590/1678-98652016000200001
29. Ministério do Trabalho e Previdência Social (BR), Secretaria de Inspeção do Trabalho. Portaria nº 521, de 8 de janeiro de 2016. Resultados do Programa de Alimentação do Trabalhador - PAT,
alcançados até 31 de dezembro de 2015. Diario Oficial Uniao. 7 jan 2016 [cited 2018 Jan 4];
Seção 1. Available from: https://www.diariodasleis.com.br/legislacao/federal/232220-programa- de-alimentauuo-do-trabalhador-pat-divulga-os-resultados-do-programa-de-alimentauuo-do-trabalhador-pat-alcanuadas-atu-31-de-dezembro-de-2015.html
30. Ministério do Trabalho e Emprego (BR). Portaria nº 3, de 1º de março de 2002. Baixa instruções
sobre a execução do Programa de Alimentação do Trabalhador (PAT). Diario Oficial Uniao. 5
mar 2002 [cited 2018 Jan 4]. Available from: http://acesso.mte.gov.br/pat/portarias.htm 31. Santos MV, Proença RPC, Fiates GMR, Calvo MCM. Os restaurantes por peso
no contexto de alimentação saudável fora de casa. Rev Nutr. 2011;24(4):641-9.
https://doi.org/10.1590/S1415-52732011000400012
32. Thornton LE, Lamb KE, Ball K. Employment status, residential and workplace food
environments: associations with women’s eating behaviours. Health Place. 2013;24:80-9.
https://doi.org/10.1016/j.healthplace.2013.08.006
33. Hiza HAB, Casavale KO, Guenther PM, Davis CA. Diet quality of Americans differs by age,
sex, race/ethnicity, income, and education level. J Acad Nutr Diet. 2013;113(2):297-306.
https://doi.org/10.1016/j.jand.2012.08.011
34. Sarno F, Claro RM, Levy RB, Bandoni DH, Ferreira SRG, Monteiro CA. Estimativa de consumo
de sódio pela população brasileira, 2002-2003. Rev Saude Publica. 2009;43(2):219-25.
https://doi.org/10.1590/S0034-89102009005000002
35. Stewart DE, Ashraf IJ, Munce SE. Women’s mental health: a silent cause of mortality and
morbidity. Int J Gynaecol Obstet. 2006;94(3):343-9. https://doi.org/10.1016/j.ijgo.2006.04.025
36. Lins APM, Sichieri R, Coutinho WF, Ramos EG, Peixoto MVM, Fonseca VM. Alimentação
saudável, escolaridade e excesso de peso entre mulheres de baixa renda. Cienc Saude Coletiva.
2013;18(2):357-66. https://doi.org/10.1590/S1413-81232013000200007
37. Diez-Garcia RW, Castro IRR. A culinária como objeto de estudo e de intervenção
no campo da alimentação e nutrição. Cienc Saude Coletiva. 2011;16(1):91-8.
https://doi.org/10.1590/S1413-81232011000100013
38. Canesqui AM. Mudanças e permanências da prática alimentar cotidiana de famílias de trabalhadores. In: Canesqui AM, Diez Garcia RW, organizadoras. Antropologia e nutrição: um diálogo possível. Rio de Janeiro: Editora Fiocruz; 2005. p.167-210. (Coleção Antropologia e Saúde). 39. Breslow RA, Guenther PM, Juan W, Graubard BI. Alcoholic beverage consumption,
nutrient intakes, and diet quality in the US adult population, 1999-2006. J Am Diet Assoc.
2010;110(4):551-62. https://doi.org/10.1016/j.jada.2009.12.026
Funding: National Council for Scientific and Technological Development (CNPq – Process 409747/2006-8).
Ministry of Health and Department of Health of Campinas (Agreement Unicamp/Funcamp/SMS – financial support – Process 4300). Fundação de Amparo à Pesquisa do Estado de São Paulo (FAPESP –Doctoral scholarship – Process 2012/07039-7).
Authors’ Contribution: Planning and design of the study, analysis and interpretation of the data, and preparation
of the study: DA, CS, MBAB. Critical review of the study: RMF, AMC. All authors have approved the final version of the study and assume public responsibility for its content.