MSc. in Biotechnology
Characterization of genes of unknown
function in Bacillus subtilis: gene
regulation and functional analysis
Dissertation to obtain a PhD degree in Biology
Supervisor: Isabel Maria Godinho de Sá Nogueira, Associate
Professor with Habilitation (Agregação), FCT/UNL
May 2016
Copyright em nome de Lia Raquel Marques Godinho, e da Faculdade de Ciências e Tecnologia da Universidade Nova de Lisboa
‘A Faculdade de Ciências e Tecnologia e a Universidade Nova de Lisboa têm o direito, perpétuo e sem limites geográficos, de arquivar e publicar esta dissertação através de exemplares impressos reproduzidos em papel ou de forma digital, ou por qualquer outro meio conhecido ou que venha a ser inventado, e de a divulgar através de repositórios científicos e de admitir a sua cópia e distribuição com objectivos educacionais ou de investigação, não comerciais, desde que seja dado crédito ao autor e editor.
I would like to present my acknowledgements to Fundação para a Ciência e Tecnologia (FCT) for financial support with PhD fellowship SFRH/BD/73109/2010 and UciBio @ Requimte (and previously Centro de Recursos Microbiológicos) for providing all the work conditions for the completion of this thesis.
I also want to thank and acknowledge Professor Isabel de Sá-Nogueira, my supervisor, without whom this thesis would not exist. Thank you for the opportunity to join your lab, your guidance and knowledge and for your enthusiasm for science. You have passed along valuable knowledge, science-related and otherwise and I am grateful for it.
I want to acknowledge my thesis committee members, Professor Helena Santos (Head of Cell Physiology and NMR group at ITQB António Xavier - NOVA) and Professor Adriano Henriques (Head of Microbial Development group at ITQB António Xavier - NOVA), for the scientific input in this thesis and helpful discussions.
A special acknowledgment to everyone at the Cell Physiology and NMR lab, who welcomed me as one of their own all the times I had to work there, particularly Dušica Radoš, who ran all the NMR experiments with me and provided major help with data analysis presented in this thesis. A word of appreciation to Ana Isabel Mingote and Ana Lúcia Carvalho, who participated in the early experiments.
To my lab mates from Microbial Genetics, from the first day I started at the lab, who were either permanent or transient: Joana Pedro and Joana Lima, Inês Martins, Sónia, Renato, Miguel, Maria João, Liliana and all other undergrads. I had the opportunity to get to know and help some of them along the way, but I also learned from it, scientifically and personally.
To Mário, for all the times we shared in the lab – work related discussions and flat out dorky and geeky discussions. It wouldn’t have been the same without you dude! And sorry about all those times I spoiled your favorite TV shows! Maria Isabel, a thousand “thank yous” would not suffice to thank you for all you did for me, be it science-related or otherwise. Viviana and Tides, I am truly thankful you two boarded the 327 crazy train. I could not have asked for better co-workers, honestly – your sense of humor (even the lame jokes!), encouraging words and friendship made these times worth every minute.
To “330” members Damien and Bárbara, thanks for being a part of this ride, for always being there with an easy smile and words of encouragement. To Raquel, a true pillar for the 330 gang, beloved friend and PhD student next door – thank you for your friendship, helpful discussions and support. Thank you for always being on the other side of that wall. We’re lucky to have “adopted” you.
Thank you to all my coworkers at the Departamento de Ciências da Vida at FCT-UNL, with special thanks to Márcia Palma, Carla Gonçalves, Miguel Larguinho, João Rosa, and at a later phase, the neighbors from Jaime Mota lab (Lia, Irina, Filipe, Sara, Nuno, Joana and Maria). Also a word of appreciation to the 427 lab from Requimte, especially to Professor Susana Barreiros and Alexandre Paiva, for allowing me to use laboratory equipment and material, and also for their kind words of encouragement.
Aos meus amigos de sempre, tão antigos que parece que estão comigo desde o início dos tempos. Ana, Hugo, Marta, PP e Rita, obrigada pelo vosso apoio, encorajamento, momentos de riso e de parvoíce. Obrigada por serem sempre constantes.
À Diana, cuja distância física de 1600 km foi sempre colmatada por chamadas pelo Skype que duravam até às 2h da manhã em dias de semana, conversas no Whatsapp ou vindas relâmpago a Portugal que tiveram sempre espaço para mim. Obrigada por me aturares, ouvires e aconselhares… e por me trazeres sempre chocolates.
Obrigada pelo apoio, boa disposição e bons momentos passados no mundo do fitness, que foram muito importantes nestes últimos tempos. #tamosjuntos. Um obrigada especial à Catarina “Cacá Jam”, que passou de sócia a instrutora e depois a amiga do coração: obrigada por estares sempre pronta para ouvir desabafos e reclamações e no fim me levares para fazer um Body Jam, fosse onde fosse.
Agradeço muito à minha família, em especial aos meus pais, Virgínia e Custódio, e à minha irmã, Irina, por todo o apoio incondicional e amor, por serem uma referência e um pilar e por estarem sempre a torcer por mim. Sem vocês não teria sido possível concretizar esta tese.
Finalmente, mas não menos importante, um obrigada muito especial ao Ângelo, por ser o poço de calma e motivação que me atura todos os dias há quase meia dúzia de anos. Fosse nos dias bons, nos dias maus, nos dias de sol ou nos dias de chuva houve sempre compreensão, carinho, amor e amizade .
3C –3 carbon 5C – 5 carbon 6C – 6 carbon
6PG – 6-phosphogluconate
µg.mL-1 – micrograms per milliliter
µM – micromolar μl – microliter [ ] – concentration
αMG6P – α-methyl glucoside-6-phosphate Abs – Absorbance
ADP – Adenosine diphosphate Acetyl-CoA – acetyl Coenzyme A ara – arabinose
ATP – Adenosine triphosphate BCAA – branched- chain amino acids
bla – β-lactamase gene conferring resistance to ampicillin bp – base pair
BSH – Bacillithiol
BSA – Bovine Serum Albumin
cAMP – cyclic adenosine monophosphate
cat – chloramphenicol acetyl transferase gene, conferring resistance to chloramphenicol CcpA – catabolite control protein A
CCR – carbon catabolite repression CO2 – carbon dioxide
cre – catabolite responsive elements Crh – catabolite repression HPr CRP – cAMP receptor protein
DHAP – dihydroxyacetone phosphate DDH – DDH phosphodiesterases family DIP – D-myo-inositol
DNA – deoxyribonucleic acid dNTPs – deoxynucleotides E4P – erythrose 4-phosphate ECL – electrochemiluminescence EDTA – Ethylenediaminetetraacetic acid
ED – Entner–Doudoroff
erm – erythromycin resistance gene F6P – fructose 6-phosphate
FAD – flavin adenine dinucleotide FBP – fructose 1,6-bisphosphate FDA – Food and Drug Administration G6P – glucose 6-phosphate
GA3P – glyceraldehyde 3-phosphate Glycerol-3P – glycerol 3-phosphate GRAS – Generally Regarded As Safe
HPr – histidine-containing phosphocarrier protein HADSF – Haloacid Dehalogenase Super Family HD – HD phosphohydrolases family
HCl – hydrochloric acid
IPTG - Isopropyl β-D-1-thiogalactopyranoside km – kanamycin resistance gene
kb – kilobase
kcat – catalytic constant
KCl – potassium chloride kDa – kiloDalton KM – Michaelis constant LB – Luria Broth M – molar MG – methylglyoxal mM – micromolar
mRNA – messenger RNA
NAD+/NADH – nicotinamide adenine dinucleotide oxidized/reduced
NADP+/NADPH – nicotinamide adenine dinucleotide phosphate oxidized/reduced
NTPases – nucleotide phosphatases nm – nanometer
nM – nanomolar
NTA Ni2+ – nitrilotriacetic acid
NTC – no template control OR – operator
ORF – open reading frame Para – arabinose operon promoter
PCR – polymerase chain reaction
PHP – polymerase and histidinol phosphatase family of proteins Pi – inorganic phosphate
PMSF – phenylmethylsulfonyl fluoride pNPP – p-nitrophenyl phosphate ppm – parts per million
PPP – pentose phosphate pathway PTS – phosphotransferase system QPS – Qualified Presumption of Safe
qRT-PCR – quantitative real time polymerase chain reaction R5P – ribulose 5-phosphate
RBS – ribosome binding site rib – ribitol
RLU – relative luminescence units RNA – ribonucleic acid
RNase – ribonuclease
S7P – sedoheptulose 7-phosphate
SDS-PAGE – sodium dodecyl sulfate polyacrylamide gel electrophoresis TCA – tricarboxylic acid cycle
UDP-galactose – uracil-diphosphate galactose UDP-glucose – uridine-diphosphate glucose UV – ultraviolet
X5P – xylulose 5-phosphate
X-Gal – 5-bromo-4-chloro-3-indolyl-β-D-galactopyranoside w/v – weight per volume
Arginine Arg R
Asparagine Asn N
Aspartic acid Asp D
Cysteine Cys C Glutamate Glu E Glutamine Gln Q Glycine Gly G Histidine His H Isoleucine Ile I Leucine Leu L Lysine Lys K Methionine Met M Phenylalanine Phe F Proline Pro P Serine Ser S Threonine Thr T Tryptophan Try W Tyrosine Tyr Y Valine Val V Base Letter Adenine A Cytosine C Guanine G Thymine T
Bacillus subtilis is involved in the enzymatic degradation of plant biomass, namely polysaccharides with a high content in arabinose, one of the most abundant pentose in nature. The operon araABDLMNPQ-abfA of Bacillus subtilis, is responsible for arabinan utilization and arabinose catabolism, however the role of two genes, araL and araM, in this context is still elusive. AraM is a dehydrogenase and AraL a phosphatase but they are not necessary for arabinose utilization. Transcription of the metabolic operon is induced by arabinose and negatively regulated by AraR. In an araR-null mutant, addition of arabinose to an exponentially growing culture results in immediate cessation of growth. In this study to investigate the role of both genes in the toxic effect caused by arabinose, in-frame deletions of araL and araM were constructed and their impact analyzed. The results strongly suggest that araL and araM do not participate in this phenomenon. In addition, AraL, which belongs to the haloacid dehalogenase HAD superfamily, was biochemically characterized and substrate screening showed AraL to have low specificity and catalytic activity towards several sugar phosphates. Thus, we propose a putative physiological role of AraL in detoxification of accidental accumulation of phosphorylated metabolites. AraL production is regulated by a structure in the translation initiation region of the mRNA, which probably blocks access to the ribosome-binding site, preventing protein synthesis.
Accumulation of sugar phosphate is known to be toxic for the majority of prokaryotic and eukaryotic cells, however the mechanisms that underlie toxicity are yet to be fully understood. Here, we investigated the growth arrest phenotype displayed in the presence of arabinose by B. subtilis strains lacking the regulator AraR. The current hypothesis is that the bacteriostatic effect observed could be due to an increased intracellular level of arabinose, which consequently arise the concentration of the metabolic sugar phosphates intermediates that are toxic to the cell. Analysis of both wild-type and mutant strains by quantification of mRNA levels, phosphorylated metabolites, accumulation of cytotoxic methylglyoxal, and ATP depletion, suggests distinct mechanisms underlying toxicity. This study highlights the importance of a secondary metabolic pathway regulator in the optimal growth of an industrial relevant species, B. subtilis, and how its deletion may negatively impact the overall central carbon metabolism.
Keywords: Bacillus subtilis; sugar phosphatase; Haloacid Dehalogenase; phosphosugar toxicity; arabinose metabolism; methylglyoxal
Bacillus subtilis é uma bactéria Gram-positiva envolvida na degradação enzimática da biomassa vegetal nomeadamente polissacáridos com elevado conteúdo em arabinose, uma das pentoses mais abundantes na natureza. Em B. subtilis o operão araABDLMNPQ-abfA é responsável pela utilização de arabinano e arabinose, ainda que a função de dois dos seus genes, araL e araM, nesse contexto seja pouco clara. AraM é uma desidrogenase e AraL uma fosfatase, sendo ambas dispensáveis para a utilização de arabinose. A transcrição do operão metabólico é induzida pela arabinose e negativamente regulada pela proteína AraR. Num mutante nulo araR, a adição de arabinose a uma cultura em crescimento exponencial resulta numa paragem imediata no crescimento. Neste trabalho, para avaliar o papel dos dois genes no efeito tóxico causado pela arabinose foram construídas deleções em grelha de leitura dos genes araL e araM e o seu efeito analisado. Os resultados indicam que nem araL nem araM se encontram envolvidos neste fenómeno de toxicidade.
AraL, o produto do gene araL, pertencente à superfamília de proteínas HAD, foi bioquimicamente caracterizado e uma análise de substratos mostrou que AraL possui baixa especificidade e actividade catalítica em relação a vários açúcares fosforilados, podendo AraL ter uma função na destoxificação de metabolitos fosforilados que acumulem na célula. A produção de AraL é regulada por uma estrutura secundária ao nível do mRNA, situada na região de início de transcrição, bloqueando o acesso ao local de ligação ribossómico e impedindo a síntese proteica.
A acumulação de açúcares fosforilados é tóxica para a maioria dos organismos, no entanto os mecanismos associados a esta toxicidade não são ainda totalmente compreendidos. Aqui investigou-se o fenótipo de paragem de crescimento de uma cultura em fase exponencial após adição de arabinose num mutante de B. subtilis desprovido do regulador AraR. A hipótese actual assenta no pressuposto de o efeito bacteriostático ser causado por um aumento na concentração intracelular de arabinose, e consequente aumento na concentração intracelular de intermediários fosforilados, sendo estes tóxicos para a célula. A análise de uma estirpe selvagem e de estirpes mutantes através da quantificação de níveis de mRNA, determinação da acumulação do metabolito citotóxico metilglioxal e comparação dos níveis de ATP, aponta para mecanismos distintos na base desta toxicidade. Este trabalho realça a importância de um regulador de uma via metabólica secundária no crescimento de um microrganismo industrialmente relevante, como B. subtilis, e como a sua deleção pode ter um impacto negativo no metabolismo central de carbono.
Palavras-chave: Bacillus subtilis; fosfatase de açúcares; Desalogenase Haloácida; toxicidade de açúcares fosforilados; metabolismo da arabinose; metilglioxal
This thesis is organized in five chapters. Chapter I is an introduction to Bacillus subtilis, and carbohydrate uptake by this organism. Main carbohydrate utilization pathways, glycolysis, pentose phosphate pathway and tricarboxylic acid cycle are described, as well as general mechanisms of carbon catabolite control. This chapter also focuses on L-arabinose metabolism and regulation of arabinose utilization genes, followed by an overview of HAD phosphatases and sugar phosphate toxicity in bacteria.
Chapter II emphasizes the role of both araL and araM genes in the context of the arabinose operon, as they are not necessary for L-arabinose utilization. This chapter describes experiments to investigate their role in the phenomenon of toxicity caused by arabinose in a strain deregulated for arabinose utilization. The results strongly suggest that araL and araM do not play a role in the toxic effect of arabinose observed in an araR-null mutant.
Chapter III explains the cloning, overexpression, and biochemical characterization of AraL from B. subtilis. The enzyme displays phosphatase activity, low specificity and catalytic activity towards several sugar phosphates, which are metabolic intermediates of the glycolytic and pentoses phosphate pathways. Moreover, results evidence the existence a genetic regulatory mechanism controlling AraL production at the mRNA level, with formation of a secondary structure in the translation initiation region of the mRNA. The putative role of AraL in the context of arabinose utilization is discussed here. Chapter IV focuses on sugar phosphate toxicity studies in bacteria, using B. subtilis as a model organism. Arabinose is toxic to a mutant lacking the negative regulator of the arabinose operon, AraR. By combining different techniques, it is shown that arabinose-sensitivity of the mutant strain is accompanied by an increase in gene expression concomitant with an increase in the levels of arabinose-degrading enzymes, as well as accumulation of several phosphorylated intermediates from the pentose phosphate and glycolytic pathways and the cytotoxic compound methylglyoxal, and a drop in ATP.
Acknowledgments ... vii
Abbreviations ... ix
Abstract ... xiii
Resumo ...xv
Thesis Outline ... xvii
Index of Figures ... xxiii
Index of Tables ... xix
Chapter I. General Introduction ...3
Bacillus subtilis: a Gram-positive model organism ...3
Carbohydrate metabolism of B. subtilis in its natural habitat ...4
B. subtilis natural habitat – gut or soil? ...5
Central carbon Metabolism in B. subtilis ...5
Glycolysis – The Embden-Meyerhof Pathway ...5
Pentose Phosphate Pathway ...7
Tricarboxylic Acid Cycle ...9
Carbohydrate Uptake and Global Regulation of Carbohydrate Uptake ...10
Arabinose metabolism in B. subtilis ...14
The ara loci of B. subtilis ...15
ara regulon ...16
Genes of unknown function in B. subtilis in the context of the arabinose operon ...17
Haloacid Dehalogenase Superfamily ...17
The Sugar Phosphate Toxicity Phenomenon ...20
Sugar Phosphate Toxicity in Escherichia coli ...20
Sugar Phosphate Toxicity in Bacillus subtilis ...21
Chapter II. Role of araL and araM in the context of the arabinose operon ...23
Abstract ...25
Introduction ...25
Materials and Methods ...26
Substrates ...26
Bacterial strains and growth conditions ...26
DNA manipulation, PCR amplification and sequencing ...27
Plasmid construction ...27
In-frame deletion of araL and araLM using pMAD...28
Gene replacement in B. subtilis ...29
In-frame deletions of araL and araLM ...32
Ectopic expression of araL and araLM under the control of an inducible promoter ...35
Chapter III. Characterization and regulation of a bacterial sugar phosphatase of the haloalkanoate dehalogenase superfamily, AraL, from Bacillus subtilis ...39
Abstract ...41
Introduction ...41
Materials and Methods ...42
Substrates ...42
Bacterial strains and growth conditions ...43
DNA manipulation, PCR amplification and sequencing ...43
Plasmid constructions ...43
Site-Directed Mutagenesis ...44
Overproduction and purification of recombinant AraL proteins in E. coli ...44
Protein analysis ...44
Enzyme assays ...45
In-frame deletion of araL in B. subtilis ...46
Construction of an in-frame araL’-‘lacZ fusion and integration at an ectopic site ...46
-Galactosidase activity assays ...47
In-frame point mutation in the araL locus of B. subtilis ...47
Immunoblotting of cell extracts ...47
Results and Discussion ...51
The araL gene in the context of the B. subtilis genome and in silico analysis of AraL ...51
Over-production and purification of recombinant AraL ...54
Characterization of AraL ...54
AraL is a sugar phosphatase ...54
Production of AraL in E. coli is subjected to regulation ...58
Regulation and putative role of AraL in B. subtilis ...60
Chapter IV. Sugar Phosphate Toxicity in Bacillus subtilis ...63
Abstract ...65
Introduction ...65
Materials and Methods ...67
Substrates ...67
Bacterial strains and growth conditions ...67
DNA manipulation, PCR amplification and sequencing ...67
Real-Time PCR experiments ...69
Methylglyoxal assay ...69
Cold ethanolic extracts of B. subtilis cultures...69
Identification of phosphorylated metabolites by NMR spectroscopy...70
Quantification of intracellular ATP ...70
Results and Discussion ...72
Analysis of arabinose sensitivity in different Bacillus subtilis mutant strains ...72
Production of methylglyoxal by mutant B. subtilis strains ...76
Accumulation of phosphosugars is a major driving force of arabinose toxicity in the absence of AraR ...78
Imbalance of ATP in the cell plays a role in arabinose toxicity in B. subtilis ...80
Growth arrest phenotype in an ara-null mutant strain of B. subtilis is caused by multiple factors ...82
Chapter V. Concluding Remarks and Future Perspectives ...85
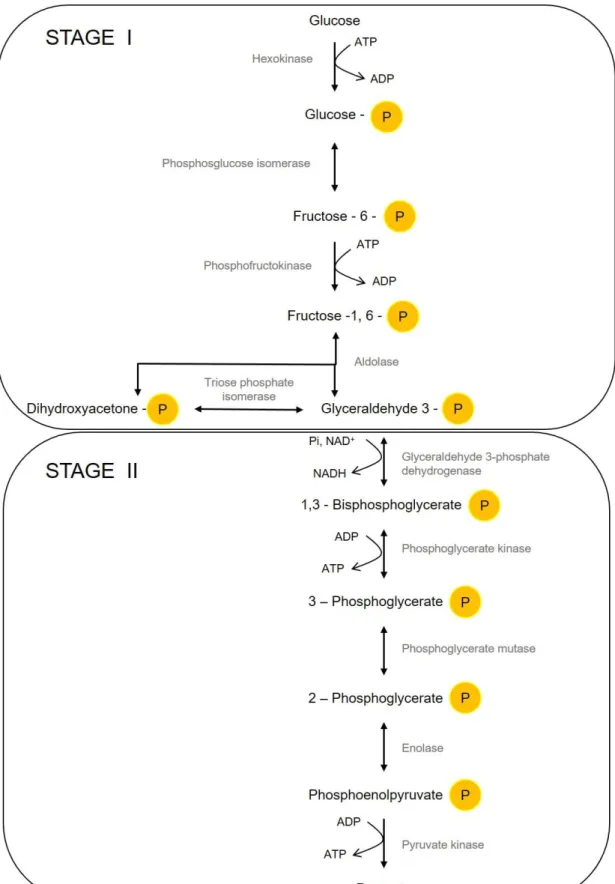
Figure 1.1. Embden–Meyerhof-Parnas pathway (EMP). Schematization of the conversion of glucose into pyruvate. Here represented are the two branches of glycolysis: Stage I, where 6C glucose is broken down to triose phosphates (3C) and Stage II, where ATP and NADH are formed. Single-head arrows indicate irreversible enzymatic reactions and double-head arrows represent reversible enzymatic reactions. ... 6
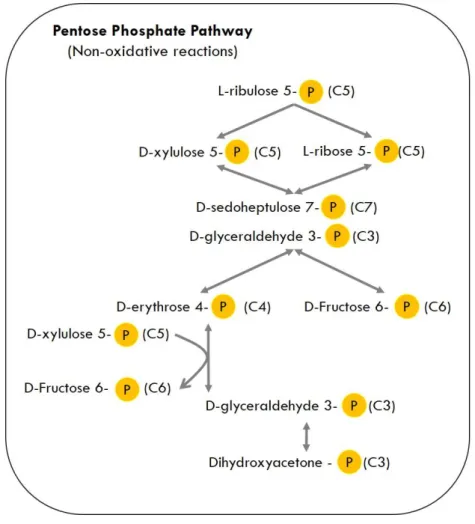
Figure 1.2. Non-oxidative reactions of the Pentose Phosphate Pathway (PPP). Single-head arrows indicate irreversible enzymatic reactions and double-head arrows represent reversible enzymatic reactions. Most of the reactions are reversible, meaning that the rearrangement of several sugar phosphates in the non-oxidative phase of the PPP allows intermediaries to be used for catabolism (F6P, DHAP, GA3P) and ATP production or to generate riboses from glycolytic intermediates for biosynthesis (R5P, E4P). ... 8
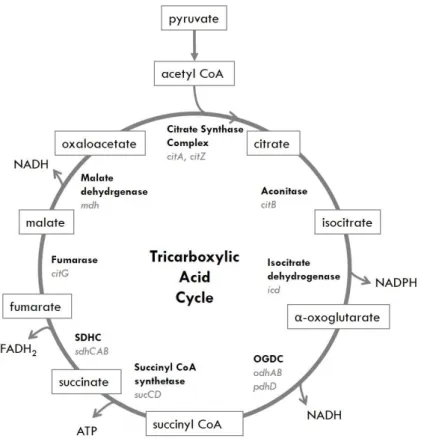
Figure 1.3. Tricarboxylic Acid Cycle. Also known as the Krebs cycle, this pathway yields ATP, reducing power and biosynthetic intermediaries, such as α-oxoglurarate, a precursor for glutamate and derivatives, oxaloacetate, a precursor of aspartate and succinyl-CoA. Relevant enzymes and enzymatic complexes are shown in bold, while genes encoding for those enzymes are italicized in grey. OGDC stands for oxoglutarate dehydrogenase complex and SDHC stands for succinate dehydrogenase complex. ... 10
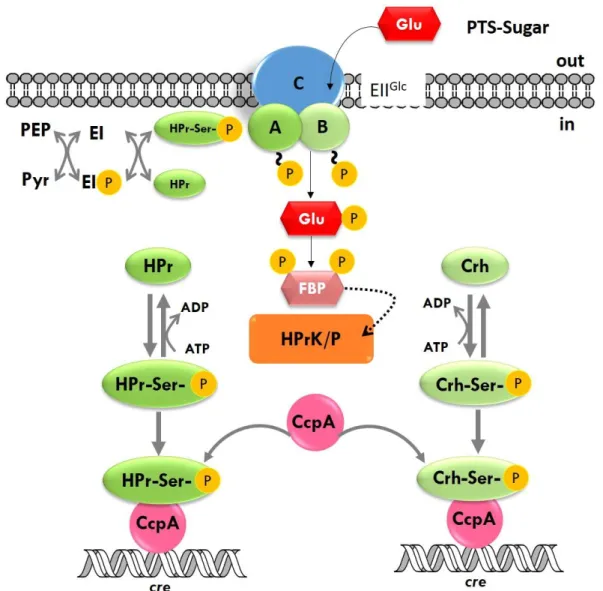
Figure 1.4. Carbon Catabolite Regulation in Bacillus subtilis. Uptake of a PTS-sugar (eg. glucose) leads to an increase in the intracellular [FBP], triggering ATP-dependent HPr kinase/phosphatase-catalyzed phosphorylation of HPr and Crh at Ser46. Only the Ser46-P forms of HPr and Crh bind to CcpA. The HPr-Ser46-P /CcpA and Crh-Ser46-P /CcpA complexes can bind to the catabolite responsive elements, cre, to cause Carbon Catabolite Repression or Carbon Catabolite Activation, depending on the position of the cre. Adapted from Deutscher et. al. 2002; Fujita 2009. ... 13
Figure 1.5. Genetic organization of the arabinose operon (A) and pathway for the utilization of arabinose in Bacillus subtilis (B). Operon genes, as well as the repressor and permease genes are represented by an arrow. Promoters ( ) and terminators ( ) are also represented. ... 15
Figure 1.6. Topology diagram of the typical Rossmanoid-like fold from the HAD superfamily. Conserved core strands are in blue, non-conserved elements are depicted in grey. Broken lines indicate secondary structures that may not be present in all family members. The initial strand containing the conserved d residue is rendered in yellow, and C1 and C2 cap insertion points are depicted in green and orange, respectively. The α-helical turn (pink) and the β-hairpin turn (two blue strands projecting from the core of the domain, downstream from the “squiggle”) (adapted from Burroughs et. al. 2006). ... 18
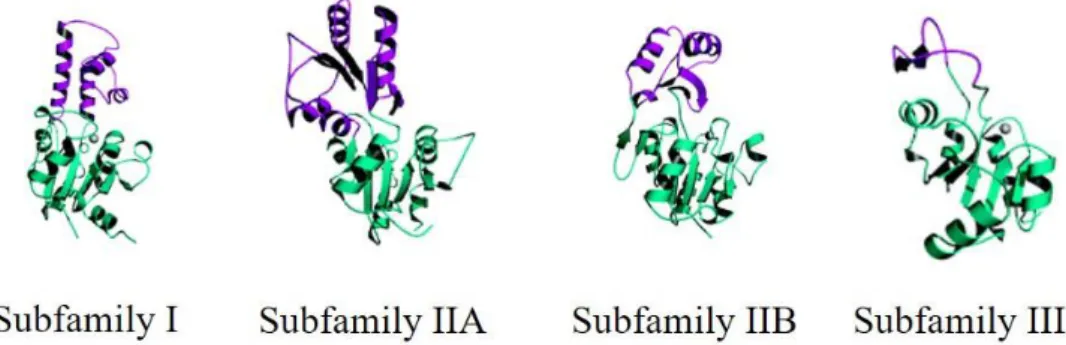
from left to right: Subfamily I, β-phosphoglucomutase; subfamily IIA, NagD; subfamily IIB, Phosphoglycolatephosphatase and subfamily III, magnesium dependent phosphatase 1. The common domain to all subfamilies is rendered in green, while the different cap domains are colored in purple. Adapted from Lu et. al. 2005. ... 19
Figure 2.1. Schematic representation of transcription fusion in pLG8. Plasmid pLG8 harbors a transcriptional fusion of the arabinose promoter with the araL and araM genes. Promoter elements -10 and -35 regions are represented, as well as the +1 site, cre and beginning of araA coding sequence, araL rbs, and beginning of the araL coding sequence. Some restriction enzymes are indicated ... 28
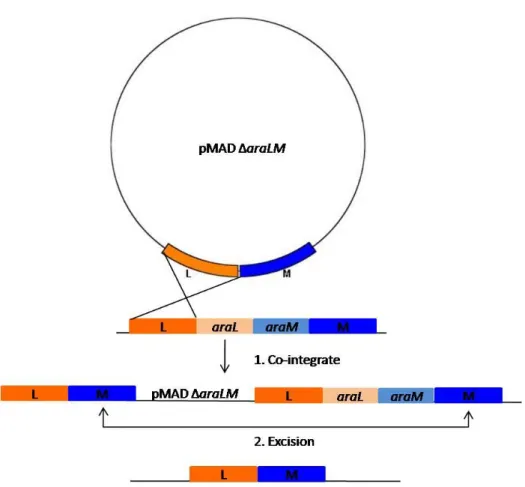
Figure 2.2. Schematic representation the two-step procedure used to obtain gene replacement recombination with pMAD. Areas labeled L and M represent DNA sequences located upstream and downstream from araL and araM genes. The crossed lines indicate crossover events. The integration of pMAD via homologous sequences can take place in area L or M. The co-integrate undergoes a second recombination event, regenerating the pMAD plasmid. Gene replacement occurs only if the second recombination event occurs in area M, as shown (adapted from Arnaud et. al. 2004) . ... 30
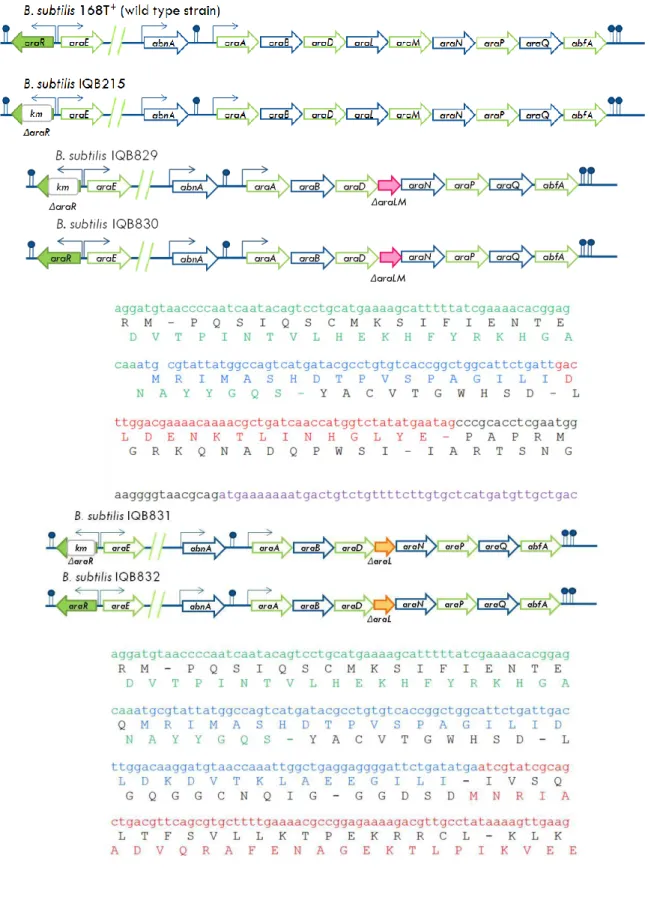
Figure 2.3. Schematic representation of the relevant genotype in B. subtilis strains 168T+, IQB215
and IQB829, 830, 831 and 832 genotypes. The sequence of the deleted region originated by integration of the pMAD derivatives is shown. Nucleotide and amino acid sequence are represented according to the following color code: green (araD – AraD), blue (araL – AraL), red (araM – AraM) and purple (araN – AraN). ... 34
Figure 3.1. Schematic representation of the araL genomic context in B. subtilis. White arrows pointing in the direction of transcription represent the genes in the arabinose operon, araABDLMNPQ-abfA. The araL gene is highlighted in grey and the promoter of the transcriptional unit depicted by a black arrow. The putative ribosome-binding site, rbs, is underlined. The 5´-end of araL present in the different constructs pLG5, pLG11, pLG12 and pLG13, is indicated by an arrow above the sequence. Mutations introduced in the construction of pLG11, pLG13 and pLG26 are indicated below de DNA sequence and the corresponding modification in the primary sequence of AraL depicted above. ... 51
Figure 3.2. Alignment of AraL with other pNPPases members of the HAD superfamily (sub family IIA). The amino acid sequences of HdpA (formerly cgR_2128) from Corynebacterium glutamicum, AraL from Bacillus subtilis, NagD from Escherichia coli , the p-nitrophenyl phosphatases (pNPPases) from Plasmodium falciparum (A5PGW7,) Saccharomyces cerevisiae, and Schizosaccharomyces pombe were aligned using CLUSTAL W2 (Larkin et. al. 2007). Similar (.,:) and identical (*) amino acids are indicated. Gaps in the amino acid sequences inserted to optimize alignment are indicated by a ‘-’. The
point to the catalytic residues in motifs I-IV. Identical residues in all five sequences are highlighted in dark grey. ... 53
Figure 3.3. Over-production and purification of recombinant AraL-His6. A. Analysis of the
soluble (S) and insoluble (P) protein fraction (20 μg total protein) of induced cultures of E. coli BL21 (DE3) pLysS harboring pET30a (+) (control) and pLG11 (AraL-His6). B. Analysis of
different fractions of purified recombinant AraL eluted with 300 mM of imidazole. The proteins were separated by SDS-PAGE 12.5% gels and stained with Coomassie blue. A white arrowhead indicates AraL-His6. The size, in kDa, of the broad range molecular mass markers (Bio-Rad
Laboratories, Hercules, CA, USA) are indicated. ... 55
Figure 3.4. Effect of pH, temperature, and co-factor concentration on AraL activity. Enzyme activity was determined using pNPP as substrate, at 65 ˚C, pH 7 and 15 mM MgCl2 unless stated otherwise. The results represent the average of three independent experiments. ... 56
Figure 3.5. Site-directed mutagenesis in the 5’-end araL and over-production of recombinant AraL-His6. A. The secondary structure of the araL mRNA in pLG12 (left) and pLG13 (right),
which bears a single nucleotide change. An arrowhead highlights the mutated nucleotide located at the beginning of the araL coding region. The ribosome-binding site, rbs, and the initiation codon (ATG) are boxed. Position relative to the transcription start site is indicated. The free energy of the two secondary structures, calculated by DNAsis v 3.7 (©Hitachi Software Engineering Co. Ltd), is shown.
B. Over-production of recombinant AraL-His6. Analysis of the soluble (S) and insoluble (P) protein
fraction (20 μg total protein) of induced cultures of E. coli Bl21 (DE3) pLysS harboring pLG12 (AraL-His6) and pLG113 (AraL-His6 GA). The proteins were separated by SDS-PAGE 12.5% gels
and stained with Coomassie blue. A white arrowhead indicates AraL-His6. The sizes, in kDa, of the
broad range molecular mass markers (Bio-Rad Laboratories, Hercules, CA, USA) are indicated. ... 59
Figure 3.6. Regulation of araL in B. subtilis. A. Site-directed mutagenesis in the 5’-end araL. The secondary structure of the araABDLMNPQ-abfA mRNA in the 5’-end araL region is depicted. An arrow highlights the mutated nucleotide (circled) located at the beginning of the araL coding region. The ribosome-binding site, rbs, is boxed. The free energy of the wild-type (WT) and mutated (mut CA) secondary structures, calculated by DNAsis v 3.7 (©Hitachi Software Engineering Co. Ltd), are shown.
B. Expression from the wild-type and mutant araL´-lacZ translational fusion. The B. subtilis strains IQB847 (Para-araL’-‘lacZ) and IQB849 (Para-araL’ (CA) -‘lacZ) were grown on C minimal medium supplemented with casein hydrolysate in the absence (non-induced) or presence (induced) of arabinose. Samples were analyzed 2 h after induction. The levels of accumulated -galactosidase activity represent
measurements. ... 60
Figure 3.7. AraL accumulation in the cell determined by Western Immunoblot analysis. Equal amounts of the soluble fractions of cell extracts obtained from B. subtilis cultures harboring a wild-type or mutant araL allele and grown in the absence or presence of inducer were prepared as described in Materials and Methods. (A) Wild-type strain 168T+ (B) Wild-type strain 168T+ in the presence of
arabinose (C) araR-null mutant strain IQB215 (D) Strain IQB869, bearing the CA, AraL Thr6Lys mutation (E) Strain IQB869, bearing the CA, AraL Thr6Lys mutation in the presence of arabinose (F) Strain IQB870, bearing the CA, AraL Thr6Lys mutation in an, as well as the araR-null mutant background. ... 61
Figure 4.1. Methylglyoxal production in B. subtilis strains. Methylglyoxal presence in the medium was measured in the absence of sugar (white bars), in the presence of arabinose (black bars) and in the presence of ribitol (grey). Error bars represent the standard deviation of at least three independent experiments and differences were considered statistically significant. Unpaired Two-tailed t test and GraphPad Prism version 5.00 for Windows (GraphPad Software) were used for statistical analysis .. 77
Figure 4.2. 31P-NMR analysis of B. subtilis cell extracts. Freeze-dried extracts were dissolved in
MilliQH2O and analyzed by 31P-nuclear magnetic resonance (NMR). NMR spectra were acquired in
a Bruker Avance II 500-MHz spectrometer. On the left, NMR spectra of the wild-type strain 168T+
acquired in the presence (A) and in the absence (B) of arabinose. On the right, NMR spectra of the mutant araR-null strain IQB215 acquired in the presence (C) and in the absence (D) of arabinose. Accumulation of several phosphate monoesters, between 1.5 and 3.5 ppm, corresponding to phosphorylated sugars can be seen in C, when compared to A, B or D. ... 79
Figure 4.3. Metabolite Identification of Phosphorylated Sugars by 31P-NMR. 31P-NMR spectrum
of freeze-dried extract of the mutant araR-null strain IQB215 acquired in the presence of arabinose. Pi is visible at 0.5 ppm, while the identified metabolites all fall in the phosphate monoester region, between 1.6 and 3.1 ppm. Arrows point towards the phosphosugars, namely L-ribulose 5-phosphate (Ribulose5P), D-xylulose 5-Phosphate (Xylulose5P), fructose 1,6-bisphosphate (FBP), glucose phosphate (Glucose6P), phosphogluconate (6P-G). Although identified through spiking, fructose 6-phosphate (F6P) is not shown here, as its signal is masked by the stronger FBP signal. ... 79
Figure 4.4. Interconnection between the pentose phosphate pathway and glycolysis. Dashed arrows indicate entry points of PPP metabolites in the glycolytic pathway, namely F6P and GA3P. Also indicated are the enzymes that catalyze PPP and glycolysis reactions: AraD - L-ribulose 5-phosphate
glucose1,6-bisphosphate aldolase.. ... 80
Figure 4.5. Relative ATP quantification in B. subtilis cell cultures. The bars represent the relative luminescence units (RLU) and are means of data obtained from at least three independent experiments each conducted in triplicate. Cell number was normalized previous to assay. Error bars represent the standard deviation. Unpaired two-tailed t test and GraphPad Prism version 5.00 for Windows (GraphPad Software) was used for statistical analysis. ... 81
Figure 4.6. Recovery of growth of B. subtilis araR-null mutant strains in complex medium. Black arrow indicates time of arabinose or ribitol addition to an early exponential growing culture of B. subtilis. Strains IQB215 (ΔaraR::km) and IQB 876 (ΔaraR::km ΔmgsA) were tested to ascertain recovery from growth arrest upon arabinose or ribitol addition. ... 83
Table 2.1. List of plasmids used in this study... 31 Table 2.2. List of oligonucleotides (Primers) used in this study ... 31 Table 2.3. List of strains used in this study. Arrows indicate transformation and point from donor DNA to recipient strain ... 32
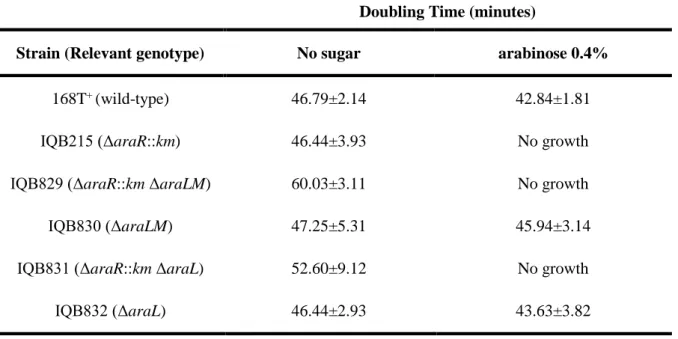
Table 2.4 Effect of distinct mutations in the growth kinetics of B. subtilis strains in the presence and absence of arabinose. Doubling times (minutes) for different strains in liquid minimal medium (C) supplemented with casein hydrolysate in the presence or absence of arabinose. Results are the averages of three independent assays and their respective standard deviations. ... 33
Table 2.5. Growth kinetics of distinct B. subtilis strains harboring ectopic expression of araL,
araM, and araLM. Doubling times (minutes) for different strains in liquid minimal medium (C)
supplemented with casein hydrolysate and IPTG in the presence and absence of arabinose. Results are the averages of three independent assays and their respective standard deviations. ... 36
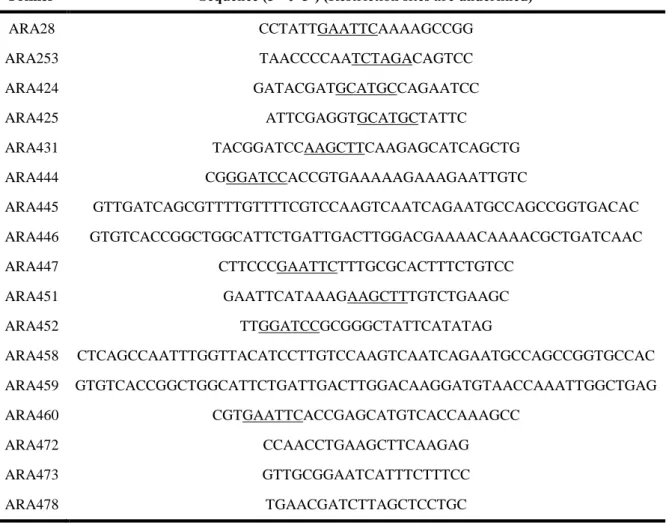
Table 3.1. List of plasmids used in this study... 48 Table 3.2. List of oligonucleotides (Primers) used in this study. Restriction sites are underlined, as are single-nucleotide point mutations ... 49
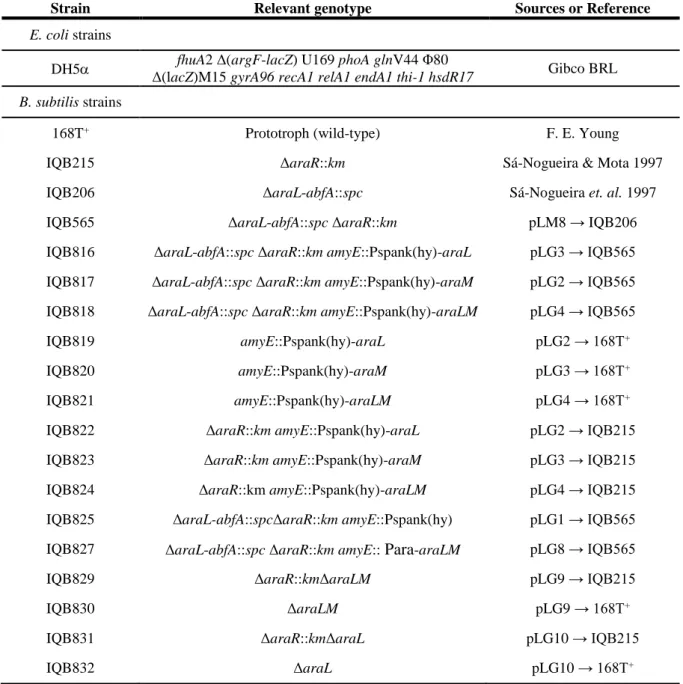
Table 3.3. List of strains used in this study. Arrows indicate transformation and point from donor DNA to recipient strain . ... 50
Table 3.4. Kinetic constants form AraL against various substrates. Assays were performed at pH 7 and 37 °C as described in experimental procedures. The results are the mean value and standard deviation of triplicates. The following substrates were also tested, but no activity was detected: ATP, ADP, AMP, ribose-5-phosphate, glycerol-3-phosphate, pyridoxal-5-phosphate and thiamine monophosphate. ... 57
Table 4.1. List of plasmids used in this study... 70 Table 4.2. List of oligonucleotides (Primers) used in this study. Restriction sites are underlined .. 71 Table 4.3. List of strains used in this study. Arrows indicate transformation and point from donor DNA to recipient strain ... 72
were grown in C minimal medium supplemented with casein hydrolysate in the presence of arabinose or ribitol and in the absence of sugar. Results are the averages of three independent assays and their respective standard deviations. ... 74
Table 4.5. Measurement of araB mRNA levels in different B. subtilis strains by qRT-PCR. The results represent the fold-change of the expression in the target conditions versus the control conditions. Cells were grown in minimal C medium supplemented with 1% (w/v) of casein hydrolysate in the presence (+) and absence (-) of arabinose. Statistical analyses were performed with GraphPad Prism version 5.00 for Windows (GraphPad Software) using Ct values obtained from three independent assays. p values were determined using an unpaired two-tailed t test (ns, non-significant difference; *, p < 0.05; **, p < 0.01; ***, p < 0.001). ... 75
Chapter I
Bacillus subtilis: a Gram-positive model organism
Identified in the early 19th century by German naturalist Christian Gottfried Ehrenberg and
rediscovered in 1872 by Ferdinand Cohn (Skerman et al., 1989), Bacillus subtilis rose to prominence after the description of the wild (non-domesticated) B. subtilis Marburg strain in 1930, and subsequent isolation of X-ray induced mutants of a domesticated strain, related to B. subtilis Marburg, in the late 1940’s (Burkholder & Giles, 1947; Conn, 1930; Zeigler et al., 2008). Domestication of several of those mutagenized strains and their adaptation to laboratory life allowed researchers, in the early stages of genetic engineering studies, to use them to study the development of a competent state for exogenous naked-DNA uptake (Anagnostopoulos & Spizizen, 1960; Spizizen, 1958) and sporulation. At the dawn of the molecular biology era, B. subtilis amenability for genetic engineering emerged as a powerful tool, turning this mesophilic, rod-shaped Gram-positive endospore-forming bacterium in one of the most studied microorganisms in the scientific community, along with its Gram-negative counterpart, Escherichia coli, and the eukaryotic microorganism Saccharomyces cerevisiae. Development of competence, production and secretion of hydrolytic enzymes, non-pathogenicity and endospore formation were driving forces in the study of biochemistry, genetics and physiology of B. subtilis, bringing this bacterium into the spotlight of academic research, being used for the development of recombinant DNA techniques, such as cell transformation or construction of cloning vectors (integrational, replicative and shuttle vectors) some of which were used to maximize expression of native and heterologous proteins (Harwood, 1992). Furthermore, B. subtilis was among the first microorganisms to have its genome fully sequenced by a consortium in 1997 (Kunst et al., 1997).
B. subtilis and other Bacillus species left the exclusivity of wet labs in academia and entered the industrial setting (Harwood, 1992), which took advantage of their genetic manipulation amenability, coupled with their secretion capacity, remarkable fermentation properties, high product yields (van Dijl & Hecker, 2013; Westers et al., 2004) and interesting properties of their spore (Cutting, 2011; Hong et al., 2005). Considered a GRAS organism by the FDA or QPS by the European Commission (McNeil et al., 2013), Bacillus species, such as B. subtilis, B. amyloliquefaciens, B. licheniformis, B. thuringiensis are used for the production of industrial enzymes (e.g. proteases, α-amylases, restriction enzymes), which are often improved by protein engineering, fine biochemicals (hypoxantine, riboflavin), antibiotics (bacilysin, subtilin) and insecticides.
As of 2004, over 60% of all commercially available enzymes originated from Bacillus species (Westers et al., 2004). Commercial proteases from Bacillus are usually alkaline or neutral (Rao et al., 1998; Schallmey et al., 2004) , turning them suitable for use in food and detergent industry. Detergent proteases commonly found in household detergents are subtilisins, Bacillus spp. serine proteases.
Another type of enzymes of industrial interest are B. subtilis hemicellulases, namely for biotechnological purposes focused on cellulose hydrolysis from lignocellulosic substrates, which have potential as renewable energy source for bioethanol production (Araújo & Ward, 1990; Várnai et al., 2011). Ethanol-producing processes require release of cellulose and hemicellulose from their complex with lignin, depolymerization of cellulose and hemicellulose to obtain free sugars, and fermentation of mixed hexose and pentose sugars to produce ethanol (Lee, 1997). B. subtilis hemicellulases, such as mannanases and galactanases can be used to synergistically breakdown lignin (Araújo & Ward, 1990) and its arabinofuranosidases degrade hemicellulosic homopolysaccharides (branched and debranched arabinans) and heteropolysaccharides (arabinoxylans, arabinogalactans). The release of monosaccharides such as arabinose, xylose and galactose, is accomplished together with β-xylosidases and β-galactosidases (Inácio et al., 2008; Shallom & Shoham, 2003). Improvement of lignocellulose conversion to ethanol via metabolic and evolutionary engineering techniques can bypass the scarcity of microorganisms that can efficiently convert hexoses and pentoses to ethanol, although efficient sugar utilization coupled with high yield ethanol production is yet be achieved (Wiedemann & Boles, 2008). For example, the studies of Boles and co-workers attempt at enhancement of an efficient biomass-to-ethanol fermentation process using metabolic engineering of a high-yield biomass-to-ethanol producer S. cerevisiae. The substrate utilization range of the yeast was increased by establishing an L-arabinose utilization pathway from bacteria, namely B. subtilis (Becker & Boles, 2003; Subtil & Boles, 2011; Wiedemann & Boles, 2008). The genetic and physiological characteristics of Bacillus species and especially B. subtilis allowed it to be widely used in basic and applied research as a model organism for Gram-positive bacteria, as well as an industrial workhorse for over 60 years.
Carbohydrate metabolism of Bacillus subtilis in its natural habitat
Bacillus subtilis natural habitat. Gut or soil?
In order to delve into B. subtilis carbohydrate utilization, we first must establish the bacterium’s natural habitat. This Gram-positive endospore-forming microorganism can be found either in terrestrial or in aquatic environments, and its spores have been isolated from the gastrointestinal tract of several animals, including humans (Hong et al., 2009; Tam et al., 2006). B. subtilis has been historically classified as a soil saprophyte involved in the common effort of degrading plant biomass, with the soil as primary reservoir, entering the gastrointestinal tract of animals by ingestion whilst associated to vegetal biomass. Recent work, however, has been evidencing its role not as a transient passenger of the gastrointestinal tract but as having adapted to carry out their entire life cycle, i.e. germinate and sporulate, within this environment (Tam et al., 2006). As such, an intricate network of metabolic routes for biosynthesis of the building blocks of proteins, nucleic acids, lipids and carbohydrates, as well as different forms catabolism of various compounds to fuel cellular processes, emerged.
Whether in the gastrointestinal tract of animals or in the soil, B. subtilis is an active participant in plant cell wall degradation, possessing several intra and extracellular enzymes able to break down complex sugar molecules (i.e. pectin, cellulose, and hemicellulose). The genome encodes numerous genes involved in pathways for the utilization of plant-derived molecules (Barbe et al., 2009; Earl et al., 2008; Kunst et al., 1997), and it secretes a vast number of polysaccharide-backbone-degrading enzymes, which yield oligosaccharides. The complete breakdown of these oligosaccharides is carried out by cell-associated or intracellular enzymes.
B. subtilis often encounters a mixture of different and transient carbon sources that can potentially be used. Mechanisms have evolved, enabling selective uptake and metabolism of carbon sources that allow rapid growth and yield best success whilst competing with other microorganisms for survival.
Central Carbon Metabolism in Bacillus subtilis
Glycolysis, or the Embden-Meyerhof-Parnas Pathway
The three major metabolic pathways for carbon oxidation in B. subtilis are glycolysis, the pentose phosphate pathway and the tricarboxylic acid cycle. Like most heterotrophic bacteria, B. subtilis preferred carbon source is glucose, which is metabolized via glycolysis. Glycolysis is defined as a sequence of reactions that metabolize one molecule of glucose to two molecules of pyruvate, producing two adenosine triphosphate (ATP) molecules along the way (Berg et al., 2011).
In eukaryotes, glucose catabolism occurs through the Embden-Meyerhof-Parnas pathway (EMP), in order to oxidize glucose to pyruvate with the concomitant production of oxidized nicotinamide adenine dinucleotide (NADH). The majority of prokaryotes have similar mechanisms to oxidize glucose, although, due to microbial diversity, some of them metabolize glucose through unique pathways found only in Bacteria, like the Entner-Doudoroff (ED) pathway, found in Zymomonas mobilis and phosphoketolase (PK) pathway, found in lactic acid bacteria like Lactobacillus spp. or Bifidobacterium spp. (Kim & Gadd, 2008; Wolfe, 2015). Archaeal glycolysis presents major variations mainly in its upper branch, concerning the steps from glucose to 3-phosphoglycerate. Modified EMP and ED pathways are quite common in Archaea (Kim & Gadd, 2008; Verhees et al., 2003).
B. subtilis presents the most common glycolytic route, the EMP pathway, where glucose is catabolized to pyruvate (reviewed in Deutscher et. al. 2002) . EMP starts with the phosphorylation of glucose, followed by the isomerization to fructose 6-phosphate and a second phosphorylation (to fructose 1,6-bisphosphate - FBP), the aldol cleavage of FBP and phosphorylation of glyceraldehyde 3-phosphate (GA3P), further converted into pyruvate (Figure 1.1).
Figure 1.1.Embden–Meyerhof–Parnas pathway (EMP). Schematization of the conversion of glucose into pyruvate. Here represented are the two branches of glycolysis: Stage I, where 6C glucose is metabolized to triose phosphates (3C) and Stage II, where ATP and NADH are formed. Single-head arrows indicate irreversible enzymatic reactions and double-head arrows represent reversible enzymatic reactions.
Usually in the literature glycolysis is divided in two parts: the upper branch where glucose (6C) is converted to triose phosphates (3C), and where energy is consumed i.e. using ATP to energize the sugars, and the lower branch where there is a gain in energy through formation of reduction equivalents i.e. NADH (Commichau et al., 2009).
In B. subtilis glucose enters the cell via group translocation, through the glucose-specific phosphotransferase system (PTS), which, in turn, is encoded by the ptsGHI operon. The phosphate donor in this transport system is phosphoenolpyruvate (PEP), a glycolytic intermediate and sugar translocation occurs via two PTS enzymes, enzyme I (EI) and a histidine-containing phosphocarrier protein (HPr), enzyme II (EII), the latter being sugar-specific (Stülke et al., 1997). Glucose can also be phosphorylated to glucose 6-phosphate (G6P) by the cell glucokinase, GlcK, as unphosphorylated glucose may accumulate in the cytoplasm, resulting from disaccharide hydrolysis.
The following steps in EMP are the isomerization of G6P to fructose 6-phosphate (F6P) (reversible reaction) and the phosphorylation of F6P to FBP, which is the first non-reversible step in the pathway. The enzyme catalyzing this reaction is phosphofructokinase (Pfk), which is the most important control element in the glycolytic pathway, phosphorylating F6P at a second site irreversibly. This allosteric enzyme is inhibited by ATP and F6P, thus regulating the glycolytic flux (Berg et al., 2011; Byrnes et al., 1994).
The aldol cleavage of FBP by fructose-1,6-bisphosphate aldolase yields two triose phosphate molecules, dihydroxyacetone phosphate (DHAP) and GA3P. This cleavage is reversible, as this enzyme is also active during gluconeogenesis, when B. subtilis is using less preferred carbon sources such as malate or succinate. Because various degradation pathways feed into glycolysis at many different points, glycolysis or portions of it run in the forward or reverse direction, depending on the carbon source being utilized, in order to satisfy the cell need for precursor metabolites and energy.
The interconversion of DHAP together with the synthesis of phosphoenolpyruvate (lower branch of glycolysis) plays a central role in the metabolic network not only because it yields ATP, but also because it generates reducing power and important metabolic precursors for carbohydrate catabolism, linking metabolites from the upper branch of glycolysis and from the pentose phosphate pathway to the tricarboxylic acid cycle (Krebs cycle), namely G6P, Ribose 5-Phosphate (R5P) and Glycerol 3-Phosphate (glycerol-3P) (Doan & Aymerich, 2003).
Pentose Phosphate Pathway
The Pentose Phosphate Pathway (PPP) is another of the major metabolic pathways for carbon oxidation in Bacteria, and specifically in B. subtilis. The Pentose Phosphate Pathway becomes important as an entry point for several pentoses commonly found in nature, like xylose, arabinose or ribose. This
pathway is also comprised by two phases: oxidative generation of reduced nicotinamide adenine dinucleotide phosphate (NADPH) and non-oxidative interconversion of sugars.
The first phase, oxidative PPP is a major source of reductant (namely NADPH) for biosynthetic processes, such as fatty-acid synthesis and the assimilation of inorganic nitrogen, maintaining the redox potential necessary to protect against oxidative stress by oxidizing G6P to R5P. In this phase, the three steps necessary for the conversion of G6P to R5P are irreversible. R5P and its derivatives are the source of carbon skeletons for the synthesis of major cell components, like DNA and proteins, through synthesis of nucleotides, aromatic amino acids, phenylpropanoids and others (Berg et al., 2011; Kim & Gadd, 2008; Moat et al., 2002).
The second phase of PPP is a non-oxidative phase (Figure 1.2) comprising reversible reactions, which interconverts phosphorylated sugars. Combination of two C5 sugars, glycolytic intermediates that can be readily used in glycolysis or gluconeogenesis, depending on the cell metabolic state.
Figure 1.2. Non-oxidative reactions of the Pentose Phosphate Pathway (PPP). Single-head arrows indicate irreversible enzymatic reactions and double-head arrows represent reversible enzymatic reactions. Most of the reactions are reversible, meaning that the rearrangement of several sugar phosphates in the non-oxidative phase of the PPP allows intermediaries to be used for catabolism (F6P, DHAP, GA3P) and ATP production or to generate riboses from glycolytic intermediates for biosynthesis (R5P, E4P).
The transketolase accepts a 2C fragment from a 5C ketose (xylulose 5-phosphate, X5P) and then transfers this fragment to a 5C aldose (R5P), forming a 7C ketose (sedoheptulose 7-phosphate, S7P). Abstraction of 2 carbons from X5P yields a 3C-aldose, GA3P. Both molecules (S7P and GA3P) are then combined by transaldolase, yielding erythrose 4-phosphate (E4P) and F6P. E4P enters the chorismate biosynthesis pathway, which ultimately leads to aromatic amino acid formation (Light et al., 2012). GA3P and F6P are phosphorylated sugars that can enter the lower part of glycolysis. PPP can either feed riboses into glycolysis for catabolism and ATP production or generate riboses from glycolytic intermediates for biosynthesis.
Tricarboxylic Acid Cycle
Under aerobic conditions, pyruvate resulting from glycolysis is converted into acetyl-CoA, which readily enters the Tricarboxylic Acid Cycle (TCA) (Figure 1.3), where ATP is generated and several building blocks for biosynthesis originate from. An example is α-ketoglutarate for glutamate synthesis or oxaloacetate, which can be converted to amino acids similar to aspartate (Bartholomae et al., 2014). The oxidative decarboxylation of pyruvate (and other acetyl groups from different sources, such as succinate, fumarate or malate) to form acetyl-CoA is the link between glycolysis and the TCA; this irreversible channeling of the product of glycolysis into the TCA is catalyzed by the pyruvate dehydrogenase complex, encompassing a series of redox reactions that result in the oxidation of two molecules of acetyl-CoA to two molecules of CO2 (Berg et al., 2011; Cohen, 2011; Kim & Gadd, 2008).
In summary, the TCA cycle starts with the irreversible oxidative decarboxylation of pyruvate to acetyl-CoA by the pyruvate dehydrogenase complex concomitant with NAD+, NADP+ and flavin
adenine dinucleotide (FAD) reduction (Commichau et al., 2009).
Citrate synthase (encoded by citZ) irreversibly condenses acetyl-CoA with oxaloacetate, yielding a 6C tricarboxylic acid (citric acid), which aconitase (citB) isomerizes to isocitrate. Isocitrate is oxidatively decarboxylated by isocitrate dehydrogenase (icd), which occurs simultaneously with the reduction of NADP+ and the release of CO
2. The resulting five-carbon compound (α-ketoglutarate) is
also oxidatively decarboxylated by enzymes of the α-ketoglutarate dehydrogenase complex (odhA and odhB) to yield a four-carbon thioester compound (succinyl-CoA). Succinyl-CoA synthetase (sucC) couples the cleavage of the high-energy succinyl-CoA into succinate to the synthesis of ATP from ADP + Pi. In order to complete the cycle, succinate must be converted to oxaloacetate, which is accomplished by the three following reactions: dehydrogenation of succinate to fumarate by succinate dehydrogenase complex (sdhABC), one of which is a FAD-containing subunit, meaning FAD is reduced to FADH2
of the cycle, regeneration of oxaloacetate from malate by malate dehydrogenase (mdh) and reduction of NAD+ to NADH (Bartholomae et al., 2014).
Carbohydrate Uptake and Global Regulation of Carbohydrate Utilization
Sugar uptake is mediated by facilitator molecules, primary and secondary active transporters, and the PTS system (Postma et al., 1993; Saier et al., 2002; Simoni et al., 1967).
Molecules like glucose or fructose, among others, are transported via a PTS system, a protein complex comprising the general proteins enzyme I (EI), the intermediate phosphoryl donor protein HPr and the substrate-specific complex protein enzyme II (EII). This complex translocates and simultaneously phosphorylates the substrate (reviewed in Stülke & Hillen 2000; Deutscher et. al. 2002).
Other sugar molecules are transported by ATP-binding cassette (ABC) transport systems. Their organization comprises two hydrophobic transmembrane domains (TMDs) coupled to two cytosolic nucleotide-binding domains (NBDs), or ATP-binding cassettes, responsible for ATP binding and hydrolysis-driven conformational changes for substrate translocation. The majority of NBDs is encoded in close proximity to their partner TMDs, although there are exceptions (Ferreira & Sá-Nogueira, 2010; Figure 1.3. Tricaboxylic Acid Cycle. Also known as the Krebs cycle, this pathway yields ATP, reducing power and biosynthetic intermediaries, such as α-oxoglutarate, a precursor for glutamate and derivatives, oxaloacetate, a precursor of aspartate and succinyl-CoA. Relevant enzymes and enzymatic complexes are shown in bold, while genes encoding for those enzymes are italicized in grey. OGDC stands for oxoglutarate dehydrogenase complex and SDHC stands for succinate dehydrogenase complex.
Quentin et al., 1999). A functional ABC system associates itself to a solute binding protein (SBP), responsible for substrate recognition and internalization (Higgins, 2001; Quentin et al., 1999). For example, oligosaccharides up to four L-arabinosyl units, such as α-1,5-arabinotetraose, resulting from arabinan degradation, are transported by the ABC-type importer AraNPQ (Ferreira & Sá-Nogueira, 2010).
Some molecules are translocated into the cell via a permease, like arabinose, transported by AraE (Krispin & Allmansberger, 1998a; Sá-Nogueira & Ramos, 1997), myo-inositol transported by IolT and IolF (major and minor transporter) (Morinaga et al., 2010; Yoshida et al., 2002) or gluconate, transported by GntP (Fujita & Fujita, 1989; Reizer et al., 1991). So far, glycerol is the only carbohydrate known to enter the cell via the aquaporin-like carbohydrate facilitator, GlpF (Beijer et al., 1993) (reviewed in Deutscher et. al. 2002).
Control of central carbon metabolism in bacteria has several control levels to regulate the use of carbon sources using global regulators. Some of these global regulators are also integrated into a larger regulatory network by which B. subtilis coordinates the metabolic flow through important metabolic intersections, namely carbon and nitrogen metabolism, in response to few signaling metabolites (reviewed in Sonenshein 2007). An example of such regulatory network is the carbon catabolite regulation.
B. subtilis thrives in many carbon sources, and as permanent expression of all transporters would consume valuable cellular resources and occupy limited membrane space, cells selectively express transport systems on the basis of extracellular and intracellular signals. The regulatory mechanism by which cells coordinate the metabolism of carbon and energy sources to maximize its efficiency is referred to as carbon catabolite control or regulation (CCR) (reviewed in Fujita 2009). Bacteria in general, and B. subtilis in particular, can preferentially use the carbon sources that are most easily accessible and allow fastest growth, which results in diauxic growth – immediate consumption of the most favored carbon source (i.e. glucose, hence the name glucose repression being usually interchanged with carbon catabolite repression) and only after its exhaustion the other carbon sources present in the medium will be used. CCR is defined as a regulatory phenomenon by which the expression genes encoding enzymes necessary for the use of secondary carbon sources are reduced in the presence of a preferred carbon source (Görke & Stülke, 2008; Singh et al., 2008)
Carbon catabolite repression has been extensively studied in model organisms like E. coli and B. subtilis: although the outcome is similar, the mechanisms underlying CCR are quite different.
In E. coli, glucose is transported into the cell via a PTS system. Upon substrate translocation, Enzyme I (EI) is autophosphorylated and the phosphate group of phosphoenolpyruvate is sequentially transferred to the His15 residue in HPr. HPr then donates the phosphoryl group to a histidine residue in
the A domains of the various substrate-specific transporters or Enzyme II (EIIs). Finally, the phosphoryl group is transferred to a residue in the EIIB domain and from there to glucose during its uptake through the membrane domain. Because there is glucose in the medium, the concentration of phosphorylated EIIA decreases and it cannot activate membrane-bound enzyme adenylate cyclase. Low intracellular cyclic adenosine monophosphate (cAMP) concentration does not trigger the formation of a complex between cAMP and cAMP receptor protein (CRP), which is necessary for promoter activation of catabolic genes. RNA polymerase binding to the promoters subjected to CCR and formation of the open transcription complex required for transcription only occurs at the promoters if they are previously activated (reviewed in Deutscher et. al. 2006; Görke & Stülke 2008). In the absence of glucose, EII-P stimulates adenylate cyclase activity, increasing [cAMP] in the cell, which bind to CRP, thus activating promoters from catabolic operons responsible for the use of less favored carbon sources.
Carbon catabolite control in B. subtilis differs from the one used in E. coli, despite having the same outcome. Global regulation of carbon catabolite control occurs when the catabolite control protein A (CcpA) and histidine-containing phosphocarrier protein (HPr) phosphorylated at Ser46 (HPr-Ser46-P) complex bind to sequences known as catabolite responsive elements (cre), present in approximately 300 target operons (Fujita 2009 and references there in). B. subtilis HPr can be phosphorylated at two sites: the PEP-dependent phosphorylation of a histidine residue at position 15 (HPr-His15-P), which serves sugar translocation purposes, and the ATP-dependent phosphorylation of a serine at position 46 (HPr-Ser46-P), which serves regulatory purposes. Presence of glucose results in HPr-His15-P. A consequent increase in glycolytic metabolites from glucose metabolization, especially FBP, in the cell stimulates the ATP-dependent HPr kinase/phosphatase-catalyzed phosphorylation of HPr at serine 46 (Reizer et al., 1998) (reviewed in Stülke & Hillen 2000; Deutscher et. al. 2002; Deutscher et. al. 2006; Fujita 2009). HPr-Ser46-P is able to form a complex with CcpA, binding to cre sites (Schumacher et al., 2007) (Figure 1.4).In B. subtilis roughly 10% of the genome is under the control of CcpA mediated regulation, and the majority of those genes are repressed by CcpA (Blencke et al., 2003; Moreno et al., 2001). If the cre sites are located upstream of the -35 region, global regulation is achieved through activation of the promoters by interaction with RNA polymerase, thus originating carbon catabolite activation (CCA). Contrastingly, if the cre sites are located in the promoter region, binding of CcpA causes transcription repression, preventing RNA polymerase binding to the promoter, which results in carbon catabolite repression.
Similarly, if the cre site is located downstream of the transcription initiation site, CcpA binding causes transcription roadblock, prompting RNA polymerase release from DNA. The presence of two cre elements in an operon, synergistically contributing for CCR is not uncommon in B. subtilis – one of the elements prevents RNA polymerase binding whilst the other engages in a roadblocking mechanism – and can be found in the gnt (Miwa et al., 1997), iol (Miwa & Fujita, 2001) and ara operons (Inácio et al., 2003).
Global carbon catabolite control is also hierarchically achieved with substrates other than glucose, or non-PTS sugars. In B. subtilis, glycerol, fructose and mannitol also cause catabolite repression, as well as sucrose. Sugars like ribose or arabinose also contribute to CCR, although to a very little extent (Singh et al., 2008). This phenomenon is not exclusive to B. subtilis and has been described in Clostridium acetobutylicum (Aristilde et al., 2015) and in E. coli (Bettenbrock et al., 2007).
Figure 1.4. Carbon Catabolite Regulation in Bacillus subtilis.Uptake of a PTS-sugar (eg. glucose) leads to an increase in the intracellular [FBP], triggering ATP-dependent HPr kinase/phosphatase-catalyzed phosphorylation of HPr and Crh at Ser46. Only the Ser46-P forms of HPr and Crh bind to CcpA. The HPr-Ser46-P /CcpA and Crh-Ser46-P /CcpA complexes can bind to the catabolite responsive elements, cre, to cause Carbon Catabolite Repression or Carbon Catabolite Activation, depending on the position of the cre. Adapted from Deutscher et al. 2002 and Fujita 2009.
CCR is also achieved in a CcpA-independent manner: catabolite control can be mediated by CcpB, a homolog protein of CcpA (Chauvaux et al., 1998), CcpC, CcpN, or CggR (reviewed in Fujita, 2009). CcpC is known to be involved in TCA genes regulation, such as aconitase (citB) activation and repression in response to citrate levels (Mittal et al., 2013), whereas CcpN has been described as an additional mediator of CCR in B. subtilis, acting on genes encoding gluconeogenic enzymes (Tännler et al., 2008). CggR regulates the gapA operon (Ludwig et al., 2001) CodY is also involved in global regulation, namely in the synthesis of leucine and isoleucine (BCAAs), histidine and arginine and transporters for amino acids, peptides and sugars, as well as regulation of transcription of carbon-overflow pathways and guanine nucleotide synthesis (Sonenshein 2007 and references therein).
Another mechanism involved in carbon catabolite regulation is inducer exclusion. In E. coli, for instance, dephosphorylation of enzyme IIAGlc by G6P causes inhibition of uptake of a number of
non-PTS carbon sources, namely lactose, melibiose or glycerol; dephosphorylated EIIGlc can bind to a
number of enzymes involved in the metabolism of non-PTS carbon sources, inhibiting their utilization by the cell (Hogema et al., 1998a, b). In B. subtilis cells metabolizing a PTS sugar, the glycerol kinase, GlpK, is not phosphorylated, causing a slow uptake of glycerol. Insufficient phosphorylation and low GlpK activity towards glycerol was hypothesized as the basis for the CcpA-independent CCR mechanism of inducer exclusion (Darbon et al., 2002).
Additionally, B. subtilis and other Bacilli encode a paralogue of HPr, catabolite repression HPr protein (Crh), which bears over 40% sequence identity to HPr. Crh lacks the His15 site, but is phosphorylated at Ser46 (Galinier et al., 1997; Landmann et al., 2011; Singh et al., 2008). Crh is known to repress citM when B. subtilis is grown on succinate and citrate as carbon sources (Warner & Lolkema, 2003) , but it is considered to have a weak contribution to global CCR, mainly due to its much lower levels in the cell and its lower binding affinity for CcpA as compared with HPr(Ser~P) (Görke et al., 2004). In its phosphorylated form, this protein is also known to inhibit glyceraldehyde 3-phosphate dehydrogenase (GapA) activity in vitro (Pompeo et al., 2007), and work by Inácio & De Sá-Nogueira 2007 indicated that Crh might be more important for CCR during the transition to stationary phase. An additional regulatory role for Crh was also proposed, as non-phosphorylated Crh binds to and inhibits activity of the metabolic enzyme methylglyoxal synthase, MgsA, in B. subtilis, initiating a glycolytic bypass (Landmann et al., 2011). Despite not having a strong contribution for CCR, Crh seemingly regulates glycolytic flux through interaction with two metabolic enzymes, MgsA and GapA (Landmann et al., 2012; Pompeo et al., 2007).
Arabinose metabolism in Bacillus subtilis
In nature B. subtilis often encounters a mixture of different and transient carbon sources that can potentially be used. During its permanence either in the gastrointestinal tract of animals or in the soil, contributing to plant biomass degradation, B. subtilis encounters complex polymers comprising