FIRE ANALYSIS OF AN OPEN CAR PARK BUILDING
STRUCTURE
Habbar Ghania
Final report of the thesis presented to the
School of Technology and Management
Polytechnic Institute of Braganҫa
To the fulfilment of the requirements for the master of science degree in
Industrial Engineering
(Mechanical Engineering branch)
Supervisor at IPB: Prof. Dr. Paulo Piloto Supervisor at UHBC: Prof. Dr. Abdallah Benarous
i ACKNOWLEDGEMENT
Initially I would like to thank God, that gave me the opportunity to carry out this outstanding experience, where I grew professionally and personally. Always giving me the strength necessary and accompanying me along the way through the completion of this stage of my studies.
This thesis would not have been possible without the tireless assistance, guidance and motivation provided by the supervisors, Dr. Paulo Alexandre Gonçalves Piloto from the Polytechnic Institute of Bragança (IPB) and Dr. Abdallah Benarous from the University Hassiba Benbouali from Chlef (UHBC). Their patience, encouragement, and on-going support
throughout the whole journey were invaluable to me.
My thanks also to the ERASMUS+ ICM program, for awarding the scholarship that allowed me to conduct these master studies. And to the staff of the International Office of the IPB, for the guidance provided whenever necessary. A special thanks to Pr Mahmoudi Hacene and Pr Habbar abderezak from UHBC.
To all the professors who imparted me lessons and constituted a fundamental part of my higher education and professional formation here at the Polytechnic Institute of Bragança (Portugal) specially: Dra. E. Fonseca, Dr. L Mesquita and Dr.J.Ribeiro, or in Algeria since my primary school until my higher education in University Hassiba Benbouali from Chlef specially: M. Djamel-eddine and Z. Hamou.
To my friends and colleagues, in Algeria and in Portugal, who were always aware of
my progress and kept me motivated to complete this report, especially to “my second family”
for their invaluable support since the first day of our stay in Bragança especially my dear: N.khadouma, A. Soufyane, K. Seddik, and Z. Abdelkader also H. Petra from Czech and H. Mohamed from Tunisia.
I acknowledge the people who mean a lot to me, my parents, Ali and Zohra Zerguerras, for showing faith in me and giving me liberty to choose what I desired. I salute you all for the selfless love, care, pain and sacrifice you did to shape my life. Although you hardly understood what I researched on, you were willing to support any decision I made.
ii
iii RESUMO
O objetivo deste trabalho é determinar o comportamento térmico de uma estrutura aberta de um parque de estacionamento, usando o evento de incêndio de um carro. A evolução da temperatura de parte do elemento da estrutura também deve ser calculada com o modelo simplificado de EN1991-1-2 (método Heskestad e Hasemi) para determinar o comportamento térmico da estrutura.
O carregamento térmico de uma estrutura mista para estacionamento de carros será analisado, com base em diferentes cenários de incêndio que dependem do número de eventos de incêndio (HRR e tempo). O compartimento vai ser definido e alguns parâmetros devem ser identificados para fazer uma análise paramétrica.
Um método de cálculo avançado (usando a análise FLUENT) será utilizado para determinar curvas temperatura-tempo, com base na análise CFD e no efeito termodinâmico do incêndio localizado.
PALAVRAS CHAVE:
iv
v ABSTRACT
The aim of this work is to determine the thermal behaviour of an open car park building structure, using the fire event of a car. Temperature evolution of part of the element of the structure should also be compared with the simplified model of EN1991-1-2 (Heskestad and Hasemi method) to determine the thermal behaviour of the structure.
The thermal loading of an open car building structure is going to be analysed, based on different fire scenarios that depend on the number of fire events (HRR & time). The compartment is going to be fixed and few parameters should be identified to do a parametric analysis.
An advanced calculation method (using FLUENT analysis) will be used to determine several temperature-time curves, based on the CFD analysis and in the thermal effect of the fluid from the localized fire.
Keywords :
vi
vii INDEX
ACKNOWLEDGEMENT ... i
RESUMO ... iii
ABSTRACT ... v
INDEX ... vii
INDEX OF FIGURES ... xi
INDEX OF TABLES ... xiv
NOMENCLATURE ... xv
1- INTRODUCTION ... 1
1.1- Fire ... 1
1.2- Defining car park fire scenarios ... 3
1.2.1- Car fire tests ... 7
1.2.1.1- Tests of cars in cone calorimeter ... 7
1.3- Open car park fire tests ... 8
1.4- Objective of the thesis ... 10
1.5- Outline of the thesis ... 10
2- FIRES IN OPEN CAR PARKS ... 11
2.1- Historic events ... 11
2.1.1- Schiphol Airport (Netherlands) ... 11
2.1.2- Apartment building Geleen (Netherlands) ... 11
2.1.3- Car park Gretzenbach (Switzerland) ... 12
2.1.4- Apartment building Harbour Edge (Netherlands) ... 12
2.2- Fire requirements in different countries ... 13
2.3- Fire Statistics in open car parks ... 15
2.3.1- Open car park ... 16
3- FIRE EVENTS AND SCENARIOS ... 17
viii
3.2-Fire scenarios ... 19
3.2.1- Fire scenarios in car park ... 19
3.2.2- Parameters with significance in a fire scenario ... 19
3.2.3- Classification of cars ... 20
3.3- Fire compartment ... 22
3.3.1- Definition of fire compartment ... 22
3.3.2- Phases of fires in compartment ... 23
3.4- Localized fires ... 24
3.4.1- Heskestad model ... 24
3.4.2- Hasemi model ... 25
3.4.2.1- The Newton Raphson method ... 27
4- THERMAL ANALYSIS - SIMPLE CALCULATION METHOD ... 29
4.1- Material properties ... 29
4.1.1- Thermal properties of steel ... 29
4.1.2- Thermal properties of concrete ... 30
4.2- Temperature calculation ... 33
4.2.1- Car position ... 33
4.2.2-Cross section ... 33
4.2.3- Steel temperature development ... 34
4.2.3.1- Unprotected internal steelwork ... 34
4.2.2.2- Steel section HEAA 650 ... 35
5- THERMAL ANALYSIS - SIMPLE CALCULATION METHOD (ELEFIR_EN) and ADVANCED CALCULATION METHOD(ANSYS FLUENT) ... 38
5.1- The computer program Elefir-EN ... 38
5.1.1- Available thermal calculations ... 39
5.2- Temperatures of The Beams with Elefir-EN ... 39
5.2.1- HEAA 650 ... 39
ix
5.3.1- Equations to be solved ... 43
5.3.2- The model ... 44
5.3.2.1- HEAA 650 for R=0 m ... 46
5.3.2.2- HEAA 650 for R=2 m ... 52
5.3.2.3- HEB 140 for R=1 m ... 52
5.4- Comparison of results ... 53
6- CONCLUSIONS AND FUTURE DEVELOPMENTS ... 57
REFERENCES ... 58
Annex A : Results from HESKESTAD and HASEMI method ... 62
1- HEB 140 (class 3) ... 62
2- IPEA 600 ... 63
3- IPEA 550 ... 64
4- IPEA 450 ... 65
Annex B : Results from Elefir_EN ... 66
1- HEB 140 ... 67
2- IPE A 600 ... 69
3- IPE A 550 ... 72
4- IPE A 450 ... 75
Annex C : Results from ANSYS FLUENT ... 79
1- HEAA 650 (R=2 m) ... 81
2- HEB 140 (R=0 m) ... 82
3- Boundary conditions used in ANSYS FLUENT ... 85
3.1- Car class 1 ... 85
3.1.1- Surrounding gas temperature ... 85
3.1.2- Surrounding gas velocity ... 86
3.2- Car class 2 ... 86
3.2.1- Surrounding gas temperature ... 86
x
3.3- Car class 3 ... 87
3.3.1- Surrounding gas temperature ... 87
3.3.2- Surrounding gas velocity ... 87
3.4- Car class 4/5 ... 87
3.4.1- Surrounding gas temperature ... 87
xi INDEX OF FIGURES
Figure 1 - Flame example. ... 1
Figure 2 - What fire need [3]. ... 2
Figure 3 - A car on fire [4]. ... 2
Figure 4 - A car park after fire. ... 3
Figure 5 - Fire test in the scaffolding structure – Butcher et al. (1968) [20]. ... 8
Figure 6 - Open car park in Pennsylvania – Gewain (1973 [20]. ... 9
Figure 7 - Open-deck car park – Bennetts et al. (1985) [20]... 9
Figure 8 - Fire in car park of Schiphol airport [24]. ... 11
Figure 9 - The Apartment building Geleen after fire [24]. ... 12
Figure 10 - The Apartment building Geleen after fire [25]. ... 12
Figure 11 - The open car parking of building Harbour Edge after fire [26]. ... 13
Figure 12 - Natural ventilation in open car parks [39]. ... 16
Figure 13 - Application of steel framed for different open car parks [40]. ... 17
Figure 14 - Hate release rate for 5 car classes. ... 18
Figure 15 - the fire plume [27] ... 19
Figure 16 - Classification of cars involved in car fires in underground car park [43]. ... 20
Figure 17 - Fire scenarios in open car park [44]. ... 21
Figure 18 - The lateral view of fire scenario 1. ... 21
Figure 19 - The front view of the fire scenario 1 ... 22
Figure 20 - Phases of fire development [46]. ... 23
Figure 21 - Localised fire model for flames not touching the ceiling (Heskestad) [47]. ... 25
Figure 22 - Localized fire model for flames touching the ceiling (Hasemi). ... 26
Figure 23 - Newton Raphson method. ... 27
Figure 24 - Specific heat of carbon steel as a function of the temperature. ... 29
Figure 25 - Thermal conductivity of carbon steel as a function of the temperature. ... 30
Figure 26 - The density of steel as a function of the temperature. ... 30
Figure 27 - Specific heat of concrete as a function of the temperature [49]. ... 31
Figure 28 - Thermal conductivity of concrete as a function of the temperature [49]. ... 32
Figure 29- the density of concrete according to Eurocode EN 1992-1-2. ... 33
Figure 30 - The car positions. ... 33
Figure 31 - The most important dimensions in a cross section. ... 34
xii
Figure 33 - Flame and steel temperature of different positions from the fire axis. ... 37
Figure 34 - First screen of the Software Elefir_EN... 38
Figure 35 - Flame and steel temperature for car class :1,2,3 and 4/5. ... 39
Figure 36 - Flame and steel temperature for different positions for car class 3. ... 40
Figure 37 - The gas Temperature for car class 3 . ... 41
Figure 38 - The steel temperature for car class 3. ... 41
Figure 39 - ANSYS WORKBENCH running ANSYS FLUENT. ... 42
Figure 40 - The real model of an open car parking. ... 44
Figure 41 - The fluent model of an open car parking. ... 45
Figure 42 - Surrounding gas temperature for all car classes. ... 45
Figure 43 - Velocity for all car classes. ... 46
Figure 44 - The Geometry of the model using HEAA 650 cross section for R=0 m. ... 46
Figure 45 - The final mesh of the model using only edges with hard option for R=0. ... 47
Figure 46 - Defining boundary conditions in FLUENT. ... 47
Figure 47 - Points for getting results from CFD post for temperature of the steel. ... 48
Figure 48 - Points for getting results from CFD post for temperature of the concrete. ... 48
Figure 49 - Temperature [K] in different times using ANSYS FLUENT for R=0 m. ... 49
Figure 50 - Velocity [m/s] in different times for R=0 using ANSYS FLUENT for R=0 m. ... 50
Figure 51 - Steel temperature for car classes. ... 51
Figure 52 - The evolution of Steel temperature in R=0 m for different car class. ... 51
Figure 53 - Temperature of concrete. ... 51
Figure 54 - The Geometry of the model using HEAA 650 cross section for R=2 m. ... 52
Figure 55 - The final mesh of the model using only edges with hard option for R=2 m. ... 52
Figure 56 - The Geometry of the model using HEB 140 cross section for R=1 m. ... 53
Figure 57 - The final mesh of the model using only edges with hard option for R=1 m. ... 53
Figure 58 - Tgas and Tsteel for R=0 m. ... 54
Figure 59 - Tgas and Tsteel for R=1 m. ... 54
Figure 60 - Tgas and Tsteel for R=2 m. ... 54
Figure 61 - Tgas and Tsteel for all cross section for R=0. ... 55
Figure 62 - TSteel comparison for R=0 m. ... 56
Figure 63 - TSteel comparison for R=2 m. ... 56
Figure 64 - Flame and steel temperature of different positions from the fire axis. ... 62
Figure 65 - Flame and steel temperature of different positions from the fire axis. ... 63
xiii
Figure 67 - Flame and steel temperature of different positions from the fire axis. ... 65
Figure 68 - Elefir-EN main menu of mechanical response. ... 66
Figure 69 - Elefir-EN main menu of thermal response. ... 66
Figure 70 - Flame and steel temperature for all car classes. ... 67
Figure 71 - Flame and steel temperature of different radial positions. ... 68
Figure 72 - The gas Temperature for car class 3 . ... 69
Figure 73 - The steel temperature for car class 3 . ... 69
Figure 74 - Flame and steel temperature for all car classes. ... 70
Figure 75 - Flame and steel temperature of different radial positions from the fire axis. ... 71
Figure 76 - The gas Temperature for car class 3 . ... 72
Figure 77 - The steel temperature for car class 3 . ... 72
Figure 78 - Flame and steel temperature for all car classes. ... 73
Figure 79 - Flame and steel temperature of different radial positions from the fire axis. ... 74
Figure 80 - The gas Temperature for car class 3 . ... 75
Figure 81 - The steel temperature for car class 3 . ... 75
Figure 82 - Flame and steel temperature for all car classes. ... 76
Figure 83 - Flame and steel temperature of different radial positions . ... 77
Figure 84 - The gas Temperature for car class 3 . ... 78
Figure 85 - The steel temperature for car class 3 . ... 78
Figure 86 - Starting FLUENT simulation. ... 79
Figure 87 - Uploading of the material properties (thermal and fluid). ... 79
Figure 88 - Thermal properties for the fluid material (Air). ... 80
Figure 89 - Steel temperature for car class 1,2,3 and 4/5. ... 81
Figure 90 - The evolution of Steel temperature in R=2 m for different car class. ... 82
Figure 91 - Steel temperature for different car classes. ... 82
Figure 92 - The evolution of Steel temperature in R=0 for different car class. ... 83
Figure 93 - Concrete temperature for car class 3. ... 83
Figure 94 - Temperature in different times using FLUENT. ... 84
xiv INDEX OF TABLES
Table 1 - Resistance requirements of car parking, according to INERIS [29] ,ECCS [27]. .... 15
Table 2 - The HRR of different car categories. ... 18
Table 3 - Definition of car classes (categories). ... 20
Table 4 - Example of calculation with the solver using the Newton Raphson method. ... 28
Table 5 - Designation and dimension of cross sections. ... 34
Table 6 - Air properties. ... 79
Table 7 - Concrete thermal properties . ... 80
xv NOMENCLATURE
Latin lower case letters
•
h The heat flux [kW/m2].
y Non dimension parameter [-].
a
c
Specific heat of steel [kJ/(kg K)] .
p
c
Specific heat of concrete [kJ/(kg K)].ḣnet Net heat flux[w/m2]
R Radial distance from the fire [m]
t Time [min]
Latin upper case letters
D Diameter of fire source [m]
H Distance between the fire and the ceiling [m]
Hf Vertical distance between the floor and the ceiling [m]
H𝑠 Distance between the fire source of the car and the floor
Lf Flame height [m]
Lh Horizontal flame length
Q ̇ Total heat release rate (HRR) [kW]
Qc Convective part of the rate of heat release [kW], Qc= 0,8 by default
Q∗D Heat release coefficient related to the diameter of the local fire
Q∗H Non-dimensional hate release rate [W]
Tgas Temperature of steel profile [°C].
Z Height along the flame axis [m]
Z0 Virtual origin or height of virtual source above burning item [m]
xvi Greek letters
𝛼𝑐 Coefficient of heat transfer by convection [J/m² K]
𝜀 Emissivity
𝜀𝑓 Emissivity of fire
𝜀𝑚 Surface emissivity of the member
λ Thermal conductivity [kW/(m °C)]
ρ Density [kg/m3]
Greek lower case letters
a
Thermal conductivity of steel [W/(m k)].c
Thermal conductivity of concrete [W/(m k)].𝜃𝑎 Temperature of steel profile [°C].
1 1- INTRODUCTION
Over recent years, there is considerable interest in the research of vehicle fires in car parking building structures due to the important effect that this kind of accidents have in society. Several accidents were reported with regards to car parking structures, in particular open car parks.
1.1- Fire
Fire is rapid, self-sustaining oxidation accompanied by the evolution of varying intensities of heat and light. This definition indicates that fire is a chemical process of decomposition in which the rapid oxidation of a fuel produces heat and light. This process makes fire the mid-range reaction based on the speed at which the two other common forms of oxidation occur [1]. Rust, or corrosion, is an example of the slower form, and explosion is an example of the more rapid form; see Figure 1.
Figure 1 - Flame example.
2
Figure 2 - What fire need [3].
One of the most interesting issues in fire engineering and fire safety is the rapidity of detecting fire using fire detection systems, which operate and depends of the hot gases and smoke. Safety systems need to be able to detect a fire so that any kind of protection system can stop it or alarm people to get out in time. People usually can see smoke and flames, people can smell smoke and can feel heat. Most of the times people need the support from fire brigades for help. When a fire breaks out, people might not be at home, or might be asleep or might not be paying much attention to what is going on around us. Fire detectors have been developed using science knowledge and technology to improve fire protection.
Car fires are usually related to causes associated with fuel, electrical systems, the exhaust system and petroleum based fluids; see Figure 3. By far though, the biggest causes of vehicle fires are fuel related [2].
Figure 3 - A car on fire [4].
3
exploding; and the ever-increasing list of unknown contents that people may find use in the vehicle. There are many variables involved in fighting a car fire in a parking garage, including structure type, access, grade or elevation changes, confined spaces or areas trapping heat and smoke, exposures and fire department response [5], see Figure 4.
Figure 4 - A car park after fire.
1.2- Defining car park fire scenarios
A fire scenario is a generalized, detailed description of an actual or a hypothetical, but credible, fire incident. Such scenarios identify chains of events leading to deaths and other fire losses.
The fire scenario is mainly just a set of fire conditions. The building fire safety design concept is the solution of more or less well defined predefined variables.
Each fire scenario includes all details relevant to the development of a fire and a subsequent behaviour of people and mechanisms of protection. When properly developed, a fire scenario describes all essential element of fire incident. The components which make up the events and conditions of a fire scenario are not fixed. They may include events such as: ignition, fire spread, extinction, evacuation, smouldering or flaming combustion, smoke production, flashover, back-draft, etc [6].
1.3- State of the art
4
parking buildings and different vehicle fire spread scenarios, and he found that on average, there were 12 vehicle fire incidents each year in New Zealand parking buildings. Multiple vehicle fire incidents accounted for approximately 3% of such fires. Arson is found to be the leading cause of vehicle fires in New Zealand parking buildings (26.7% of all fires). It was also concluded that annual vehicle fire frequencies in New Zealand parking buildings are generally lower than those in buildings of other type. Based on available data collected during this research, it was further found that an economically installed automatic sprinkler system does not justify itself in a parking building situation from the building owner's point of view [7].
In 2005, Noordijk and Lemaire made a study focuses on how to model fire spread between cars in a car parking in which fire was triggered by a fire incident at Schiphol Airport (Netherlands) involving 30 cars where it was believed that the fire spread during the incident was much faster than assumed. The study recognized that fire between cars could occur by emission of radiation, heat transfer through air and absorption of the radiation. As a conclusion, driven by uncertainties, the fire spread model was capable of predicting fire spread between cars [8].
In 2007, X.G. Zhang et al. investigated a large-scale car fire in a specially built car park with a four-storey structure with cars situated at corners on each level of the car park. Their
tests mainly tried to investigate the behaviours of car fire and fire spread to adjacent cars and
the effect of car fires on the building structure. The researchers decided to put fifty cars in two rows and each parking space had 6 x 3 m, assuring that the space between two cars is 1.2 m. As required by government regulations, ventilation system should be sufficient to provide at least 6 air changes per hour and that all ventilation fans should normally be run continuously. The numerical simulations of fire development in a large underground car park were carried out using the FDS code. The simulated heat release rate was compared well with experimental data. The effect of ventilation on the fire spread and smoke movement in a large underground car park with 50 cars was simulated [9] .
In 2007, De Feijter and Breunese describe the post behaviour of a severe fire in a multi-story car park constructed partially from precast pre-stressed hollow core concrete slabs, which spanned from a central core to a load bearing precast concrete façade. The structure was severely damaged during the fire and the total structural collapse was a serious concern. Excessive crack formation was observed in the hollow core slabs, including horizontal cracks
5
several centimetres was widespread in both the slab soffit and the concrete façade elements, exposing steel reinforcement in many places. Researchers concluded that thermal cracking took place in all concrete elements that were exposed to fire. It is clear based on the above that it is essential for structures to be considered not as separate parts, but rather as a connected whole [10].
6
to many cars within a specific proximity in an actual car park must be expected under these conditions [11].
In 2010, the Building Research Establishment (BRE) made a project that aimed to gather information on the nature of fires involving the current design of cars and to use this new knowledge as a basis for updating current guidance used in the United Kingdom on fire safety strategies for car park buildings. The project was commissioned by Communities and Local Government Sustainable Buildings Division to carry out a three year project titled Fire Spread in Car Parks. This report was intended to be of value to designers, fire engineers, computer modellers and researchers, involved in the design of car parks and the fire safety provisions that are appropriate. This report includes a world-wide literature review of the related topic of vehicle fires, laboratory tests on car materials, a review of United Kingdom fire statistics, computer modelling of vehicle fires in car park buildings, and a series of eleven full-scale fire tests that included burning a total of sixteen cars [12].
In 2010, Van Der Heijden made a research in open car park. The objective of the research was to know in what extent is there a risk in the safe deployment of the fire brigade during a car fire in a semi-open car park. Researchers began by doing literature reviews of car fires and car park building codes around the world. Then, they looked at general car park dimensions in the Netherlands, the influence of wind in semi-open car parks. The distribution and location of the opening area of the car park building have significant influence on the fire safety level, and the effect of different locations for structural beams. The fire safety levels of semi-open car parking buildings were assessed using Computational Fluid Dynamics (CFD) simulations. The study concludes that the effect of the presence of wind does not make much difference as compared to the same situation without the presence of wind. It was also concluded that from this study, that it is possible to design a semi-open car parking building that complies with current existing Dutch guidelines [13].
7
ventilation in above-ground car parks remain satisfactory. However, for closed underground car parks and/or car parks that may include stacking systems, the performance of structural steel members may be an issue [14].
1.2.1- Car fire tests
Car fires have been experimentally studied in several countries in the world.
In 1995 Shipp and Spearpoint developed two full-scale calorimetric fire experiments on passenger to obtain information on the consequences of a car fire in a shuttle train in the Channel Tunnel between England and France [15].
In 2000 Stroup et al. made ten full-scale car fire tests at MFPA in Germany. Cars ranging from one to three in each test were put in a closed compartment for measurements. The measurements for each test included temperatures, gas concentrations, heat fluxes, mass loss rate and RHR [16].
In 2001 Stroup et al. made two fire tests in a 1995 with a passenger minivan with some exterior damage. The experiment was conducted under a hood calorimeter at NIST (National Institute of Standards and Technology) in the US [17].
1.2.1.1- Tests of cars in cone calorimeter
Two sources in the literature have reported the results of cone calorimeter tests conducted on component materials found on the exterior of vehicles and these are presented here.
The Motor Vehicle Fire Research Institute (MVFRI) conducted cone calorimeter tests on selected automotive parts used in vehicles. The main objective of the work was to assess possible means for determining the individual flammability characteristics of automotive components, obtain data on the range of flammability behaviour of each component and obtain insights into the fire behaviour observed in related full - scale vehicle fire experiments. However, most of the cone calorimeter test results reported were for the interior components of a vehicle and the only exterior component which is considered appropriate for this analysis is the ''windshield'' which was made of polyvinyl butyral (PVB) [18].
8
determine the likely contribution to fire spread in vehicle fire scenarios. The burning characteristics were identified by determining the critical heat flux for ignition with a pilot source and their heat release rate in accordance with ISO 5660:2002 [19]. Eleven samples from a list of potential components which are likely to burn were chosen for the tests based on their location on a vehicle. The eleven components tested were hubcap, mud flap, rubber tyre, bumper trim, bumper, bumper grill, wheel arch, fuel tank, roof box, mohair soft top, and PVC soft top [12].
1.3- Open car park fire tests
In 1968 Butcher made three car fire tests in a specially built steel scaffolding structure with an insulated ceiling approximately 2.1 m above the floor. During the two firsts tests, the two ends of the structure were left opened. Nine cars in a three by three array were arranged
with parallel spacing’s ranging from 0.75 m to 1.2 m.
Figure 5 - Fire test in the scaffolding structure – Butcher et al. (1968) [20].
The central car was ignited, but the fire did not spread to any of the adjacent cars. The maximum measured temperature was 840 ºC in the air, 360 ºC in the steel column, 275 ºC in the steel beam. The main Conclusions were: A fire single parked vehicle is unlikely to cause uncontrollable fire spread within a car park. The damage to the car park building is not critical. The wood equivalent fire load density for a car park was found to be 17 kg/ m2[20].
9
Figure 6 - Open car park in Pennsylvania – Gewain (1973 [20].
The main thermal and structural results were: The maximum temperature of the air was 432 ºC (above windscreen, after 11 minutes). The air temperatures for most parts in the building was smaller than 204 °C and the maximum temperature of the steel was 226 ºC. The deflection and elongation of elements was null after cooling.
The main conclusions were: The fire did not spread to any of the adjacent cars during the 50 minutes of test. There is a low fire hazard in an open air parking structure. The steel provide adequate safety against the structural collapse under a car fire. This test confirmed results of Butcher et al. (1968). The wood equivalent fire load density for a car park was found to be 9.8 kg/ m2 [21].
In 1985 Bennetts et al. in Australia developed two fire in the two-level open-deck car park showed in Figure 7, using unprotected steel and concentred loads on the first floor. Five cars were arranged. In the first test the fire did not spread to any of the adjacent vehicles. Maximum temperature in the steel was 285 ºC. For the second test, 3 cars were involved. The fire spread from the first car ignited to two neighbouring cars at 14 and 35 minutes. The maximum temperatures were: 340 ºC in a beam and 320 ºC in a column.
10
The main conclusions were: The probability to involve more than 2 cars is very small (fire brigades arrive before); The safety was assured with unprotected steel.
1.4- Objective of the thesis
The main objective of the thesis is to find the thermal effect of the structure from a localized fire from a car. Different models were used to determine the temperature of the structure and a comparison is made between them.
1.5- Outline of the thesis
The thesis contains 6 chapters divided with the following information.
Chapter 1 presents the state of the art, an overview of the unprotected steel in open car park under fire (car fire tests and cone calorimeter tests.). This chapter also includes an introduction about fire modelling and fire events.
Chapter 2 provides a general idea about some fire events in open car park buildings around the world and the fire requirements in different European countries under localised fire. Fire statics in open car park is also presented.
Chapter 3 discusses fire events and Heat release rate HRR of cars. Also includes the information about fire compartment and presents the method (Heskestad and Hasemi) usually used to define the effect of the fire in specific parts of the structure.
Chapter 4 describes the simple calculation method, and temperature calculation using a mix of Heskestad and Hasemi method during the fire event. A parametric analysis is also presented.
Chapter 5 is dedicated to the numerical simulation using ANSYS FLUENT and the ELEFIR_EN software. A brief definition of both will be presented followed by a discussion of the results about the temperature of the gas and the temperature of the steel. The velocity is also analysed, taking in consideration different car classes, different radial position, and different section factors for secondary beams.
11 2- FIRES IN OPEN CAR PARKS
2.1- Historic events
A short list is given of reported damages in real car park fire accidents that occurred mostly in the Netherlands and Switzerland during the period 2002–2007 [22].
2.1.1- Schiphol Airport (Netherlands)
On October 13, 2002, a fire occurred in an aboveground car park for rental cars at Schiphol Airport. Approximately 51 cars were burned, due to which a partial collapse of the structure occurred, see Figure 8. The structure consisted of massive pre-tensioned concrete slabs which were supported by concrete T-girders. It was a very large fire, because the car park was fully booked, with only 40 cm spacing between the cars. Furthermore, the cars were relatively new (with high amounts of synthetic materials) and had a full fuel tank (as is often the case for rental cars) [22], [23].
Figure 8 - Fire in car park of Schiphol airport [24].
2.1.2- Apartment building Geleen (Netherlands)
12
Figure 9 - The Apartment building Geleen after fire [24].
2.1.3- Car park Gretzenbach (Switzerland)
A fire took place on November 11, 2004, in a car park in Gretzenbach, see Figure 10. After approximately 90 min, the roof of the underground car park collapsed due to punching effect and 7 firemen died during their intervention. Fire investigation revealed design and execution mistakes resulting in an overload of soil and a decreased of punching shear capacity. Because of a clear punching failure and the typical car park geometry, this example is often used as the basis for the geometry of a case study [22], [23].
Figure 10 - The Apartment building Geleen after fire [25].
2.1.4- Apartment building Harbour Edge (Netherlands)
13
the 5th and the 6th car are somewhat uncertain. Finally, the 7th car, which was separated from the group of 6 by an empty space, was only partially involved in the fire, was not considered to contribute to the fire in terms of HRR in the fire scenario analyses, because it was only partially damaged, not burnt out [23].
Figure 11 - The open car parking of building Harbour Edge after fire [26].
2.2- Fire requirements in different countries
A car park as part of a building can be classified as open or closed depending on the ventilation condition. In accordance with ECCS, it may be considered as "open" if, for every parking level, the ventilation areas in the walls are: i) located in at least two opposite façades, ii) equal at least 1/3 of the total surface area of all the walls and iii) correspond to at least 5% of the floor area of one parking bay [27]. The main advantages of open car parks are: i) lower energy consumption, ii) natural light that contributes to the human comfort and safety of users, iii) natural ventilation, and iv) attractive architectural design. In addition, open car parks present specific characteristics that must be considered in the fire design.
14
According to the ECCS report (1993) [27], steel structures in open car parks do not require fire protection, and therefore have economic advantages. The fire safety of these structures is ensured by the following conditions: i) the design at room temperature (or “cold
design”), according to the current rules, is the basic condition for the stability of the structure
in the fire situation; no additional measures for fire neither a special “hot” design are required; ii) beams with composite steel concrete section including shear studs should be used. For economic reasons, it is recommended to use light weight sections ( IPE, HEAA and UB ); iii) large flange sections ( HEA, HEB, UC ) should be considered for the columns; and iv) horizontal forces must be supported by frames or bracings (protected against fire).
15
Table 1 - Resistance requirements of car parking, according to INERIS [29] ,ECCS [27].
Country
Limitations
General requirement for fire ISO
834
Alternative design conditions Minimum percentage
of opening (%)
Maximum
No fire protection
Natural fire (*3)
Openings /floor Openings /walls and facades (*1) Dist. between opposites facades (m) n° of stories Building height (m) Floor area per story
(m2)
Germany [30] - 33 70 - 22 - R0(*5) / /
Austria [31] - 33 70 - 22 - Up to R90 Yes Yes
Belgium [32] - 17 60 - - - R0 (*5) / yes
Denmark 5 - 24 - - - R0
(*5) to
R60 Yes Yes
Spain - - - R60 to
R120(*2)
- -
Finland [33] 10 30 - 8 - 9000 R60 No (*4) Yes
France [34] 5 - 75 - - - Up to R60 No (*4) Yes
Netherlands
- 30 54 - 20 - R0
(*5) to
R30
/ /
Hungary
- - - R30
(*2) to
R90 No No
Italy [35] , 15 60 - - - - R0 - -
Luxemburg
[36] - 50 - - - -
R0 (*5) to
R30 / /
Norway - - - - 16 5400 R10 to R60 Yes -
Poland - - - - 25 4000 R60 No -
Portugal [37] [38].
R60 to
R180 - Yes
U. K. 5 - 90 - 15.2 - R15 Yes Yes
Sweden [27]
- - - Up to R90 (*4) Yes Yes
Switzerland - 25 70 - - - R0 (*5) / /
(*1): Total area of openings / total area of walls and facades surrounding one parking level. (*2): General requirements of National Building Code.
(*3): Use of Natural Fire as an alternative to ISO fire to prove the fire resistance. (*4): Bare steel is allowed if this can be proved by tests or scientific studies. (*5): If specific structural conditions defined in National code are met.
2.3- Fire Statistics in open car parks
Some statistics of fires occurred in car parks have been realized, in order to define the car park structure and the scenario we will use for testing in Open car parks. The existing statistics in literature concerning fires in car parks are poor. The technical note n° 75 from ECSC and the final report ECCS research on Closed Car Parks of the gives a general view of the statistics of the 80's, mainly from United States. Therefore, it was necessary to get new statistics of fires in car parks.
16
The underground car parks are generally closed car parks and upper-structure parks are usually open car parks. Even if some upper-structure car parks are closed, the statistics will be considered representative of open car parks. Some statistics from the towns of Marseille, Toulouse, Brussels and Berlin were also included.
The intervention reports usually give the following information: date, call time, Intervention duration, injured people, type of building, ignition of fire, propagation of fire, time to extinction, description of fire and damage.
The time to extinction is usually classified by period: 1 and 5 minutes, 6 and 15 minutes, 16 and 30 minutes, 31 and 59 minutes, 60 and 89 minutes, 90 and 119 minutes, 120 and 179 minutes, 180 and 239 minutes.
The propagation is generally never described and known, and the ignition source is usually unknown. Only two or three cases are recognised. The description concerns the combustible, the problems for extinction, and description of the injured people.
The “damage” part gives the number of burning cars and some information about them: electrical problems, smoke propagation. The statistics resulting from the analysis of these reports are given in terms of time to extinction, number of cars involved in the fire, classifications of cars, injuries, daytime of fire occurrence [22].
2.3.1- Open car park
The design method presented in this document applies, as indicated from the very beginning, to the open steel car parks. According to the Building Regulations the car park is considered open if it satisfies the conditions presented here in.
These conditions ensure the natural ventilation as it is shown in Figure 12, which helps to avoid accumulation of smoke and additional increase of temperature [39].
17 3- FIRE EVENTS AND SCENARIOS
A “fire event” shall be defined as: “An occurrence in which extinguishing media was used to suppress fire” . This may mean a portable fire extinguisher, water from fire department
efforts, the activation of a kitchen vent hood, a building’s sprinkler system, or any other fire suppression system within a building can be used to reduce the fire event. On the rare occasion when evidence of fire is present, and the fire has self-extinguished, this will also be identified as a fire event.
The best characterization of the structural fire response of open car parks, Figure 13, is the real evidence or experimental tests that reproduce closely the reality, such as the study performed in 2000 by CTICM. The maximum gas temperature near the ceiling reached 1040 °C above the vehicle. However, the average gas temperature during the 15 minutes of higher temperatures was 510 °C, which means that a peak temperature was reached only during a very short time. The maximum temperature in the beam lower flange at a distance of 2.5 m from the column was 700 °C with a gradient of 250 °C in the cross-section [40].
For steel structures, the application of the global structural analysis needs to pay attention to following points: Regarding the material models, the designer must think of the transient heating regime of structures during fire, which requires the use of a step by step incremental and iterative solution procedure rather than a steady state analysis. The existing boundary conditions should be rightly represented, in particular the type of fire; and the material models used in the numerical modelling should be representative of real material behaviour at elevated temperatures. When performing advanced simulations for fire design of steel structures, designers must be careful with certain other specific features, which in general are not taken into account in the direct modelling, such as the joint resistance [41].
18 3.1- Heat release rate of cars
The heat release rate is a key parameter which can be used as an input to a wide range of fire assessment tools, ranging from zone models to computational fluid dynamics models. The heat release rate is usually obtained from experimental data through the use of oxygen consumption calorimetric, although other approaches such as measurement of temperature rise, mass loss, or species production can also be used. However the natural variability of fire means that even if the same item is burned using the same procedure for repeated experiments, the heat release rate curves obtained will not be exactly the same. The results of the HRR that were consider in this thesis are represented in Table 2 and plotted in Figure 14.
Table 2 - The HRR of different car categories. Vehicles categories
Class 1 Class 2 Class 3 Class 4 Class 5
Time HRR HRR HRR HRR HRR
min kW kW kW kW kW
0 0 0 0 0 0
4 884 1105 1400 1768 1768 16 884 1105 1400 1768 1768 24 3474 4342 5500 6947 6947 25 5242 6553 8300 10448 10448 27 2842 3553 4500 5684 5684 38 632 789 1000 1263 1263
70 0 0 0 0 0
Figure 14 - Hate release rate for 5 car classes.
axes of the fire plumes are assumed to be 2 m apart according to the dimensions of ordinary
19
Figure 15 - the fire plume [27]
3.2-Fire scenarios
3.2.1- Fire scenarios in car park
The fire scenario (position and number of the vehicles) should represent the most
unfavourable situation for the elements in the compartment (or substructure). The vehicles’ type
mostly used in fire scenarios are cars, classified according their calorific potential or combustion energy (E). There are basically two approaches available when determining the fire design for a given scenario. One is based on knowledge of the amount and type of combustible materials in the compartment of fire origin [39].
In order to define some fire scenarios, this car park structure was chosen (see Figure 17). In this work, one fire scenario was identified to be representative of their effect of the steel structure. The fire event of a class 3 vehicle was considered to define all these possible scenarios: Fire scenario 1 with one car burning below the secondary beam (IPEA 600) at mid-span (most severe case); Fire scenario 2 with two cars burning below the main beam (HEAA 650) and; Fire scenario 3 with three cars burning near the columns (HEM 300).
3.2.2- Parameters with significance in a fire scenario
20 3.2.3- Classification of cars
The cars are classified according to the Table 2. Not all reports give the type of each car, so only 91 % of cars (175 cars) have been used to determine the distribution in category. The distribution is given in Figure 16. The categories 4 and 5 represent 13 % of cars [43].
Figure 16 - Classification of cars involved in car fires in underground car park [43].
Table 3 presents a few examples of car manufacturers for each car class.
Table 3 - Definition of car classes (categories).
Type Category1 Category 2 Category 3 Category 4 Category 5
Peugeot 106 306 406 605 806
Renault Twingo-Clio Mégane Laguna Safrane Espace
Citroën Saxo ZX Xantia XM Evasion
Ford Fiesta Escort Mondeo Scorpion Galaxy
Opel Corsa Astra Vectra Omega Frontera
Fiat Punto Bravo Tempra Croma Ulysse
Volkswagen Polo Golf Passat // Sharan
3.2.4- Fire scenarios
21
position of each fire event. Scenario 4 involves four class 3-cars parked face to face, with the possibility to have a commercial vehicle in each place.
For all scenarios, the fire spread time from a vehicle to another can be considered equal to 12 minutes, but the initial document by ECCS recommended a time delay equal to 15 minutes [44].
Scenario 5 involves three cars - class 3, parked side by side. The scenario of three cars class 3 involved in a fire is an envelope scenario of around 98.7% of all possible scenarios [40].
Figure 17 - Fire scenarios in open car park [44].
Figure 18 represents the simulation of the fire scenario 1 and is going to be analysed considering different positions for the car with respect to position of the secondary beam. Figure 19 represents an example of the main elements of a case study for the thermal analysis of the structure.
22
Figure 19 - The front view of the fire scenario 1
3.3- Fire compartment
3.3.1- Definition of fire compartment
Space within a building, extending over one or several floors, which is enclosed by separating elements such that fire spread beyond the compartment is prevented during the relevant fire exposure [45]. A fire compartment is an area within a building which is completely surrounded with resistant construction, usually with features such as automated fire-resistant doors which close when a fire is detected. Fire compartments are required by law in some types of buildings, and strongly recommended in others as a basic safety measure. Some insurance companies may also demand that fire compartments be installed before they will write policies for certain types of businesses, in the interests of reducing their liability.
23 3.3.2- Phases of fires in compartment
Fire in enclosures may be characterized in three phases. The first phase is fire development as the fire grows in size from a small incipient fire. If no action is taken to suppress the fire, it will eventually grow to a maximum size that is controlled by the amount of fuel present (fuel controlled) or the amount of air available through ventilation openings (ventilation limited), see Figure 20.
Figure 20 - Phases of fire development [46].
If all of the fuel is consumed, the fire will decrease in size (decay).
These stages of fire development can be seen in the fully developed fire and are affected by: (a) the size and shape of the enclosure; (b) the amount, distribution and type of fuel in the enclosure; (c) the amount, distribution and form of ventilation of the enclosure and (d) the form and type of construction materials comprising the roof (or ceiling), walls and floor of the enclosure.
The significance of each phase of an enclosure fire depends on the fire safety system component under consideration. For components such as detectors or sprinklers, the fire development phase will have a great influence on the time at which they activate. The fully developed fire and its decay phase are very important for the verification of the integrity of the structural elements.
24
ventilation-limited fire. Flashover normally occurs at 500 °C or 590 °C for ordinary combustibles, and with an incident heat flux at floor level of 20 kW/m2.
Flashover can be initiated by several mechanisms, while this fire eruption to the casual observer would appear to be the same. The observer would see that the fire would ‘suddenly’ change in its growth and progress to involving all of the fuel in the compartment. If the compartment does not get sufficient stoichiometric air, the fire can produce large flames outside the compartment. A ventilation-limited fire can have burning mostly at the vents, and significant toxicity issues arise due to the incomplete combustion process [46].
3.4- Localized fires
In a localized fire, there is an accumulation of combustion products in a layer beneath the ceiling (upper layer), with a horizontal interface between this hot layer and the lower layer where the temperature of the gases remains much colder. This situation is well represented by a two-zone model, useful for all pre-flashover conditions. Besides allowing for the calculation of the evolution of gas temperature, these models are used in order to know the smoke propagation in buildings and to estimate the life safety as a function of smoke layer height, toxic gases concentration, radiative flux and optical density.
The thermal action on horizontal elements located above the fire also depends on their distance from the fire location. The temperature and the heat flux can be assessed by specific models for the evaluation of the local effect on adjacent elements, such as Heskestad' s or
Hasemi’s method [45].
3.4.1- Heskestad model
Thermal action of a localised fire can be assessed by using the Heskestad method. Differences have to be made regarding the relative height of the flame to the ceiling. The flame lengths Lf of a localised fire is given by Eq 1. If the length is smaller than the height of the
compartment, this method should be applied. Due to the size of the fire the virtual origin Z0
should be calculated according to Eq 2. Figure 21 represents the relative position of the fire and the element of the structure under analysis.
Q
D Lf 5 / 2 00524 . 0 02 . 1 25
Figure 21 - Localised fire model for flames not touching the ceiling (Heskestad) [47].
When the flame is not touching the ceiling of a compartment (Lf < H) or in case of fire
in open air, the temperature ϴ(z) in the plume along the symmetrical vertical flame axis is given by:
Where: D represents the diameter of the fire [m], Q is the Heat Release Rate [W] of
the fire, Qc is the convective part of the rate of heat release [W], with Qc= 0,8Q, Z is the
height [m] along the flame axis, H is the distance [m] between the fire source and the ceiling and Z0 represents the virtual origin [13].
This model is applied to calculation of the effect to any steel member locate above the flame position.
3.4.2- Hasemi model
Hasemi’s method is a simple tool for the evaluation of the localised effect on horizontal elements located above the fire, but not only in the flame axis but also in radial position. This method is based on the results of tests made at the Building Research Institute in Tsukuba, Japan. The Hasemi method considers that the flame is touching the ceiling (Lf H ) and
rotates in radial direction to create a ceiling jet motion of smoke, particles an flames, see Figure 22. This method does not give information about the surrounding gas temperature. This method provides information about the heat flux arriving to the element of the structure.
) 1000 ( 083 . 0 02 . 1 0 Q D
Z Eq 2
3 / 5 0 5 / 2 )
( 200.25 ( )
26
Figure 22 - Localized fire model for flames touching the ceiling (Hasemi).
The parameters for the application of the method are: Q representing the Rate of the Heat Release of the fire [W], D represents the diameter (or characteristic length) of the fire [m], H is the distance between the fire source and the ceiling [m], Lh represents the horizontal
length of the flame on the ceiling [m] and r the horizontal distance, at the ceiling, from the flame axis [m].
The heat flux that arrives to a beam depends on the following parameters: Rate of heat release of cars:Q, Height of the lower flange of the beam from the floor: Ha, Diameter of the
fire: D (2 m is used), Distance from the beam section to the car center: r, Height of the fire
source from the floor: Hs (0.3 m is used).
The heat flux
•
h is calculated with the Hasemi method by the following equations:
y y y 00 . 1 00 . 1 30 . 0 30 . 0 7 . 3 15 00 . 121 30 . 136 100 • • • y h y h h Eq 4
where y is the non-dimensional parameter [-] calculated by:
Z H L Z H r y
H
Eq 5
With LH is the horizontal length of the flame [m] determined by [6]:
H Q
H
27 And
s a H H
H Eq 7
5 . 2 6 * . 10 . 11 . 1 H Q
QH Eq 8
5 . 2 6 * . 10 . 11 . 1 D Q
QD Eq 9
Where : Q*Hand QD* are the non-dimensional heat release rates [6].
This method does not provide the temperature of the surrounding gas. This temperature can be determined using the equilibrium of the heat flux arriving to the steel element and the heat flux lost by this profile for the cold layer by convection and radiation.
00 . 1 00 . 1 * * D D Q Q ) 0 . 1 .( . 4 . 2 ) .( .. 4 . 2 5 / 2 * 3 / 2 * 5 / 2 * D D D Q D Z Q Q D Z Eq 10
3.4.2.1- The Newton Raphson method
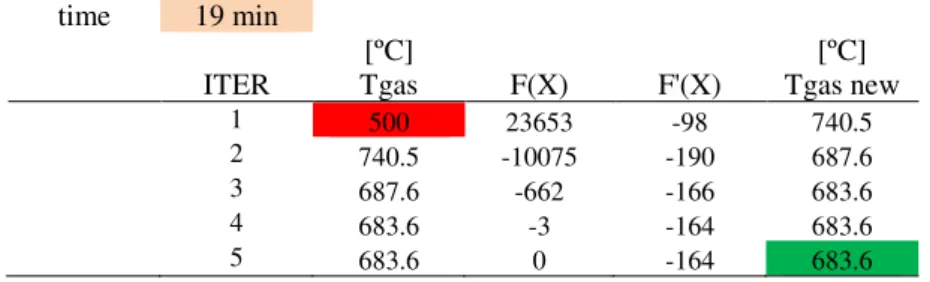
Newton’s Method is traditionally used to find the roots of a non-linear equation. This procedure is required to determine the temperature of the surrounding gas. The Newton Raphson method is going to be used for solving non-linear equation.
This solution method is illustrated in Figure 23 and is going to provide the gas temperature near the surrounding of the steel element, see Eq 11.
Figure 23 - Newton Raphson method.
The iterative procedure uses a trial value of gas temperature. The solution method is applied with 5 iterations maximum to get the solution value of the new gas temperature. Usually three or four iterations are sufficient.
28
section factor. This means that the gas temperature should be equal to the temperature of that material (steel), establishing a thermal equilibrium between the heat flux received and the heat flux that this material can send the cold layer.
) ( ) ( 1 gas gas n gas n gas T f T f T T Eq 11 0 ] 293 ) 273 [( 10 . 67 . 5 . ) 293 ) 273
.(( 8 4 4
• steel m f steel
c T T
h Eq 12
Taking in consideration the hypothesis, Eq 12 can be rewritten, assuming the Tgas equal to Tsteel, see Eq 13.
0 ) ( 0 ] 293 ) 273 [( 10 . 67 . 5 . ) 293 ) 273
.(( 8 4 4
• gas gas m f gas c T f T T
h
Eq 13
To solve this equation by the newton Raphson method, the derivative should be calculated, see Eq 14.
1 ] ) 273 [( 4 10 . 67 . 5 . . )
( 8 3
Tgas c f m Tgas
f Eq 14
Because the Eq 12 is non-linear we can start the iterative process with any temperature having Tgas or Tsteel, and for the time in analysis. The first time to apply this process corresponds to 19 min. The starting value can be 500 ºC and the solution is Tgas=683.6 ºC.
Table 4 - Example of calculation with the solver using the Newton Raphson method.
time 19 min
[ºC] [ºC]
ITER Tgas F(X) F'(X) Tgas new
1 500 23653 -98 740.5
2 740.5 -10075 -190 687.6
3 687.6 -662 -166 683.6
4 683.6 -3 -164 683.6
5 683.6 0 -164 683.6
29
4- THERMAL ANALYSIS - SIMPLE CALCULATION METHOD
4.1- Material properties
4.1.1- Thermal properties of steel
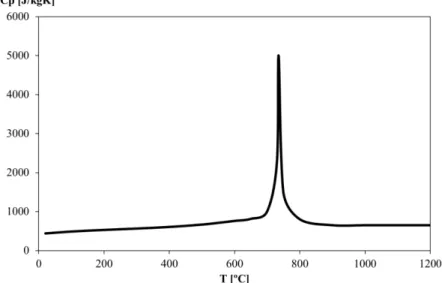
The specific heat is the quantity of heat required to raise the temperature of one gram of material one degree Celsius (or one Kelvin). The specific heat of steel 𝑐𝑎isdefined in accordance to Eurocode EN 1993-1-2 [47] as the following :
20 ≤ 𝜃𝑎< 600[℃] ca4257,73101a1,69103a22,22106a3
J/k g.K
Eq 15600 ≤ 𝜃𝑎< 735[℃] ca aJ/kg.K
738 13002 666
Eq 16
735 ≤ 𝜃𝑎< 900[℃] ca a J/kg.K
731 17820 545
Eq 17
900 ≤ 𝜃𝑎< 1200[℃] ca650J/kg.K Eq 18
where : 𝜃𝑎 is the steel temperature [℃]. Figure 24 represents the variation of specific heat with temperature.
Figure 24 - Specific heat of carbon steel as a function of the temperature.
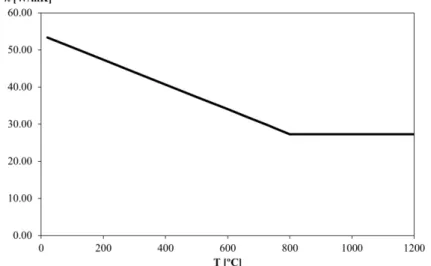
The thermal conductivity is the ability of a material to transport heat energy through it from high temperature region to low temperature region.
30
20 ≤ 𝜃𝑎< 800[℃] a 543,33102a W/m.K Eq 19
800 ≤ 𝜃𝑎< 1200[℃] a27,3
W/m.K
Eq 20Where: 𝜃𝑎 is the steel temperature [℃]. According to Eurocode EN 1993-1-2 [47] the variation of thermal conductivity with temperature is represented in Figure 25.
Figure 25 - Thermal conductivity of carbon steel as a function of the temperature.
The density of steel is constant 𝜌 = 7850 kg/m3, even when the temperature is modified.
According to Eurocode EN 1993-1-2 [47]. The variation of the density with temperature can be
illustrated in Figure 26.
Figure 26 - The density of steel as a function of the temperature.
31
The Specific heat represents the heat capacity of concrete. It increases with the moisture content of concrete and is affected by the mineralogical characteristics of the aggregate. The specific heat increases with an increase in temperature and also increases with a decrease in the density of concrete [48].
The moisture within the concrete causes a peak between 100 [ºC] and 200 [ºC] due to the
water being driven off. Figure 27 depicts the variation of this property with temperature. The peak
value depends on the amount of moisture, in this case μ = 3 % was assumed.
The specific heat of concrete should be determined from the following equations according to the Eurocode EN 1992-1-2 [49].
20 ≤ 𝜃𝑐 ≤ 100[℃] cP 900J/kg.K Eq 21
100 < 𝜃𝑐 ≤ 115 [℃] cP 2020J/kg.K Eq 22
115 < 𝜃𝑐 ≤ 200 [℃] cP a J/k g.K
12 115
2020
Eq 23
200 < 𝜃𝑐 ≤ 440 [℃] cP a J/k g.K
2 200
1000
Eq 24
440 < 𝜃𝑐 ≤ 1200 [℃] cP1100
J/kg.K
Eq 25Figure 27 represents the variation of specific heat with temperature for the specified moisture content.
Figure 27 - Specific heat of concrete as a function of the temperature [49].
32
The upper limit of thermal conductivity λ𝑐 of normal weight concrete may be determined from the equation below:
20 ≤ 𝜃𝑐 ≤ 1200 [℃] C 2 0,2451
c 100
0,0107
c 100
W/m.K
2
Eq 26
The lower limit of thermal conductivity λ𝑐 of normal weight concrete may be determined from the equation below:
20 ≤ 𝜃𝑐 ≤ 1200 [℃] c 1,36 0,136
c 100
0,0057
c 100
W/m.K
2
Eq 27
where: 𝜃𝑐 is the concrete temperature [℃].The variation of thermal conductivity with temperature is represented in Figure 28.
Figure 28 - Thermal conductivity of concrete as a function of the temperature [49].
The variation of density of concrete with temperature is influenced by water loss and is defined in Eurocode EN 1992-1-2 [49] as follows :
100 < 𝜃𝑐 ≤ 115 [℃] c 20Ckg/m3 Eq 28
115 < 𝜃𝑐 ≤ 200 [℃] c 20C 1 0,0285c 115kg/m3
Eq 29
200 < 𝜃𝑐 ≤ 440 [℃] 200 / 3
200 03 , 0 98 , 0
20C c kg m
c
Eq 30
440 < 𝜃𝑐 ≤ 1200 [℃] 800 / 3
400 07 , 0 95 , 0
20 C c kg m
c
Eq 31
33
Figure 29- the density of concrete according to Eurocode EN 1992-1-2.
4.2- Temperature calculation
4.2.1- Car position
The temperature of the secondary beam is going to be analysed, based on different car positions (R=0,1,2,3,4,5 m) relative to the fire flame axis, see Figure 30.
Figure 30 - The car positions.
4.2.2-Cross section
In this thesis the parametric analysis was defined: different cross sections were consider under fire by three sides, using 5 different car classes and different car position (relative distance).
34
the volume of the material. Figure 31 represents the main geometry required for the analysis of the secondary beams.
Figure 31 - The most important dimensions in a cross section.
We selected the profiles based on the variation of section factors to choose 5 different cross sections, the Profil HEAA 650 and the profil IPEA 550 are normally used in car parks, the profil HEB140 is not used but we used it just to make the comparison. Table 5 represents the main dimensions of the selected profiles to this parametric analysis.
Table 5 - Designation and dimension of cross sections. Designation Section
factor [m-1]
h [mm] b [mm] tf [mm] tw [mm]
HEAA 650 118 620 300 16 12.5
IPEA 600 131 547 220 17.5 9.8
IPEA 550 111 547 210 15.7 9
IPEA 450 165 447 190 13.1 7.6
HEB 140 155 140 140 12 7
4.2.3- Steel temperature development
4.2.3.1- Unprotected internal steelwork
For an equivalent uniform temperature distribution in the cross-section, the increase of temperaturea,t in an unprotected steel member during a time interval t should be
35 t h c V A k net a a m sh t
a
, , t 5s
Eq 32
Where : ksh represents the correction factor for the shadow effect, Am V represents the
section factor for unprotected steel members[1/m], Am is the surface area of the member per
unit length[m²/m], V is the volume of the member per unit length [m3/m], ca : the specific heat
of steel [J/kg.k], hnet represents the design value of the net heat flux per unit area [W/m²], t
is the incremental time interval [seconds] and a represents the unit mass of steel [kg/m
3].
Under nominal fire actions, the correction factor for the shadow effect may be determined from: Eq 33.
V V
9 .
0 m b m
sh A A
k
Eq 33
Where : [Am/V]b is box value of the section factor [47].
The model that is considered in this thesis for simple calculation method uses a mix of Heskestad and Hasemi: For the first period 0 < t < 19 min the Heskestad method should be applied. For the second phase 19 < t < 32 min the Hasemi method should be applied. For the third and last period 32 < t < 70 min the Heskestad method should be applied again.
Up to 19 min if the beam is 1 m located to the right the temperature of the beam should be 20 [℃].
4.2.3.2- Steel section HEAA 650
36
Class 1 Class 2
Class 3 Class 4/5
Figure 32 - Flame and steel temperature for all car classes.
37
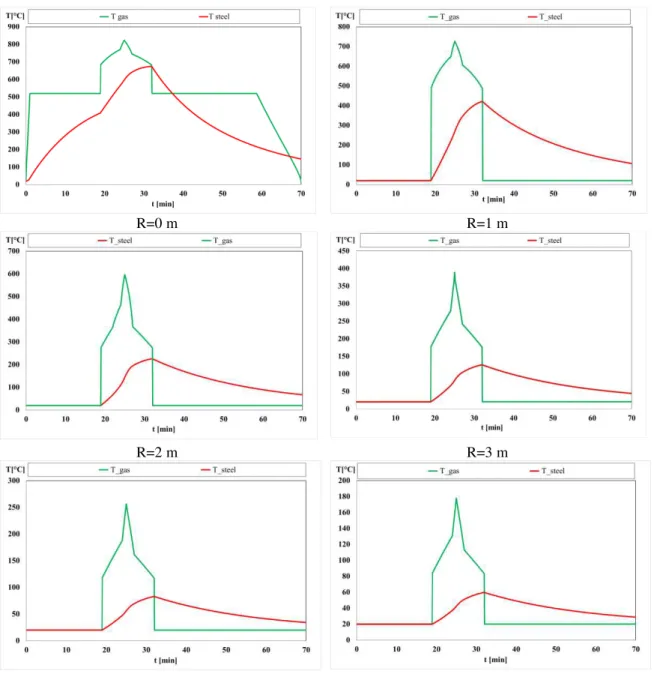
R=0 m R=1 m
R=2 m R=3 m
R=4 m R=5 m
Figure 33 - Flame and steel temperature of different positions from the fire axis.
It can be noticed that the Heskestad method is only valid for R=0 m. This means that the heat flux for R=1,2,..,5 m should not be consider when the flame is not touching the ceiling. For the first period of fire event the Heskestad method should be applied, calculating the temperature of the gas base on Eq 3 when R=0 m, and assuming no heat effect (TGas = 20 °C ) for other radial position.
When the flames are touching the ceiling, the Hasemi method is valid and the heat flux can be calculated for any radial position.
After the decreasing of the fire event, the length of the flames are decreasing and the Heskestad method should be applied again, keeping the temperature of the gas equal to 20 ºC.
![Figure 5 - Fire test in the scaffolding structure – Butcher et al. (1968) [20].](https://thumb-eu.123doks.com/thumbv2/123dok_br/16814954.751097/28.892.226.672.549.802/figure-test-scaffolding-structure-butcher-et-al.webp)
![Figure 11 - The open car parking of building Harbour Edge after fire [26].](https://thumb-eu.123doks.com/thumbv2/123dok_br/16814954.751097/33.892.116.778.240.492/figure-open-car-parking-building-harbour-edge.webp)
![Figure 13 - Application of steel framed for different open car parks [40].](https://thumb-eu.123doks.com/thumbv2/123dok_br/16814954.751097/37.892.120.776.861.1084/figure-application-steel-framed-different-open-car-parks.webp)
![Figure 16 - Classification of cars involved in car fires in underground car park [43]](https://thumb-eu.123doks.com/thumbv2/123dok_br/16814954.751097/40.892.199.694.299.601/figure-classification-cars-involved-car-fires-underground-park.webp)
![Figure 21 - Localised fire model for flames not touching the ceiling (Heskestad) [47]](https://thumb-eu.123doks.com/thumbv2/123dok_br/16814954.751097/45.892.128.763.99.397/figure-localised-model-flames-touching-ceiling-heskestad.webp)