João António Pires Miranda Nabais
Licenciado em Engenharia de Materiais
Soft biomaterials as a substitute for the
Nucleus Pulposus
Dissertação para obtenção do Grau de Mestre em
Engenharia de Materiais
Orientador: João Paulo Borges, PhD, Faculdade de
Ciências e Tecnologia da Universidade Nova de Lisboa
Co-orientador: Theo Smit, PhD, Vrije Universiteit -
Amsterdam
Júri:
Presidente: Prof. Doutor João Pedro Veiga
Arguente: Prof. Doutora Catarina Rosa Leal
Vogal: Prof. Doutor João Paulo Borges
ii
João António Pires Miranda Nabais
Licenciado em Engenharia de Materiais
Soft biomaterials as a substitute for the
Nucleus Pulposus
Dissertação para obtenção do Grau de Mestre em
Engenharia de Materiais
Orientador: João Paulo Borges, PhD, Faculdade de
Ciências e Tecnologia da Universidade Nova de Lisboa
Co-orientador: Theo Smit, PhD, Vrije Universiteit -
Amsterdam
Júri:
Presidente: Prof. Doutor João Pedro Veiga
Arguente: Prof. Doutora Catarina Rosa Leal
Vogal: Prof. Doutor João Paulo Borges
iv
Soft biomaterials as a substitute for the Nucleus Pulposus
© João António Pires Miranda Nabais
Faculdade de Ciências e Tecnologia Universidade Nova de Lisboa
v
Acknowledgment
My deepest thanks to my supervisors, Prof. João Paulo Borges and Prof. Theo Smit for all the guidance throughout this work. Without them, none of this would be possible. A special acknowledgment to Prof. Theo Smit for providing the opportunity of the development of this thesis in Amsterdam. More than an academic work, it allowed me to grow in other aspects. I´m, also, truly grateful for the friendship and guidance of my two friends Manuel Schimtz and Ben Nelemans. Your help during my stay in Amsterdam, surpassed the laboratory work itself. I feel truly lucky for having you both as friend.
To my friends Pedro Moreira, Pedro Taborda, Miguel Macedo and João Nunes for all the support during the development of this work.
I also would like to thank Nicholas Kurniawan and Rob Patterson for all the help. Also, my thanks to all people at ACTA and AMOLF for the help provided during laboratory work.
vii
Agradecimentos
Os meus mais profundos agradecimentos aos meus orientadores, o Professor João Paulo Borges e o Professor Theo Smit, pela orientação dada ao longo deste trabalho. Sem eles, este trabalho não seria possível. Um reconhecimento especial ao Professor Theo Smit pela oportunidade de desenvolvimento deste projeto em Amesterdão. Mais do que um trabalho académica, esta experiência permitiu-me crescer noutros aspectos.
Estou, também, profundamente agradecido à amizade e orientação do meus dois amigos Manuel Schimtz e Ben Nelemans. A vossa ajuda durante a minha estadia em Amesterdão, ultrapassou o trabalho laboratorial/dissertação em si mesmo. Sinto-me verdadeiramente sortudo por vos ter como amigo.
Aos meus amigos Pedro Moreira, Pedro Taborda, Miguel Macedo e João Nunes pelo apoio dado, não só durante o desenvolvimento deste trabalho como também durante a minha vida. Quero extender a minha gratidão ao Nicholas Kurniawan e Rob Patterson pela ajuda dada. Às pessoas da ACTA e do instituto AMOLF pela ajuda no trabalho laboratorial.
ix
Abstract
One of the largest health problems faced worldwide, when evaluated by direct (clinical) as well indirect cost (absenteeism), is the degeneration of the intervertebral disc (IVD) that leads to back pain and, potentially disability and individual´s quality of life decreasing.
The intervertebral disc is a mechanical and biological complex structure, formed by a tough outer layer of fibrocartilage called Annulus Fibrosus (AF),which surrounds a soft, elastic and gelatinous core called Nucleus Pulposus (NP). These two structures are completed by two upper and lower encasing layer called Vertebral Endplates (VEP).
The degeneration of the IVD is marked by the dehydration of the Nucleus Pulposus, reducing the hydrostatic pressure inside the nucleus, resulting in a loss of capability to support compressive forces, during the active period, and to regain height during the resting period. This situation will compromise the role of shock absorber by the NP and transfers these forces to the AF. This transfer will result in cracks on the AF, deteriorating the IVD, allowing the ingrowth of vessels and nerves.
This project was based on the developing a protocol to test suitable NP replacements, in hope to future assessment of discrete mechanical values and characteristics for an NP replacement. For this, Nucleus pulposus samples from goat, encapsulated Hydromed gel denominated
“Raviolis” and Chitosan gels, produced via wet route using an ammonium environment, were confined compressed. Chitosan was rheologically tested and swelling capability of all the three type of materials was assessed.
Results showed that the Nucleus Pulposus and “Raviolis” have similar mechanical behavior, being able to swell and “build up” hydrostatic pressure after a compression stage, while the Chitosan gel did not showed that ability. Therefore, “Raviolis” are a more suitable candidate to replace the NP than Chitosan gels. It was also observed that confined compression is the key test to perform on any possible candidate to replace the NP.
xi
Resumo
Um dos maiores problemas de saúde a nível mundial ,quando avaliado por custos diretos (clínicos) como também indiretos (absentismo), é a degeneração dos discos intervertebrais, que resulta em dores de costas e potencialmente incapacitando uma pessoa, levando a um decréscimo da qualidade de vida da mesma.
O disco intervertebral é uma estrutura mecânica e biológica complexa, sendo formada por uma camada exterior rija de fibrocartilagem chamada Annulus Fibrosus (AF) que rodeia um núcleo macio, elástico e gelatinoso denominado Nucleus Pulposus (NP). Estas duas estruturas são limitadas superiormente e inferiormente pelas vértebras.
A degeneração do disco intervertebral é marcada pela desidratação do Nucleus Pulposus, reduzindo a pressão hidrostática no interior do núcleo, resultando numa perda de capacidade de suporte de forças compressivas, durante o período activo, e na recuperação da altura do núcleo nos períodos de descanso. Esta situação compromete o papel de amortecedor por parte do NP, que transfere por sua vez, estas forças ao AF. Esta transferência resultará em fissuras no AF, deteriorando o disco intervertebral, permitindo a infiltração interna de vasos e nervos. Este projecto baseia-se no desenvolvimento de um protocolo de teste de modo a obter características e valores mecânicos discretos de possíveis materiais substitutos do NP. Assim,
Nucleus Pulposus de cabra, gel Hydromedencapsulado denominado por “Raviolis” e géis de
Quitosano, produzidos via húmida com recurso a uma atmosfera amoníaca, foram comprimidos mecanicamente. Os géis de quitosano foram testados reologicamente e a capacidade de inchamento dos três tipos de materiais foi aferida.
Os resultados mostram que o Nucleus Pulposuse os “Raviolis” apresentam um comportamento
mecânico semelhante, sendo capazes de inchar e readquirir pressão hidrostática após compressão, enquanto os géis de Quitosano não foram capazes do mesmo comportamento.
Assim, os “Raviolis” demonstraram ser candidatos mais adequados para substituir o NP do que os géis de Quitosano produzidos. Foi também observado que a compressão confinada é o principal teste a ser efectuado.
Palavras chave: Engenharia de Tecidos,
Compressão confinada, Quitosano,
Nucleus
xiii
Abbreviations
AF –Annulus Fibrosus
CS - Chondroitin sulfate
DDD – Degenerative Disc Disease ECM – Extracellular Matrix
FTIR – Fourier transform infrared spectroscopy FDA – Food and Drugs Administration
GAG - Glucoaminoglycan HM – Hydromed gel HA - Hyaluronic acid IVD – Intervertebral Disc LBP – Low Back Pain NP –Nucleus Pulposus
NPR - Nucleus Pulposus Replacement PBS – Phosphate Buffered Sulfate PEO - Poly(ethylene oxide)
PEGDA - Poly(ethylene glycoldiacrylate) PVA - Poly(vinyl alcohol)
PAA - Poly(acrylic acid)
PNIPAAm – poly(N-isopropylacrylamide) PGs - Proteoglycans
xv
Contents
1
Motivation ... 1
2
State of the art ... 3
2.1
Intervertebral Disc anatomy and the
Nucleus Pulposus
biomechanics ... 3
2.2
Intervertebral disc degeneration and current treatments ... 6
2.3
Hydrogels in Tissue Engineering ... 7
2.3.1
Mechanical characterization of hydrogels ... 8
2.3.2
Chitosan hydrogels ... 10
3
Materials and Methods ... 12
3.1
Samples preparation ... 12
3.1.1
Preparation of goat´s Nucleus Pulposus ... 12
3.1.2
Preparation of Chitosan gels ... 12
3.1.3
Preparation of
“Raviolis”
... 13
3.2
Swelling ratio measurement ... 14
3.3
Rheological characterization ... 14
3.4
Mechanical characterization ... 15
3.4.1
Confined compression experiments ... 15
3.4.2
Sample loading ... 17
3.4.3
Confined compression protocol/actual testing ... 18
4
Results ... 19
4.1
Swelling measurement ... 19
4.2
Rheology ... 20
4.2.1
Frequency sweep results ... 21
4.2.2
Time sweep results ... 24
4.2.3
Strain sweep results ... 25
4.3
Compression testing ... 25
4.3.1
Modeling the mechanical behavior of cartilage ... 26
4.3.2
Compression test results ... 27
xvi
4.3.4
“Ravioli” results
... 29
4.3.5
Chitosan result ... 31
5
Discussion ... 32
5.1
Swelling measurement ... 32
5.2
Rheology ... 32
5.2.1
Frequency sweep test ... 32
5.2.2
Time sweep test ... 32
5.2.3
Strain sweep test ... 33
5.3
Confined compression ... 33
6
Conclusion and future perspectives ... 34
References ... 36
7
Appendix ... 39
7.1
Rheology results ... 39
7.1.1
Frequency sweep test ... 39
7.1.2
Time sweep test ... 47
7.1.3
Strain sweep test ... 48
7.2
Confined compression results ... 50
7.2.1
Nucleus Pulposus
results ... 50
7.2.2
“Ravioli” results
... 52
7.2.3
Chitosan result ... 54
xvii
List of Figures
Figure 2.1 - Regions of the human spine with respect to the vertebrae and corresponding
intervertebral disc ... 3
Figure 2.2 - The intervertebral disc (IVD) location between adjacent vertebrae and the
individual structures and average dimensions of the IVD ... 4
Figure 2.3 - Structure of an aggrecan-type complex proteoglycans ... 4
Figure 2.4 -
ProDisc™
-C Total Disc Replacement (left) and SB Charite III
(right) ... 7
Figure 2.5 - PDN
device [26] ... 7
Figure 2.6 - Conventional techniques to mechanically characterize hydrogels: (a) strip
extensiometry; (b) ring extensiometry; (c) compression test; (e) indentation (F = force, P =
pressure) ... 9
Figure 2.7 - Chitosan structure (on the left) vs Chondroitin Sulfate (GAG) structure (on the
right) ... 11
Figure 3.1 - Schematic of the vapor gelation process used in this work
(adapted from [42]) and
custom made vapor chamber ... 13
Figure 3.2
–
Custom-made mold used to produce chitosan gels samples ... 13
Figure 3.3 -
“Ravioli” (Nicast
) samples in the dried state ... 14
Figure 3.4 - Overview of the confined compression setup (A). Hollow piston, ball and ring (all
made from stainless steel) are assembled with a porous glass filter (B and C) and can slide with
low friction in the stainless steel chamber (D) ... 16
Figure 3.5
–
Schematic of the loading protocol used in this project ... 17
Figure 4.1 -
Graph showing the swelling percentage of each sample ... 20
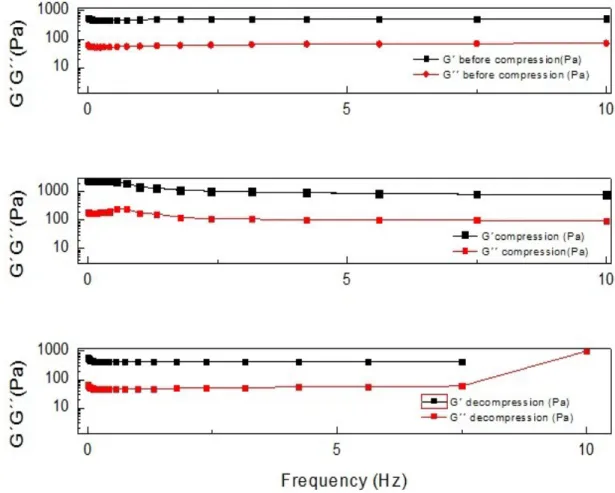
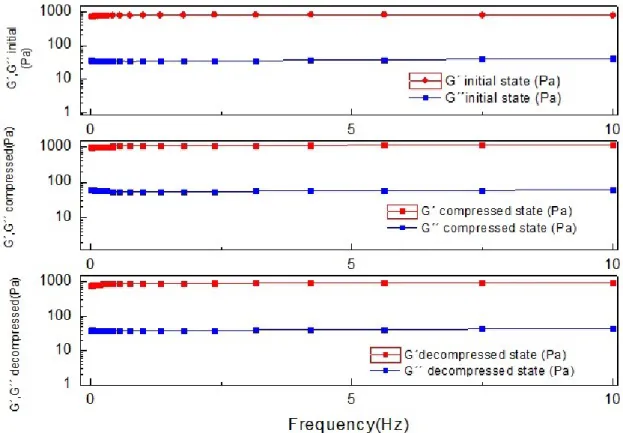
Figure 4.2 - Comparison of G´and G´´ of all states (initial, compressed and decompressed) of
sample 1, obtained with frequency sweep test ... 21
Figure 4.3 - Storage modulus (G´) comparison of sample 1 with all the states (initial,
compressed and decompressed) ... 22
xviii
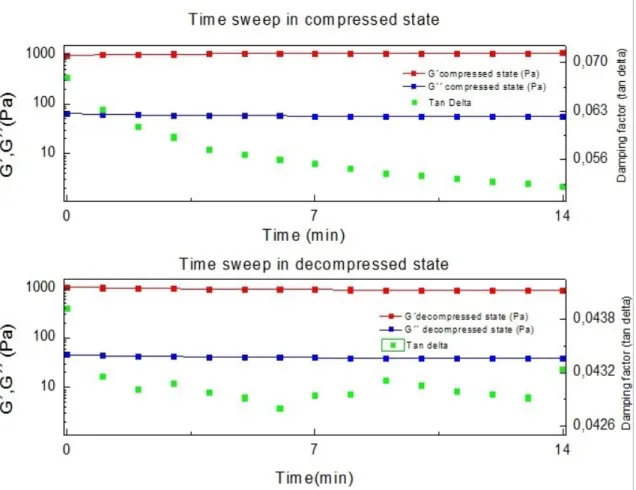
Figure 4.5 - Time sweep results in compressed state and decompressed state of sample 3 ... 24
Figure 4.6 - Strain sweep result from sample 1 ... 25
Figure 4.7 - Overview of the compression tests results of all samples. ... 27
Figure 4.8
–
1
stcreep curve result from the
Nucleus Pulposus
sample 1, with the respective
curve fitting ... 28
Figure 4.9 -1
stcreep curve result from the
Nucleus Pulposus
sample 2, with the respective
curve fitting ... 28
Figure 4.10 - 1
stcreep curve of RavSmall with the respective fitting curve ... 29
Figure 4.11 -1
stcreep curve of RavMedium1 sample, with respective curve fitting ... 30
Figure 4.12 - 1
stcreep curve of the “Ravioli Big” sample with the fitted curve
... 30
Figure 4.13 - 1
stcreep curve of the Chitosan sample and respective fitting... 31
Figure 7.1 - Comparison of G´and G´´ of all states (initial, compressed and decompressed) of
sample 2, obtained with frequency sweep test ... 39
Figure 7.2 - Comparison of G´and G´´ of all states (initial, compressed and decompressed) of
sample 3, obtained with frequency sweep test ... 40
Figure 7.3 - Comparison of G´and G´´ of all states (initial, compressed and decompressed) of
sample 4, obtained with frequency sweep test ... 41
Figure 7.4
–
Detailed view of the storage modulus (G´) comparison of sample 2 in all the states
(initial, compressed and decompressed) obtained in the frequency sweep test ... 41
Figure 7.5 - Detailed view of the storage modulus (G´) comparison of sample 3 in all the states
(initial, compressed and decompressed) obtained in the frequency sweep test ... 42
Figure 7.6 - Detailed view of the storage modulus (G´) comparison of sample 4 in all the states
(initial, compressed and decompressed) obtained in the frequency sweep test ... 43
Figure 7.7 - Detailed view of the loss modulus (G´´) comparison of sample 2 in all the states
(initial, compressed and decompressed) obtained in the frequency sweep test ... 44
Figure 7.8 - Detailed view of the loss modulus (G´´) comparison of sample 3 in all the states
(initial, compressed and decompressed) obtained in the frequency sweep test ... 45
xix
Figure 7.10 - Time sweep results in compressed and decompressed state of sample 4 ... 47
Figure 7.11 - Strain sweep result of sample 2 ... 48
Figure 7.12 - Strain sweep result of sample 3 ... 49
Figure 7.13 - Strain sweep result of sample 4 ... 49
Figure 7.14
–
2
ndcreep curve result from the
Nucleus Pulposus
sample 1, with the respective
curve fitting ... 50
Figure 7.15
–
3
rdcreep curve result from the
Nucleus Pulposus
sample 1, with the respective
curve fitting ... 50
Figure 7.16
–
2
ndcreep curve result from the
Nucleus Pulposus
sample 2, with the respective
curve fitting ... 51
Figure 7.17
–
3
rdcreep curve result from the
Nucleus Pulposus
sample 2, with the respective
curve fitting ... 51
Figure 7.18
–
2
ndcreep curve of the RavSmall sample, with respective fitting curve... 52
Figure 7.19
–
3
rdcreep curve of the RavSmall sample, with respective fitting curve ... 52
Figure 7.20
–
2
ndcreep curve of the “RavBig” sample with respective fitted curve
... 53
Figure 7.21
–
3
rdcreep cu
rve of the “RavBig” sample with respective fitted curve
... 54
Figure 7.22
–
2
ndcreep curve of the Chitosan sample and respective fitted curve ... 54
Figure 7.23
–
3
4dcreep curve of the Chitosan sample and respective fitted curve ... 55
xxi
List of tables
Table 2.2.1 - Compressive modulus of the NP adapted from ... 5
Table 3.1
–
Hydromed gel content inside each type of “ravioli”, supplied by Nicast
... 14
Table 4.1 Summary of the parameters of the
Nucleus Pulposus
samples 1 and 2, retrieved from
the fitting ... 29
Table 4.2
–
“Ravioli Small” fitting parameters summary, for each creep curve
... 29
Table 4.3
–
Summary of curve fitting parameters of each curve from Ravioli Medium1 and
Ravioli Medium 2 samples ... 30
Table 4.4 -
Parameters of “Ravioli Big” retrieved from the fitting in all creep curves
... 31
1
1
Motivation
The degeneration of the intervertebral disc (IVD) is thought to be the primary cause of lower back pain (LBP) [1]. Degenerative disc disease (DDD) is one of the largest health problems faced worldwide when judged by direct (clinical) and indirect costs (absenteeism). About 80% of the world population will suffer from back pain once in their life, 75% of which will be a consequence of degenerative processes of the disc [1, 2].
This degeneration of the IVD and especially of the central viscous Nucleus Pulposus (NP) is characterized by loss of water, increased extracellular matrix (ECM) breakdown, abnormal (fibrotic) matrix synthesis, inflammation, and in-growth of nerves and blood vessels into a typically aneural and avascular tissue. While the exact cause(s) of disc degeneration remains unclear, it is thought that the initiation and progression of the degenerative cascade involves multiple interdependent factors like mechanical loading, reduction in nutrient supply, altered cellular composition, hereditary elements, uncorrected spinal habits and age. Medical conditions associated with symptomatic IVD degeneration include disc herniation, radiculopathy, myelopathy, spinal stenosis and instability of the spine, constituting the vast majority of the diagnoses treated by spine specialists [3, 4, 5, 6].
Approximately 2/3 of the patients undergo successful pain relief using conservative treatments such as bed rest, anti-inflammatory drugs, chiropractic adjustment and physical therapy, however the remainder will require more invasive surgical intervention which is directed, currently, towards the removal of the damaged or altered tissue [3, 7]. However, the treatments currently available are ineffective, due to the lack of capability to cure the problem permanently. Only the pain inflicted by this degeneration is minimized, making the optimal treatment of symptomatic lumbar DDD still controversial [8]. NP replacement is one of the latest strategies explored. This classical approach involves matching the properties of the implant material to those of the native biological tissue. The prospective benefits of this solution are the removal of the source of pain and the preservation of the biomechanical balancing and motion of the spine [1, 9].
The structure of the NP can be described as an isotropic hydrogel. It is composed of proteoglycans, held together loosely by an irregular network of collagen type II and radial elastin fibers and water (70-90%). The proteoglycans are mainly responsible for the osmotic properties that enable the NP to maintain height and turgor against compressive loads. In general, hydrogels are defined as hydrophilic polymer networks which may absorb from 10% up to thousands of times their dry weight in water, allowing these hydrated macromolecular structures being used as a scaffold in tissue engineering [1, 4, 8, 10, 11].
2
The objective of the project described here is to define a basic testing protocol to achieve a quantitative characterization of the mechanical properties of any hydrogel proposed to function as a substitute of the Nucleus Pulposus.
Chitosan hydrogel samples were tested in this project as a potential NP substitute, while Caprine NP explants were used as reference material. Additionally there was the possibility to include in the project a self-inflatable implant, called the “Ravioli”. The Ravioli was developed in the course of a European FP7 project and consists on an electrospun envelope filled with a hydrogel denominated Hydromed.
Rheological measurements were used to determine the storage modulus (G´), loss modulus (G´´) and tang of the Chitosan gels. The confined swelling and compressive behavior of NP, Chitosan and Raviolis were explored in a custom made setup.
3
2
State of the art
2.1
Intervertebral Disc anatomy and the Nucleus Pulposus
biomechanics
Composed of 24 moveable vertebrae (7 cervical, 12 thoracic and 5 lumbar), the primary function of the spine is to give support to the upper body and transmit axial loads arising from the head and torso to the hips and lower extremities, to protect the spinal cord from impacts and to allow mobility and stability such that bending and torsional motion of the spine can occur. [12, 13, 14]
Figure 2.1 - Regions of the human spine with respect to the vertebrae and corresponding intervertebral
disc [15]
The 24 vertebral bodies are separated by 23 cartilaginous structures called Intervertebral Disc (IVD). The IVD is composed of three morphologically distinct regions: a peripheral layered structure called Annulus Fibrosus (AF), which encapsulates a gelatinous structure called
4
her neighboring two vertebrae with their associated ligamentous structures. This complex joint permits the flexible motion within the spine, between adjacent vertebrae, while serving as a shock absorber by resisting compressive, flexile-extensive, lateral bending and axial rotation loads [2, 8, 17].
Figure 2.2 - The intervertebral disc (IVD) location between adjacent vertebrae and the individual structures
and average dimensions of the IVD [18]
This mechanical role is intimately related to each of its constitutive elements and the properties of the materials composing them. 75% of the compressive load observed by the IVD is borne by the NP itself, with the remaining 25% supported by the AF [8].
Due to this role, the NP has been widely studied in terms of constitution and mechanical behavior. Composed mainly of water, collagen type-II and the large proteoglycan aggrecan, as seen in Figure 2.3, the NP has been described as a hydrated mass of gelatinous tissue, situated in the center of the disc [18]. The high affinity to water is due to the highly negative sulfated charge. Negatively charged chondroitin sulfate and keratin sulfate play a crucial role in binding water, which in turn gives the disc its resilient compressive strength [19].
5
This proteoglycan network is responsible for the considerable potential for swelling of the nucleus by up to more than 200% of its initial volume, allowing the NP to generate an osmotic pressure gradient. This pressure is essential for maintaining the stability of the spine [8, 17]. When loads on the spine increase, the low permeability of the surrounding AF and VEPs causes the fluid pressurization. As a result of this, the NP withstands compressive load, but by deformation converts some of the compressive stresses into tensile stresses in the AF and VEP, which aids in stabilizing the spine.
As the water content of the NP decreases during compression, concomitant with an increased fixed charge density, the osmotic pressure rises, inducing the influx of fluid back into the NP, when the spine is unloaded during rest periods [8].
Several experiments throughout the years have determined some mechanical properties values. Panagiotacopulos et al. (1987) found that the tensile relaxation modulus of a nondegenerated human NP material ranges from 30 to 40 kPa. In the same study, the complex dynamic shear modulus (|G*|), derived by dividing the peak shear stress σ0 by the peak shear
strain 0, found to range from 10-50 kPa, similar to the value reported by Iatridis et al. (1996), 11
kPa. Intradiscal pressures within the lumbar NP have been measured to be 0.03 – 0.31 MPa while lying prone, 0.5 MPa while standing relaxed and 2.3 MPa while lifting 20 kg weight with a flexed back [3, 8, 17, 18, 21].Table 2.1 resumes the values of the compressive modulus of the NP of three different species, from three different studies. These results were obtained by indentation, unconfined compression and confined compression. [22]
Table 2.2.1 - Compressive modulus of the NP adapted from [22] Compressive
modulus (MPa)
Tissue Method Species Authors
0.31 0.04 NP Confined compression
Bovine D. Périé et al. 2005 0.006 0.0005 NP Indentation Human Umehara et
al. (1996) 0.003 NP Unconfined
compression
Sheep Johannessen et al. (2004)
6
It is crucial to quantitatively characterize the mechanical properties of the NP to develop any possible substitute of this tissue.
2.2
Intervertebral disc degeneration and current treatments
Low back pain is generally associated with the degeneration of the IVD. However, multiple factors contribute to this degeneration and a consensus of the specific reason for this degeneration has not been accomplished. Changes in the matrix composition and deterioration of biomechanical properties, abnormal mechanical loading, genetic predisposition, avascularity of the tissue, VEP mineralization and trauma are thought to be crucial to this problem [18, 19]. It is believed by many researchers, that the degeneration of the spinal disc is a natural aging process. This process involves tissue loss or destruction over time, which decreases disc height and ultimately compromises the mechanical function of the spinal segment [2].
The decline of nutritional supply of the NP leads to a lack of synthesis of PGs in the NP´s extracellular matrix (ECM). This reduction of proteoglycan synthesis will reduce the NP capability of building up osmotic pressure. The decreased water binding capacity reduces the hydrostatic pressure present, which further accelerates IVD degeneration since proteoglycans formation is stimulated under these conditions. The dehydration of the NP results in an overall volume loss, impairing to exert fluid pressure on the AF when compressed. Therefore, the NP loses its ability to transmit weight directly to the AF, altering the uniform load distribution characteristic of healthy disc and concomitantly the viscoelastic properties. Repeated stresses will cause annular fissure, allowing the NP migration from the center of the disc to the outside of the disc, resulting in disc herniation. As a consequence of this migration, the NP will no longer be protected from the immune system, causing an inflammatory response from the body, creating an impingement on nerve roots and leading to additional pain [18, 23].
7
Figure 2.4 - ProDisc™-C Total Disc Replacement (left) and SB Charite III (right) [18]
Another surgical solution being investigated comprises the replacement of the NP for a mimetic material, in patients with mild to moderate DDD. This surgical solution, named NPR (Nucleus Pulposus Replacement), is a minimally invasive and early-stage intervention. One NPR device, already approved by the FDA, is the prosthetic disc nucleus PDN (RayMedica), as seen in figure 2.5, and consists of a hydrogel core (polyacrylonitrile and polyacrylamide) constrained by a biodegradable woven polyethylene fiber mesh [2, 18, 19].
Figure 2.5 - PDN device [24]
Hydrogels position themselves as promising candidates for the NP regeneration due to the potential of minimal invasion procedure and the elimination of implant-related complications, namely, corrosion, stress shielding and wear debris release [14].
2.3
Hydrogels in Tissue Engineering
Tissue engineering is generally described as “the use of a combination of cells, engineering and
materials methods, and suitable biochemical and physio – chemical factors to improve or
replace biological functions” [13].In short, it aims to develop biological substitutes that restore, maintain, or improve the lost or damaged tissues and organs. [14]
8
With this assumption, much of attention has been directed toward the development and use of hydrogels in this regeneration, as stated before. Hydrogels are three dimensional polymeric networks that absorb a significant amount of water or biological fluid, serving as a temporary scaffold and increasing the hydration while aiding nutrient transport [2, 14].
Possessing several remarkable features qualifies them for NP replacement. They can be designed to resemble the NP physically and mechanically to a great extent [2]. Hydrogel synthesis is relatively easy and they can be made injectable, allowing a minimally invasive surgery approach. Also, they can adequately fill the space of defect, eliminating the need for patient-specific shaping of the scaffold. Furthermore, they can be produced with a wide range of properties, allowing the tuning of the mechanical properties, and promote the delivery and encapsulation of cells and bioactive agents [14, 25].
Different hydrogel materials have been developed to mimic the native properties of the NP. Poly(ethylene oxide) (PEO), poly(ethylene glycoldiacrylate) (PEGDA), poly(vinyl alcohol) (PVA), poly(acrylic acid) (PAA) are just a few examples of synthetic hydrogels. Natural hydrogels comprise materials like: Hyaluronic acid (HA), chondroitin sulfate (CS), collagen-based hydrogels, alginate, fibrin, agarose, silk and chitosan [2, 26]. S. Varghese and J. Elisseeff [26] made a comprehensively reviewed the application of hydrogels for tissue engineering.
2.3.1
Mechanical characterization of hydrogels
Several methods have been used to characterize the mechanical properties of hydrogels like extensiometry, bulge test, indentation test and compression test. [27]
2.3.1.1
Extensometry
9
2.3.1.2
Bulge test
Also referred to as the inflation test (figure 2.6d), it involves the inflation of the hydrogel through a window in the substrate and measuring the resulting displacement, measured with a laser for instance, as a function of the applied pressure. By applying a finite element model, data can be analyzed and mechanical properties values can be obtained. The potential leakages alongside with the difficulty to control the applied pressure are shortcomings of this type of test. [27]
Figure 2.6 - Conventional techniques to mechanically characterize hydrogels: (a) strip extensiometry; (b) ring extensiometry; (c) compression test; (e) indentation (F = force, P = pressure) [27]
2.3.1.3
Indentation test
Another type of test used to characterize a hydrogel is through indentation (figure 2.6e). This test consists on indenting a hydrogel at a single point to a predetermined displacement depth and measuring the reaction force require to cause the indentation. Several characteristics can be determined by this test. Elastic modulus of the material can be calculated through the force-displacement curve. Also, by applying the indenter to a sample for a fixed period of time at a constant indentation depth, stress relaxation data can be obtained. [27]
2.3.1.4
Compression test
10
gel, such as time-dependent properties (stress relaxation and creep recovery), using a theoretical model. [27]
2.3.1.4.1
Confined versus unconfined compression
Unconfined compression has been used to determine mechanical parameters of the NP. [28] This type of test induces fluid flow and lateral expansion of the NP. However, the NP is constricted by the surrounding AF in vivo. The results obtained with this type of test are difficult to reconcile with the natural physiological function. [10]
Contrary to this, confined compression test resembles the natural environment of the NP, being able to provide more accurate results comparing to those provided by unconfined compression.
2.3.2
Chitosan hydrogels
2.3.2.1
Chitosan
Polysaccharides have been drawing attention towards tissue engineering, because they either are or resemble naturally occurring biological compounds [29]. One example of these polysaccharides is chitosan.
With a linear structure, chitosan is composed of D–glucosamine and N–acetyl–D glucosamine residues and is derived from chitin, a polysaccharide found mainly in the exoskeleton of Arthropoda.
Being a weak base, the solubility of chitosan is attained via protonation of its amine groups in acidic environments, being insoluble in water and organic environments. Therefore, chitosan remains in solution up to a pH in the vicinity of 6.2, while the progressive neutralization of chitosan aqueous solutions will lead to the formation of a hydrated gel-like precipitate [30, 31]. The formation of a hydrated gel-like precipitate is linked to the positively charged amino groups and the negatively charged counter ion. Incrementing the degree of acetylation leads to increasing the number of free amino group, therefore modifying the hydrophobic interactions with water [29].
11
Figure 2.7 - Chitosan structure (on the left) vs Chondroitin Sulfate (GAG) structure (on the right) [32, 33]
12
3
Materials and Methods
The main objective of this project is to deliver a protocol to quantitatively characterize any possible replacements for the Nucleus Pulposus.
To mimic the NP tissue, some basic specifications must be met by the replacement material. First, it should be able to imbibe water and therefore swell. Also, the NP´s main function is to
behave as a “shock absorber”, sustaining mostly compressive forces. Another relevant aspect is
the confined environment of the NP by the AF and the VEP. With these starting features, it was thought to perform three types of test for this project, addressing rheological characterization, swelling measurement and confined compression behavior.
The first test performed in this project, was the swelling measurement of the samples. Swelling measurement of the samples was determined by dividing the weight of the sample on the swollen state with the weight of the sample in the dry state. The second type of test used was rheological characterization of the chitosan gels. Finally, the last test performed was confined compression, achieved through compression of the samples by using a custom confined compression and a hydraulic mechanical testing device.
Materials tested in this project were the goat´s NP tissue, “Ravioli” (Nicast) samples filled with Hydromed gel and Chitosan gels.
3.1
Samples preparation
3.1.1
Preparation of goat´s Nucleus Pulposus
Three thoracic spinal segments from a goat were used to extract samples of the Nucleus Pulposus. After removing the Nucleus Pulposus from the Endplates and Annulus Fibrosus using surgical blades and tweezers, several samples were taken out with a 9mm surgical punch and stored on Eppendorf tubes (without any medium).
3.1.2
Preparation of Chitosan gels
13
Figure 3.1 - Schematic of the vapor gelation process used in this work (adapted from [34]) and custom
made vapor chamber
After dissolved, the solution was poured into a custom made mold with 3mm thickness and placed in a chamber with ammonium solution of 25 wt%. The solution will originate the ammonium vapor atmosphere, crosslinking the chitosan and, therefore, creating the chitosan gels.
The chitosan sample used was collected from the custom-made mold with thickness of 3mm, allowing the sample to have a constant height and flat surfaces, and punched out with a 9mm metal punch.
3.1.3
Preparation of “Raviolis”
The “Ravioli” (Nicast) samples, filled with Hydromed gel (figure 3.2), were used as delivered, without special conditions of storage.
Figure 3.2 – Custom-made mold used to produce chitosan gels samples
14
Figure 3.3 - “Ravioli” (Nicast) samples in the dried state
Table 3.1 shows the three differente amounts of hydromed (HM) gel for each type of “Ravioli”.
Table 3.1 – Hydromed gel content inside each type of “ravioli”, supplied by Nicast
Ravioli Big Ravioli Medium Ravioli Small
Hydromed gel content 37 mg 24 mg 13,1 mg
All of the samples were only used on the moment to assemble the setup preparation and immediately prior to actual testing.
3.2
Swelling ratio measurement
The swelling ratio of the gels is based on method used by Y. Wang et al. [35]. The swelling ratio is determined by the following formula (equation 3.1):
(Equation 3.1)
Where, WSand WD are the weight in the swollen and dried state, respectively.
3.3
Rheological characterization
15
custom made chamber with water. The amount of water put was minimum to allow contact with the sample but not submerging it.
The testing protocol comprises several steps:
1. Frequency sweep at the original gap; 2. Compression up to -10% gap;
3. Time sweep for 15 minutes at compressive state; 4. Frequency sweep at compressive state
5. Decompression to original gap;
6. Time sweep for 15 minutes at decompressed state; 7. Frequency sweep at decompressed state;
8. Strain sweep;
Frequency sweep was performed between 10 – 0.1 Hz at a fixed strain amplitude of 0.5% and strain sweep measurements were performed at a fixed frequency of 0.5 Hz gradually increasing the strain amplitude from 0.1% to a maximum of 1000% or until sample failure occurred.
3.4
Mechanical characterization
3.4.1
Confined compression experiments
The confined compression testing consists of three parts:
1. Setup preparation; 2. Sample loading; 3. Actual testing.
3.4.1.1
Setup preparation
All samples were tested with a hydraulic mechanical testing device (Instron 8872 Canton, Massachusetts) equipped with a 50N load cell, using a 9mm custom made confined compression chamber (figure 3.3). Load and displacement were measured during testing at a sample rate of 2 samples per second.
The chamber was first assembled without the sample to be tested, to determine the “zero
16
Phosphate Buffered Sulfate (PBS) was kept, constantly, at room temperature, throughout the experiments.
Figure 3.4 - Overview of the confined compression setup (A). Hollow piston, ball and ring (all made from
stainless steel) are assembled with a porous glass filter (B and C) and can slide with low friction in the
stainless steel chamber (D)
3.4.1.2
Height calibration
i.
Fix the indenter to the load cell using the small pin on the machine;ii.
Connect 50N load cell and activate;iii.
Pre-wet the filters by dripping PBS Fill the pipette with PBS.17
vi.
Put the steel ball inside the chamber, on top of the piston. Tap gently to make sure that there isn´t any space between the components.vii.
Place the 9mm confined chamber inside the glass box, filled with PBS at room temperature, under the machine test. Make sure that the chamber is completely submerged. Lower the indenter until it reaches a positive force of 0.1N (contact force) and slowly decreases this force until it reaches a force near to 0.01N. This step is made without the sample inside the chamber;viii.
Accept the height in the software;ix.
Move the indenter of the machine up and take the confined chamber out.3.4.2
Sample loading
The confined compression testing starts by approaching the indenter to the sample to determine the height of the sample. After determination of the height, follows one pre-load stage and three loading stages (2.5% compression of the height), as schematized in the Figure 3.5.
i. Disassemble the confined chamber;
ii. Put the plastic plug into the chamber from the top. Place the metal ring of 9mm first, following the P4 glass filter and finally the NP sample, “Ravioli” sample or Chitosan sample;
iii. Close the chamber;
iv. Remove the plastic plug and fill the chamber with PBS;
18
v. Fill the hollow piston with PBS and place it inside the chamber;
vi. Place the steel ball on top of the piston and gently tap, to make sure that there isn´t any space between the components;
vii. Place the chamber inside the glass box;
viii. Lower the indenter until it reaches 0.3N of force (contact force); ix. Take note of the new height (it will give the sample´s thickness);
x. Proceed to actual testing.
3.4.3
Confined compression protocol/actual testing
3.4.3.1
Pre-load stage
1. Zero the force;
2.
Lower the indenter until it reach 0.3 N of force on the 9mm chamber, with a speed of contact of 0.2mm/min.;3.4.3.2
Confined compression load period
1. Raise the load cell 100µm with a speed of 0.02mm/min;
2. Lower the load cell with a speed of 0.02mm/min, until it reaches 0.3N on the 9mm chamber (this will indicate the contact with the sample);
3. Step – wise compression test:
1 step of 0.3N contact force for the 9mm chamber with a relaxation period of 12h;
19
4
Results
4.1
Swelling measurement
Samples were put inside Eppendorf vials (without medium) for further lyophilization. All the swollen state weights have the weight of the Eppendor vial, so it is necessary to subtract the Eppendorf weight on each value, adapting the Equation 3.1 in the following equation:
, (Equation 4.1)
being WE, the weight of the Eppendorf vial without any sample. The weight of the empty
Eppendorf vials used to store the samples, the weight of the sample after being immersed in
PBS (“swollen state”) and the weight after lyophilization (“dry state”) was taken with a Sartorius CP 3202P weighting machine. Table 4.1 shows the results of the swelling ratio for the 3 types of samples.
Tabel 4.1 - Swelling ratio of chitosan, ravioli and nucleus pulposus samples Samples Eppendorf empty
weight (g)
Ws - Swollen state weight (g)
Wd - Dry state weight (g)
Swelling (%)
Chitosan 1
0,9800
1,0179
0,9856
681
Chitosan 2
0,9900
1,116
1,0049
847
Chitosan 3
1,000
1,0412
1,0037
1113
Chitosan 4
0,9795
1,1923
1,0123
649
Ravioli 1 (Small)
0,9776
1,2191
1,0232
530
Ravioli 2 (Medium)
0,9800
1,2810
1,0202
749
Ravioli 3 (Medium)
1,0017
1,2610
1,0546
490
Ravioli 4 (Medium)
0,9900
1,2487
1,0279
683
Ravioli 5 (Medium)
0,9727
1,1124
1,0262
261
Ravioli 6 (Medium)
0,9839
1,1089
1,0171
376
Ravioli 8 (Big)
0,9747
1,2622
1,0405
437
Nucleus Pulposus 1
0,9800
1,0260
0,9972
268
Nucleus Pulposus 2
0,9900
1,0230
0,9955
598
Nucleus Pulposus 3
1,000
1,0356
1,0082
433
Nucleus Pulposus 4
0,9735
1,1954
1,0350
361
Nucleus Pulposus 5
20
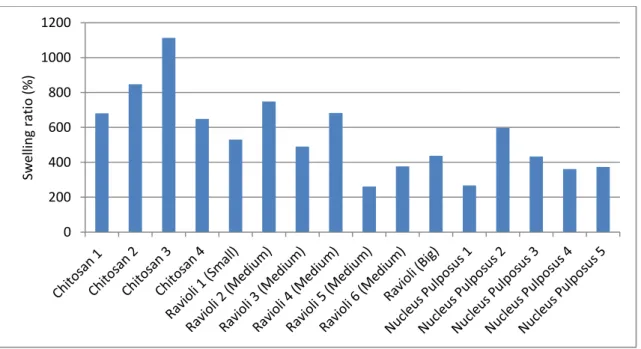
Figure 4.1 represents a bar graph showing each value of swelling ratio.
Figure 4.1 - Graph showing the swelling percentage of each sample
4.2
Rheology
Four chitosan samples were tested in the rheometer. For all samples frequency sweep test were performed, in 3 different states: initial condition state or uncompressed state (taken directly from the mold), compressed state (10% of the initial height compressed) and decompressed state (after 10% compression). Also, on all samples strain sweep test were performed. However, only on samples 3 and 4 were performed time sweep tests. Nucleus Pulposus and “Raviolis” samples were not tested.
21
4.2.1
Frequency sweep results
22
23
24
4.2.2
Time sweep results
Only on sample 3 and 4 were made time sweeping test.
25
4.2.3
Strain sweep results
Figure 4.6 - Strain sweep result from sample 1
4.3
Compression testing
Throughout the years studies on the IVD or NP have looked at the effect of different loading regimes, such as compression, tension and hydrostatic pressure. [36] Since the NP sustains mainly compressive loads, it is crucial to study the compression behavior of any material that might replace the NP.
26
4.3.1
Modeling the mechanical behavior of cartilage
Cartilage´s rheological behavior is a combination of the intrinsic mechanical properties of the solid and the liquid phases and the interaction between them. Throughout time, the process of modeling cartilage has evolved from single phase analytical models, where cartilage was modeled as a linear elastic solid, to biphasic analytical models.
The single phase analytical models disregarded the time-dependent component, assuming cartilage to be an isotropic and linear elastic solid. However, more comprehensive models needed to be formulated, which incorporated the fluid phase of the tissue. These were called the biphasic models.
The biphasic theory, developed by Mow and coworkers in 1980, represented cartilage as consisting of two immiscible phases, a solid phase (collagen-proteoglycan matrix) and a fluid phase (interstitial fluid). Both phases were assumed incompressible, while the solid phase was assumed to be homogeneous, isotropic, permeable and linearly elastic and the liquid phase was assumed to be non-viscous. [37]
Several models have been used to study the relaxation of complex systems. One of these models is the stretched exponential function (equation 1), or Kohlraush decay function, frequently used as an empirical decay law. A stretched exponential function describes, in general, a decay function with two regimes. This function has the advantage of fitting the creep curve with a minimum number of parameters, allowing the determination of the indicators of the creep of the intervertebral disc. [12, 28]
The stretched exponential function is of the form:
(Equation 4.2)
Where t is the elapsed time, the time constant, the stretch parameter, d0 is the creep
(pressure) at t=0 and d is the pressure at equilibrium (when t is infinite).
Curve fitting was made through a stretched exponential function to the measured creep curves. Three parameters , and d determine the shape of the stretched exponential as a function of
27
4.3.2
Compression test results
Compression tests were made for 7 samples of each type:
2 samples of Nucleus Pulposus;
4 samples of “Ravioli” (1 with higher HM content, 2 with medium HM content and 1 with the small HM content);
1 Chitosan sample).
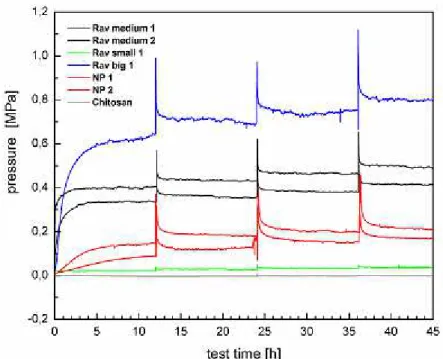
Figure 4.7 shows the result of the compression test of all samples.
Figure 4.7 -Overview of the compression tests results of all samples. The blue line is the result of the
Ravioli with the biggest content of HM gel (37mg). The black lines are the results of the Raviolis with 24mg
28
4.3.3
Nucleus Pulposus
results
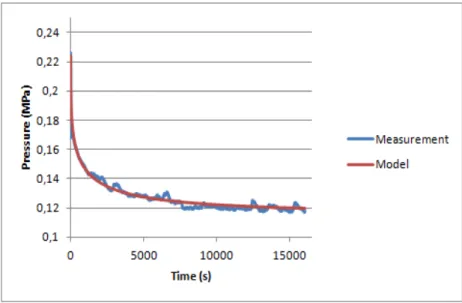
Figure 4.8 – 1st
creep curve result from the Nucleus Pulposus sample 1, with the respective curve fitting
Figure 4.9 -1st creep curve result from the Nucleus Pulposus sample 2, with the respective curve fitting
Creep curves from both samples show a first fast decay of pressure, stabilizing after to reach an equilibrium pressure, as seen in figures 4.8 and 4.9.
The increase of initial pressure throughout the experiment is patent on both samples. Equilibrium pressure is a little higher on NP2 sample than NP1 sample.
29
Table 4.1 Summary of the parameters of the Nucleus Pulposus samples 1 and 2, retrieved from the fitting
NP1 d d0 Error R2
1st curve 515,23 0,36 0,116 0,249 0,205 0,524
2nd curve 438,40 0,39 0,159 0,373 0,224 0,984
3rd curve 225,08 0,39 0,170 0,445 0,589 0,971
NP2 d d0 Error R
2
1st curve 582,63 0,43 0,185 0,315 0,147 0,984
2nd curve 524,38 0,39 0,201 0,403 0,550 0,973
3rd curve 448,44 0,38 0,211 0,456 0,520 0,980
4.3.4
“Ravioli”
results
3 types of “raviolis” (Nicast) were tested, being the difference between them, the Hydromed gel content (13,1 mg HM, 24 mg HM and 37 mg HM).
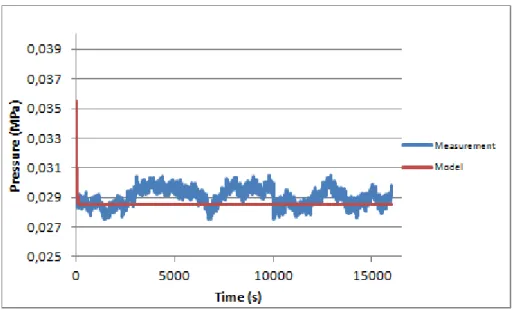
Figure 4.10 - 1st creep curve of RavSmall with the respective fitting curve
The three creep curves (the first curve shown on figure 4.10 while the second and third are in Appendix section) of this sample show the presence of noise, which makes the fitting very difficult. Therefore, results from the fitting are not reliable, as showed on table 4.2, where the R2 is very low.
Table 4.2 – “Ravioli Small” fitting parameters summary, for each creep curve
“Ravioli” Small
d d0 Error R2
1st curve 36,06 1,00 0,03 0,04 0,00 0,10
2nd curve 34,54 1,00 0,03 0,04 0,00 0,07
3rd curve 30,03 0,26 0,04 0,04 0,02 0,36
30
Figure 4.11 -1st creep curve of RavMedium1 sample, with respective curve fitting
Table 4.3– Summary of curve fitting parameters of each curve from Ravioli Medium1 and Ravioli Medium 2 samples
“Ravioli” Medium1
d d0 Error R2
1st curve 56,76 0,23 0,492 0,569 0,44 0,77
2nd curve 1471,44 0,71 0,466 0,501 1,22 0,64
3rd curve 69,53 0,29 0,433 0,653 0,971 0,84
“Ravioli” Medium2
d d0 Error R2
1st curve 249,93 0,15 0,344 0,469 0,560 0,82
2nd curve 119,38 0,28 0,381 0,506 0,330 0,90
3rd curve 106,29 0,41 0,415 0,576 0,237 0,93
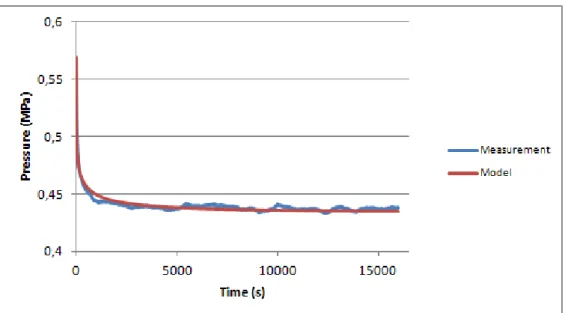
Finally, the “Ravioli” with the highest HM content show a similar mechanical behavior compared to the Nucleus Pulposusand the “RavMedium” samples, as seen in figure 4.12.
Figure 4.12 -1st creep curve of the “Ravioli Big” sample with the fitted curve
0,6 0,65 0,7 0,75 0,8 0,85 0,9
0 5000 10000 15000
31
Results show an increase of pressure from curve to curve, as expected due the increase of compression between each curve. The fitting results show a little increase of during compression, while has an average of 0, 3766 (SD=0,085) and equilibrium pressure (d) has
an average of 0,7466 (SD = 0,047). Table 4.4 summarizes the results of the fitting.
Table 4.4 - Parameters of “Ravioli Big” retrieved from the fitting in all creep curves
“Ravioli” Big
d d0 Error R
2
1st curve 226,34 0,38 0,71 0,89 0,56 0,926
2nd curve 313,14 0,29 0,73 0,97 1,186 0,922
3rd curve 342,18 0,46 0,80 1,01 0,565 0,958
4.3.5
Chitosan result
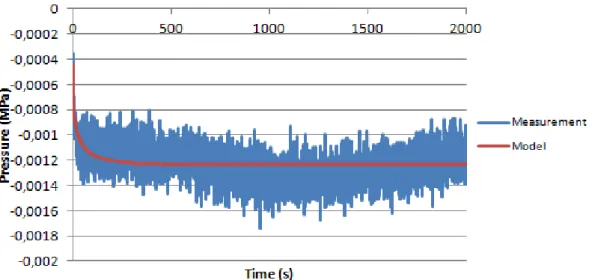
Chitosan sample did not present significant pressure, as seen in Figure 4.13, making this sample hard to analyze.
Figure 4.13 - 1st creep curve of the Chitosan sample and respective fitting
Fitting these curves was difficult, due to a very low pressure change, turning the results quite unreliable, as demonstrated by the R2 (results are summarized in table 4.5). The results show that this sample is not a possible candidate to replace the Nucleus Pulposus, therefore should be discarded as a NP replacement.
Table 4.5 – Chitosan curve fitting parameters
Chitosan d d0 Error R2
1st curve 20,00 0,50 0,00 0,00 0,00 0,042
2nd curve 11,74 0,50 0,00 0,002 0,00 0,056
32
5
Discussion
5.1
Swelling measurement
It is clearly seen that all three types can imbibe water several times its own dry weight. The swelling ratio demonstrates chitosan´s big capability of imbibing water, over passing the NP capability, except sample nucleus pulposus 1. The range of swelling ratio agrees with values mentioned in literature. [29]
The water retention is a relevant characteristic for any NP replacement. Without this feature, the possibility of building up pressure inside the gel is diminished, compromising the height regain after compression and therefore the maintenance of the mechanical properties. Also, it has been seen that mechanical cues, provided by the hydrostatic pressure, are essential for cell survival inside the NP and the vehicle to provide nutrients and waste removal.
5.2
Rheology
5.2.1
Frequency sweep test
Frequency tests showed that the storage modulus (G´) is substantially higher than the loss modulus (G´´). This means that the gel is predominantly elastic, as shown in figure 4.2 (the rest of the results in the Appendix section, figures 7.1, 7.2 and 7.3). Furthermore, the frequency sweep test showed a very weak dependence between the frequency and both modulus (G´and
G´´). This feature is demonstrated by the relatively straight lines of the storage and loss modulus throughout the range of frequency.
Also, it is clear that the stiffness is affected at difference states. G´ becomes larger when the gel is compressed, as expected, and partially recovers when the gel is decompressed in samples 1, 3 and 4. Only the sample 2 (figure 7.5 in the Appendix section) shows a different storage modulus after compression. All results from this sample are different from the other samples. This might be due to a possible damage to the sample, from the transfer of the petri dish to the rheometer.
The loss modulus (G´´) doesn´t suffer big alterations between all states, except with sample 2 (figure 7.8 in the Appendix section), due to the possible reason stated previously. The results of the frequency sweep of G´ and G´´ indicates that there are little structural changes of the chitosan gels during the process of compression/decompression.
5.2.2
Time sweep test
33
5.2.3
Strain sweep test
Since this test is a destructive test, it was decided to be performed as the last test of rheology. The strain sweep results show a typical strain-overshoot behavior, with G´decreasing and G´´
increasing to a local maximum. This has been observed in many other polymeric materials and is related to the evolution of the microstructure within the gel. This decreasing of the storage modulus and increasing of the loss modulus might be due to some clustering of the microstructure, which leads to the softening. As such, the strain sweep test is useful to give a better idea about what is actually happening, at a microscopic level, when the gel is subject to some mechanical loading.[38]
5.3
Confined compression
It is clear that large differences are visible for each type of sample. Nucleus Pulposus samples
reveal similar results between them, as well as the “Ravioli medium” samples. The swelling behavior of the “Raviolis” samples (Rav Medium and Rav Big) resemble the characteristics
observed in the NP samples but with a more elastic response (shorter time constant). After an equilibration phase, all samples, except chitosan, show a steady increase of the equilibrium pressure with decreasing volume of the confined swelling chamber during the stepwise compression protocol. Each compression step is accompanied by a strong peak of pressure due to incompressible behavior of the water inside the Nucleus Pulposus or the HM of the
“Raviolis”. Higher pressures were measured in the “ravioli with the biggest content of the Hydromed gel content. The chitosan and the “ravioli small”, with the lowest HM gel content,
34
6
Conclusion and future perspectives
The aim of the project was to define a basic testing protocol to achieve a quantitative characterization of the mechanical properties of any hydrogel proposed to function as a substitute of the Nucleus Pulposus. This was done successfully by employing three types of tests: swelling measurement, rheological studies and confined compression.
Swelling measurement results demonstrates the high capacity of water bidding of the chitosan, HM and NP. Also, it was seen that the swelling percentage of the Raviolis and the NP are in similar ranges, with chitosan surpassing them.
Rheological results showed a predominant elastic behavior on the chitosan gel with G´ being higher than G´´. Frequency sweep tests showed a very weak dependence between the frequency and both modulus (G´and G´´) while strain sweep show a typical overshoot characteristic seen on other polymeric materials. This typical overshoot is possible related to an evolution on the microstructure of gel with the application of the mechanical load. Nevertheless, time sweep and frequency tests show that this clustering might be minimal, because G´and G´´ maintains their values throughout the protocol.
Confined compressive tests compared the mechanical response to load in three types of materials: the goat Nucleus Pulposus, chitosan gel and a biomimetic nano-fiber scaffold filled with hydromed gel denominated “Ravioli”. The confined compression results showed that the
Nucleus Pulposus and the ”Raviolis” samples were able to build up hydrostatic pressure after a compression stage. All samples show a steady increase of the equilibrium pressure with the increase of compression, due to the stepwise compression protocol. However, only NP and
“Ravioli” (medium and big HM gel content) samples showed a strong peak of pressure, at each compression, due to the incompressible behavior of the water in the NP and HM gel structures. Fast decay of pressure is seen in all NP and “Raviolis” samples, leveling out to a new equilibrium pressure. The equilibrium pressures ranged from 0.1 to 0.2MPa for the Nucleus samples, while the Raviolis built up pressures depending on their HM content (Rav small- 0.02 to 0.05MPa, Ravi medium- 0.3 to 0.5MPa and Rav big 0.6 to 0.8MPa). Chitosan gel did not produce any viable result. It showed a lack of pressure build up after compression, probably due to the crosslinking of the gel. The high water quantity, seen in the swelling measurement, may come from the gels production stage and not from any water embedment throughout the compression stage. Therefore, these gels cannot be used as a NP replacement.
In short, a testing protocol was produced to analyze any possible material to replace the
Nucleus Pulposus. The combination of mechanical compression test, rheological test and swelling analysis, proves to be essential when determining the suitability of the material from NP replacement. However, confined compression should be the core test to perform on any NP
replacement material, due to the importance of seeing if the replacement material can “build up”
hydrostatic pressure and, therefore, restoring height.
Future perspectives should address the continuous development of the confined compression
35
36
References
[1] A.C. Borges et al., Curing kinetics and mechanical properties of a composite hydrogel for the replacement of the nucleus pulposus, Composites Science and Technology 70 (2010) 1847 – 1853
[2] Whatley B.R., Wen X., Materials Science and Engineering C 32 (2012) 61-77
[3] J.P. Urban, Rita Kandel, Sally Roberts, Tissue engineering and the intervertebral disc: the challenges, Eur Spine J (2008) 17 (Suppl 4): S480 – S491
[4] McCann M. et al., Tracing notochord-derived cells using a Noto-cre mouse: implications for intervertebral disc development, Disease Models & Mechanisms 5, 000-000 (2012) doi:10.1242/dmm.008128
[5] Xinlin Yang, Xudong Li, Nucleus pulposus tissue engineering: a brief review, Eur Spine J (2009) 18: 1564 – 1572
[6] S. Gokorsch et at, Stiulating Extracellular Matrix Production By Intervertebral Disc Cells – Description of a New Bioreactor, BioProcess International (2003) 49 – 51
[7] Jeremy J. Mercuri, Dan T. Simionescu, Advances in Tissue Engineering Approaches to Treatment to Intervertebral Disc Degeneration: Cells and Polymeric Scaffolds for Nucleus Pulposus Regeneration, Adv Polym Sci (2012) 247: 201 – 232
[8] Domagoj Coric, Praveen V. Mummaneni, Nucleus replacement technologis, J Neurosurg Spine (2008) 8: 115 – 120
[9] A. Joshi et al., Functional compressive mechanics of a PVA/PVP nucleus pulposus replacement, Biomaterials 27 (2006) 176 – 184
[10] Nandan L. Nerurkar et al., Mechanical design criteria for intervertebral disc tissue engineering, Journal of Biomechanics 43 (2010) 1017 – 1030
[11] Jigar V. et al., A review on novel in situ polymeric drug delivery system, International Journal of Pharmaceutical Research and Development, Vol 3 (5): July 2011 (53 – 59)
[12] Van der Veen, A. J. (2009), Mechanical behavior of the intervertebral disc under sustained compressive loading (Doctoral Dissertation, Vrije Universiteit, 2009)
![Figure 3.1 - Schematic of the vapor gelation process used in this work (adapted from [34]) and custom made vapor chamber](https://thumb-eu.123doks.com/thumbv2/123dok_br/16694671.743773/34.892.143.767.50.281/figure-schematic-vapor-gelation-process-adapted-custom-chamber.webp)