Delfim Diniz Costa
Licenciado em Ciências de Engenharia Mecânica
Proposal of a methodology for the
design of the installation of turrets on
aircrafts – the approach on the
aerodynamic influences
Dissertação para obtenção do grau de Mestre em
Engenharia Mecânica
Orientador: Prof. Doutor Daniel Vaz, Professor Auxiliar,
FCT/UNL
Co-Orientador: Prof. Doutor António José Freire Mourão,
Professor Associado, FCT/UNL
Co-Orientador: Eng. João Rui Duarte, OGMA
–
Indústria
Aeronáutica de Portugal, S.A.
Júri:
Presidente: Prof. Doutor João Cardoso, Professor Auxiliar, FCT/UNL Vogal: Prof. Doutor Daniel Vaz, Professor Auxiliar, FCT/UNL Arguente: Mestre Rui Pereira, OGMA – Indústria Aeronáutica de Portugal, S.A. Arguente: Doutor Eric Dider, Bolseiro de Pós-Doutoramento do LNEC, DHA, Núcleo de Portos e Estruturas Marítimas
Proposal of a methodology for the design of the installation of turrets on aircrafts – the
approach on the aerodynamic influences
Copyright @ Delfim Diniz Costa, Faculdade de Ciências e Tecnologia, Universidade Nova de Lisboa
Delfim Diniz Costa
Licenciado em Ciências da Engenharia Mecânica
Proposal of a methodology for the design of the installation of turrets on aircrafts – the
approach on the aerodynamic influences
Acknowledgements
Firstly, I would like to express my sincere gratitude to Eng. João Rui Duarte, for his support throughout the whole thesis development.
Besides Eng. João Rui Duarte, I would like to thank my advisors Professor Daniel Vaz and Professor António Mourão, for their guidance during the work.
I also want to thank Yevhen Doloshytskyy, for his friendship and cooperation during these last few years.
I extend my gratitude to my family, for always being there for me and making this possible.
Abstract
The present work has its origin on the necessity of enabling a design certified company, or DOA (Design Organization Approval), to perform a modification; this modification is the installation of EO/IR (Electro-optical infrared) sensors on aircrafts. The subject of interest in this dissertation lies on the aerodynamic impact of the modification on the aircraft.
The primary purpose of the present thesis is the creation of a methodology that regards the design stage of the modification. This methodology serves as guidance to the DOA design team that is assigned to the design of the modification. The methodology includes a recommendation to the certification of the modification; it contains a method intended to decide the location of the installation of the sensors on the aircraft; it also comprises of a design structure specifically adapted to the modification in study.
Regarding the aerodynamic impact, it is studied the aerodynamic analysis’ tools, which allows one to relate the different stages of design to the most suited tools to each stage.
A case study is performed with the purpose of not only validating the methodology which was created but also to giving a first approach to the preliminary design of the modification. As example, there are used the Lockheed Martin C-130 aircraft and the FLIR Star Safire III sensor.
Resumo
O presente trabalho nasce da necessidade de capacitar uma empresa certificada para projeto, ou DOA (Design Organization Approval), para realizar uma modificação: a instalação de sensores EO/IR (Electro-optical infrared) em aeronaves. De entre vários aspectos necessários estudar, esta dissertação cobre o impacto aerodinâmico da modificação na aeronave.
Como principal objetivo da dissertação está a criação de uma metodologia de abordagem na fase de projeto da modificação. Esta metodologia tem a funcionalidade de assistir a equipa de projeto da DOA no momento em que esta esteja a iniciar o projeto da modificação. A metodologia inclui uma recomendação relativamente à certificação da modificação, um método destinado a decidir a localização dos sensores na aeronave bem como uma organização da estrutura do projecto gerada especificamente para a modificação em questão.
Relativamente ao impacto aerodinâmico, é feito um levantamento das ferramentas de análise aerodinâmica que permite associar as diferentes etapas do projeto aos métodos mais adequados de análise aerodinâmica.
É efetuado um caso de estudo por forma a não só validar a metodologia criada bem como dar uma primeira aproximação do projeto preliminar da modificação em estudo. Como exemplo são usados a aeronave Lockheed Martin C-130 e o sensor FLIR Star Safire III.
Palavras-chave: sensores EO/IR, estudo aerodinâmico, projeto preliminar, metodologia
List of contents
Acknowledgements ... i
Abstract ... iii
Resumo ... v
List of contents ... vii
List of figures ... xi
List of tables ... xv
Acronyms and nomenclature ... xvii
1 Introduction ... 1
1.1 Motivation ... 1
1.2 Objectives ... 3
1.3 Thesis structure ... 5
2 Aeronautical regulation ... 6
2.1 Introduction ... 6
2.2 Structure of regulation ... 6
3 Multi-sensors overview ... 8
3.1 Introduction ... 8
3.2 Most relevant characteristics of the devices ... 9
4 Viability analysis for the turret’s installation location ... 11
4.1 Introduction ... 11
4.2 Criteria that may affect the decision and their hierarchy ... 11
4.3 Checking for dependency between criteria ... 13
4.4 Identification of the possible locations ... 13
4.6 Selection of the location to install the turret ... 17
5 A framework for a design methodology... 19
5.1 Introduction ... 19
5.2 Modification design outline ... 20
5.3 Preliminary design tasks for the methodology ... 24
6 Numerical modelling considerations ... 26
6.1 Experimental and computational approaches in the aircraft design industry ... 26
6.1.1 Available aerodynamic analysis methods ... 26
6.1.2 Applicability of aerodynamic analysis methods in the aircraft design industry ... 27
6.2 Discretization of the fluid flow governing equations ... 30
6.3 Turbulence modeling ... 32
6.4 Meshing ... 37
6.4.1 Structured and unstructured meshes ... 37
6.4.2 Mesh quality ... 39
6.5 Solver ... 40
6.6 Aerodynamic analysis methodology ... 42
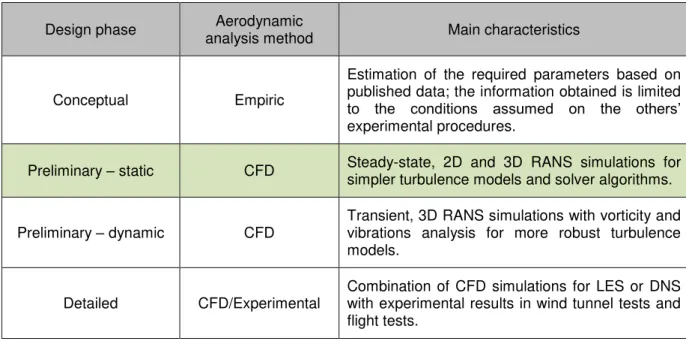
6.6.1 Aerodynamic analysis methods for each design phase ... 42
6.6.2 Guidelines for the aerodynamic analysis ... 42
7 Case study ... 44
7.1 Overview of the aerodynamic analysis ... 44
7.2 Previous work on aerodynamics of turrets ... 44
7.3 Theory of the case study ... 46
7.4 Modeling considerations and geometries ... 47
7.5 Mesh generation ... 49
7.6.1 Pressure coefficient ... 59
7.6.2 Drag coefficient ... 59
7.6.3 Reynolds number ... 60
7.6.4 Mach number ... 60
7.6.5 Reference values ... 61
7.6.6 Projected surface area ... 61
7.7 Flow simulation setup ... 62
7.7.1 Boundary conditions ... 62
7.7.2 Flight conditions ... 64
7.7.3 Solution methods ... 65
7.7.4 Convergence criteria ... 68
7.8 Aerodynamic analysis results ... 69
7.8.1 Validation ... 69
7.8.2 Parametric study ... 85
8 Conclusion ... 88
8.1 Concluding remarks ... 88
8.2 Future developments ... 88
Bibliography ... 90
Annex A ... 93
Annex B.1 ... 96
List of figures
Figure 1.1 – Comparison between commited and incurred costs on different stages of a product
development [2]. 2
Figure 1.2 – The Iron Triangle [3]. 2
Figure 1.3 – The Collar Triangle [4]. 3
Figure 1.4 – Flowchart of the thesis outputs. 4
Figure 3.1 – Example of IR image provided by this type of sensor [10]. 8
Figure 3.2 – Star Safire III – A multi-sensor turret from FLIR [13]. 10
Figure 4.1 – Design Structure Matrix which relates the interdependency of the location criteria. 13 Figure 4.2 – Mapping and labeling of considered locations in the aircraft. 14 Figure 4.3 – Picture of the aircraft Lockheed Martin C-130 with highlighted turrets installed [22].
15 Figure 4.4 – Picture of the aircraft Lockheed Martin C-130 with highlighted turret installed [23].
15
Figure 4.5 – Location comparison matrix. 16
Figure 5.1 – Axiomatic Design – Sequence of design and domain interdependence [25]. 19
Figure 5.2 – Modification design outline. 20
Figure 5.3 – Detailing of the relevant domains and sequence of stages for those domains. 22 Figure 6.1 – Hierarchy of aerodynamic computational tools according to time of development
[28]. 29
Figure 6.2 – Illustration of laminar flow regime path lines (left) and turbulent path lines (right)
[31]. 32
Figure 6.3 – Velocity profiles of laminar flow and turbulent flow near the wall [31]. 33
Figure 6.4 – Comparison between instantaneous and time-averaged velocity contours of a flow
Figure 6.5 – Near-Wall treatments; Wall Function approach (left) and Near-Wall Model
Approach (right) [32]. 36
Figure 6.6 – Typical body-fitted quadrilateral meshes. (Left) C-type mesh; (Right) O-type mesh
[34]. 38
Figure 6.7 – Example of a multiblock mesh [34]. 38
Figure 6.8 – Example of an unstructured tetrahedral mesh [34]. 39
Figure 6.9 – Overview of the segregated pressure-based algorithm (left) and the coupled
pressure-based algorithm (right) [32]. 41
Figure 7.1 – Drag coefficient comparison [35]. 45
Figure 7.2 – Static pressures along the centerline of the turret. [36]. 45
Figure 7.3 – Low pressure wake behind cylinder due to boundary layer detachment [31]. 47
Figure 7.4 – Schematic of the vortices on a flow around a turret [37]. 47
Figure 7.5 –Simulation’s geometry configuration. 48
Figure 7.6 – Comparison between the behaviour of the streamline over two configurations of
turret. (a) simplified configuration; (b) real configuration. 49
Figure 7.7 – View of the full domain of the 2D Mesh. 50
Figure 7.8 – View of the region of interest of the 2D Mesh. 51 Figure 7.9 –View of the turret’s boundary layer of the 2D Mesh. 52 Figure 7.10 – View of the full domain of the 3D Simpler Mesh with a cutout to the center of the
turret. 53
Figure 7.17 – View of a close approach on the turret on the xOy plane of the 3D Refined Mesh. 57 Figure 7.18 – View of the turret on the xOy plane of the 3D Refined Mesh. 57 Figure 7.19 – Bottom view of the domain on the base plane of the 3D Refined Mesh. 58 Figure 7.20 – Close approach on the bottom view of on the base plane the 3D Refined Mesh. 58 Figure 7.21 – Bottom view of the turret on the base plane of the 3D Refined Mesh. 58 Figure 7.22 – Pressure distribution plot on the centerline of the turret for Re = 8,66 × 10⁵. Blue – 2D computational results obtained in this study. Red – 3D computational results obtained in this study. Green – 2D computational results from Schwabacher (2000). Purple – Experimental results from
Snyder (1998). 70
Figure 7.23 – Pressure distributions for centerline cuts through a circular cylinder and a sphere
[44]. 71
Figure 7.24 – Pressure distribution plot on the centerline of the turret for Ma between 0,3 and 0,4. Blue – experimental results from Ceniceros (2007). Red – experimental results from Gordeyev (2007). Green – experimental results from Gordeyev (2007). Purple – 3D computational results
obtained in this study. 72
Figure 7.25 – Comparison between computational 3D results of pressure coefficient for Ma 0,4
from Ladd (2009) [38]. 74
Figure 7.26 – Drag coefficient plot for the validation process. 75 Figure 7.27 – Drag coefficient plot, comparison of simpler mesh and refined mesh. 76 Figure 7.28 – Parametric study of drag coefficient around a turret for Reynolds varying from Re = 102 to Re = 3 × 10⁶. Red – results obtained considering laminar flow. Blue – results obtained considering turbulent flow. Orange – published results for drag of a sphere from Morrison (2013). 85
Figure 7.29 – Comparison of different turbulence models for Reynolds varying from Re = 1 ×
List of tables
Table 2.1 – List of recommended requirements from CS-25 to consider for the installation [6]. . 7
Table 3.1 –List of manufacturers analysed (Data obtained from turrets’ datasheets). ... 9 Table 4.1 –Definition of the most relevant criteria to the turret’s location. ... 12 Table 4.2 –Hierarchy of turret’s location criteria. ... 12 Table 4.3 – Summary of the viable locations. ... 18 Table 5.1 – Description of the modification design outline... 21 Table 5.2 – Description of FD, PhyD and CQD stages. ... 23 Table 5.3 – Preliminary design tasks. ... 24 Table 5.4 – Connection between Functional Domain and Physical Domain. ... 25 Table 6.1 –Comparison of each tool’s characteristics [27]. ... 30
Table 6.2 – Differencing schemes [33]. ... 32
Table 6.3 – RANS based turbulence models [29]. ... 35
Table 7.11 – Separation points for validation case of 𝑅𝑒 = 8,66 × 10⁵. ... 72
Acronyms and nomenclature
AC – Air Conditioning
AD – Axiomatic Design
APU – Auxiliary Power Unit
CAD – Computer Aided Design
CCM – Certification Compliance
Matrix
CD – Customer Domain
Cd – Drag Coefficient
CFD – Computational Fluid Dynamics
CP – Certification Plan
Cp – Pressure Coefficient
CQD – Certification and Qualification
Domain
CS – Certification Specification
DNS – Direct Numerical Simulation
DOA – Design Organization Approval
DSM – Design Structure Matrix
EASA – European Aviation Safety
Agency
EO – Electro Optical
FAA – Federal Aviation
Administration
FD – Functional Domain
FEM – Finite Element Method
IAS – Indicated Airspeed
IR – Infrared
ISA – International Standard
Atmosphere
LES – Large Eddy Simulation
LSCB – Least Square Cell Based
MTOW – Maximum Takeoff Weight
N-S – Navier‑Stokes
PhyD – Physical Domain
ProD – Process Domain
QCM – Qualification Compliance
Matrix
QP – Qualification
RANS – Reynolds Averaged Navier‑
Stokes
TAS – True Airspeed
TI – Turbulent Intensity
1
Introduction
1.1 Motivation
The purpose of this work is based on the necessity of a design certified company or Design Organization Approval (DOA) to be certified on the specific modification of turrets installation on aircrafts. This thesis aims at being a first approach to the modification regarding the aerodynamic concerns and the methods of analyzing the aerodynamic impact of the installation of a multi-sensor turret on the aircraft.
The scope of the work is separated into two fields, the design methodology and the aerodynamic theory and analysis. Since the whole process consists of striving to perform the best modification, which implies the fastest, most economical and technically viable solution, there are not only single technical issues to be tackled; any modification or repair is attached to the design and certification compliance of the entire procedure. This is the reason why it is so important, in the aviation industry, to always account for not only the technical development of a solution but also how the procedure is going to be implemented regarding its organization and the certification requirements.
Simultaneously to the aerodynamic impact study, it is also developed the structural impact and structural design study [1]; combining both studies results in a more complete
amount of information regarding the desired modification.
The major benefit of studying the design phase of a project essentially lies on the amount of commitment on the project on the mentioned phase. Figure 1.1 demonstrates that around 80% of the overall cost of a project is decided by the end of the design phase. This means that regardless of what has been actually invested on the project, by the end of the design stage, most of the decisions for the remaining stages are already made. So a thorough study on the design phase may demonstrate to be very cost-effective.
Other design-related aspect of the motivation for this thesis is the success analysis of the modification. It is in the best interest of the DOA that the modification may be performed successfully. The definition of success is relative so in Figure 1.2 it is represented the Iron Triangle which includes the three most important criteria to check whether a project is successful or not. This method only considers operational criteria; it does not include economical, institutional or regulatory factors that are also relevant to the feasibility of a project.
Figure 1.1 – Comparison between commited and incurred costs on different stages of a product development [2].
Figure 1.2 – The Iron Triangle [3].
Although not specifically approached in this study, a crucial concern to take into account on the modification is aeroelastic phenomena. “The aeroelastic behavior is determined by studying simultaneously the influence of the interaction of vibrational dynamics, structural elasticity and aerodynamics”[4]. As seen on Figure 1.3 the interaction may be described by a
response and flutter (see more on forced response vibration and flutter on [4]). These
phenomena do not occur in every situation on an aircraft, however these are common in many different locations, being one of the main locations of concern the wings.
Figure 1.3 – The Collar Triangle [4].
The development of the present work results from the cooperation between Faculdade de Ciências e Tecnologia – Universidade Nova de Lisboa and the company OGMA – Indústria Aeronáutica de Portugal, S.A..
1.2 Objectives
In order to provide a solution to the DOA entity’s needs regarding a design methodology and an aerodynamic analysis always bearing in mind the regulatory and organizational requirements, the main output of the present work is a methodology tailored to the installation of multi-sensor turrets on aircrafts. This methodology allows the DOA to have a starting point in terms of aerodynamic analysis needs and the study by Doloshytskyy (2015) [1] has the same
purpose regarding the structural analysis and design.
Figure 1.4 is a flowchart describing how the study is conducted. The outputs may be seen as minor objectives required to achieve a well-grounded major objective, being it the group of recommended actions related to the design procedures and the aerodynamic analysis.
As objectives, this work does not include:
The certification compliance procedure for the modification, which may have differences depending on the type of aircraft or the location of the turret installation;
1.3 Thesis structure
The document is composed of eight chapters, being the first the introduction and the last the conclusion. As mentioned it regards two principal technical fields, the design methodology and the aerodynamic analysis.
The second chapter is related to the regulatory context of the modification. It gives a brief context of the existing regulations and also a recommendation of the requirements needed to comply for the certification of the procedure.
The third chapter is a brief overview of the equipment to be installed, the multi-sensors. Its applicability, main characteristics and functionalities are presented.
The forth chapter is related to the viability of the turret’s locations to be installed on the aircraft. It regards the methodology created to choose the location for the installation of the turret on the aircraft; the methodology includes criteria that are applicable to other types of aircraft.
On the fifth chapter, the specific design methodology of the modification is addressed. A contextualization of the specific design methodology with the axiomatic design theory is done. Several layers of the methodology are constructed with increasingly amounts of detail on each one. In this methodology the intent is to optimize the existent design procedure of the DOA to the particular modification required.
Chapter six is: an overview of the aerodynamic analysis tools, the numerical computation considerations and a group of recommendations for the DOA relating the most suitable tools to apply in each stage of design. It also regards a set of considerations regarding the specific preliminary design steps. One of the purposes of this chapter is for the reader to have an extensive view of which are the most expedite tools, as well as the most precise ones. This information allows one to decide which tools to apply in which stages of the project.
On the seventh chapter, an example analysis is performed, a case study that includes every step of the preliminary CFD analysis.
2
Aeronautical regulation
2.1 Introduction
For the last decades, the aviation industry has been growing exponentially and the enormous increase in air traffic has forced the organization and security measures to be much fiercer. Adding this fact to the obvious reasons of the intent of minimizing the prospect of accidents or incidents regarding airplanes in any way, the creation of regulatory organizations was inevitable. EASA (European Aviation Safety Agency) and FAA (Federal Aviation Administration) are the principal regulators on the aviation industry, being the former the European regulator and the latter the regulator from the USA. The main focus of EASA is the “strategy and safety management, the certification of aviation products and the oversight of approved organizations and EU member states”[5].
2.2 Structure of regulation
The approved organizations mentioned include every company which has interference on any part of an aircraft, being this interference related to maintenance, production, assembly, modification or design, among others. This study is associated to a modification on an aircraft, more specifically to the design of the modification. In order for a company to be authorized to perform the design of the modification is has to be certified by EASA; a company which is certified to conduct designs of modifications or repairs on aircrafts is a DOA.
Among many regulations, there is the CS-25 which is a list of requirements or certification specifications (CS) related to the category of “Large Aeroplanes” in which the Lockheed Martin C-130 in included since it has a Maximum Takeoff Weight (MTOW) higher than 5670 Kg. This list includes regulations regarding every aspect of the design, characteristics, operations and security of an aircraft.
Table 2.1 – List of recommended requirements from CS-25 to consider for the installation [6].
Subpart Requirement Description
B
25.103(d) Stall speed
25.251 Vibration and buffeting
C
25.335 Design airspeeds
25.341 (a) and (b) Gust and turbulence loads
25.415 Ground gust conditions
F
25.1301 Function and installation
25.1302 Installed systems and equipment for use by the flight crew
25.1309 Equipment, systems and installations 25.1321 Arrangement and visibility
25.1322 Flight crew alerting
25.1431 Electronic equipment
G
3
Multi
-
sensors overview
3.1 Introduction
Electro Optical and Infrared sensors (EO/IR) cover a wide range of distinct technologies based on the targets and missions to be accomplished being these in aerial, ground or maritime environments. The particular sensors subject to this study are airborne observation systems. Depending on the application, several devices can be integrated in a turret that is installed on the aircraft. The EO/IR sensors are usually the most valuable to the mission. These multi-sensors are frequently referred as EO/IR multi-sensors alone, however this is not accurate. These sensors are suitable for detecting, acquiring, auto-tracking and identifying targets at long ranges.
These systems are a major asset for the aircrew in many operations, such as: Search and rescue
Intelligence, surveillance and reconnaissance Border and coastal patrol
Force protection
In many scenarios, the ability to monitor the area of interest from high altitudes is an indispensable factor in the security or safety equation of an operation. Multi-sensor systems are fit for observing major events and demonstrations, coastguard missions, search and rescue operations and police actions. Observers are afforded a clear overview of the site even in adverse climatic conditions; command and control staff can see details on images which in other way would be impractical. This insight enables prompt intervention providing the crew precious time when under threat [7] [8] [9].
To give an idea of the image provided by these devices, Figure 3.1 is a representative infrared image available to the aircrew.
3.2 Most relevant characteristics of the devices
Since the sensors are not standard, their manufacturers are free to create products tailored to their clients’ needs. A brief market research is undertaken allowing one to understand the typical characteristics of these sensors as well as which are the major manufacturers. Regarding the present study, the sensors’ characteristics considered relevant are those which influence structural and/or aerodynamic parameters – sensor’s dimensions and weight, given that their geometry is similar. In Table 3.1 there is a list of manufacturers with their respective products’ dimensions and weight.
In order to ease the amount of work for the DOA by adapting a real problem to this study, there is the concern to use a sensor similar to most of the used models. Hence, the selected model – highlighted on Table 3.1 – is the one which its installation seems the most frequent and also the one with the average dimensions and weight.
Table 3.1 – List of manufacturers analysed (Data obtained from turrets’ datasheets).
Manufacturer Model Weight (Max) [kg] Diameter [m] Height [m]
Airbus Defense & Space
Arghos II [11] 43 0,450 0,500
Goshawk II [11] 30 0,450 0,350
Raytheon NA/AAS – 52 [12] 60 0,457 0,193
FLIR Star Safire III [13] 44 0,380 0,450
General Dynamics V – 14 [14] 70 0,447 0,503
Northrop Grumman NA/AAQ-28(V)
[15] 210 0,406 -
Lockheed Martin INFIRNO [16] 59 0,401 0,541
L-3 Wescam
MX-15 [17] 45 0,394 0,481
MX-20 [18] 90 0,533 0,667
MX-25 [19] 100 0,653 0,767
RAFAEL Toplite EOS [20] 65 0,594 0,662
Regardless of the variations/differences there may be between these sensors, being it due to the different applications or just different manufacturers, there are common devices in every sensor analyzed, which are:
Multi-spectral sensor – This sensor allows the sensor to operate in poor conditions – fog, smoke, haze, dust, rain.
Daylight imager – Regular camera that provides visual image
Lowlight imager – Sensor that take in small amounts of visible light, magnifies it greatly, and projects that on a display
Laser rangefinder – Determines the distance to a target or object Laser pointer/tracker – Helps in locating the target on the image
Figure 3.2 illustrates Star Safire III – a multi-sensor turret from FLIR. From the image one can also perceive the variety of lenses in the turret, which suggests a variety of functionalities present on the device.
4
Viability analysis for the turret’s installation
location
4.1 Introduction
There are many locations where the multi-sensor turret can be installed on the aircraft. “Where to install it?” is a question that can have several answers, there is not a right one. Checking each location for preset criteria is usually an adequate decision-making procedure. The way one looks at this decision is subjective hence there is the need to create a methodology to assure that the result has grounds to be considered a “good” or “acceptable” result. The methodology adopted to analyze the locations is as follows:
I. Listing of all the criteria that may affect the decision;
II. Sorting of the criteria based on its priority and its consequent influence on the decision;
III. Ranking, in tiers, of each criterion by priority; IV. Checking for dependency between criteria;
V. Identification of the possible locations;
VI. Mapping of the most adequate locations to install the sensor; VII. Selection of the location to install the turret.
4.2 Criteria that may affect the decision and their hierarchy
In this subchapter the first three phases are described. Regarding the initial phase, the listing of all the criteria is done through brainstorm trusting the engineering judgement and experience. This phase considers operational, structural and aerodynamic issues as well as costs and aircraft maintenance, yet in a generic manner.
Table 4.1 relates the most relevant criteria to the justification for its consideration as the most relevant. Based on each criterion’s definition, these are sorted by influence on the decision of the location. There are eight criteria; criterion 2 is divided into five types of interference in order to have a clearer idea of what kinds of interference there are.
Table 4.1 – Definition of the most relevant criteria to the turret’s location.
Criterion Comment
1. Sensor’s sight range It was determined as one of the major needs of the system. From an operational point of view, it is mandatory that the sensor has a wide range of sight.
2. Interference with other
parts This criterion includes every kind of interference there may be. It is considered to be high priority since one must analyze if there is something already in that location.
3. Possible damage to the
sensor Possible damage to the sensor implies a shortage to the device's longevity, which creates the need for regular maintenance. Makes the modification lose its purpose in a client's point of view.
4. Pressurized areas of
the aircraft Concerns the difficulties that are imposed by the structural complexity of a pressurized area. Preference is given to the non-pressurized areas of the aircraft since there is the need to create an external structure on the pressurized areas to minimize the influence of the modification on the structure.
5. Sensor's Characteristics
- Aerodynamic impact Can be responsible for certain changes in the performance parameters of the aircraft. Although it is not a mandatory factor, it can rule out some options.
6. Sensor's Characteristics
- Structural impact Can dictate the magnitude of the support system for the turret. Regards the dimensions of the turret in a way that a certain location may need a different type of structure to be able to support the turret.
7. Structure's integrity In a first approach to the issue, one must consider the fragility of the aircraft's local structure since it gives an approximate idea of how difficult the modification is.
8. Modification's
complexity Criterion that regards the eventual cost and size of the whole process of the modification. It is a gathering of the most important issues taken in consideration for the selection of the location.
Table 4.2 – Hierarchy of turret’s location criteria.
Tier Relevance Definition Criterion
1 High Criteria that preclude the location’s viability 1, 2, 3 2 Medium Criteria that restrain the location’s viability 4, 5, 6
4.3 Checking for dependency between criteria
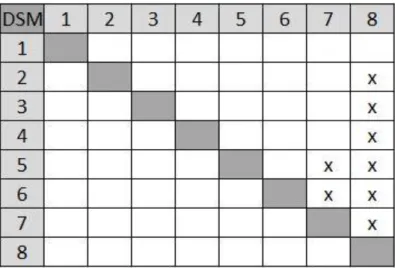
The Design Structure Matrix (DSM) serves the purpose of analyzing the independence between criteria or tasks. To guarantee that the location criteria are independent from each other or at least just have a one-way dependency (one depends on another but not the other way around), the DSM must have a triangular configuration. This tool is useful for managing complex systems since its result allows one to find where a system can be improved [21]. To
this particular case the DSM goes as shown in the Figure 4.1, where it is clear that the criteria in tiers 1 and 2 are independent. Both criteria 7 and 8 are dependent on higher tier criteria which confirms the hierarchy defined on Table 4.2 since it is considered acceptable that a less relevant criterion depends on a higher priority one.
Figure 4.1 – Design Structure Matrix which relates the interdependency of the location criteria.
4.4 Identification of the possible locations
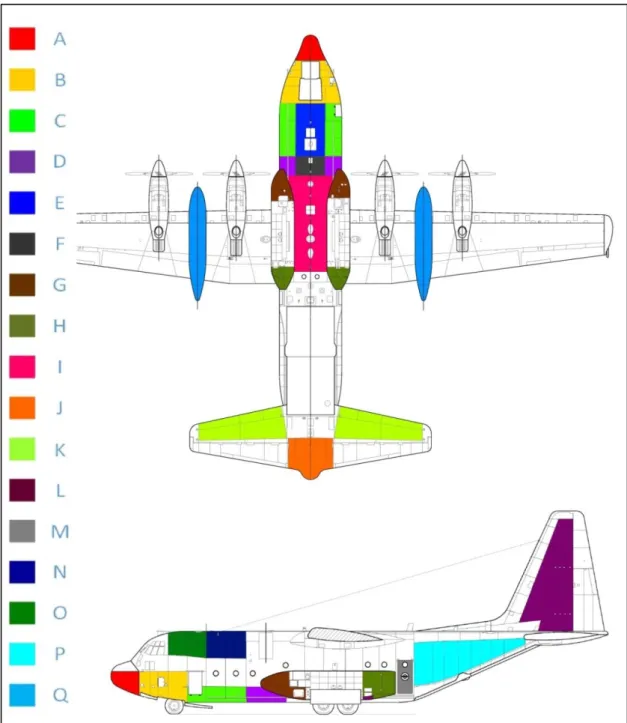
As possible locations, it is considered every part of the aircraft where a fixation of the turret may be feasible disregarding whether it seems logical or not, though keeping in consideration the issues referred in 4.1. To identify each location the aircraft is divided into several areas, from A to Q. Each area is defined as being an area which has the same characteristics in terms of location criteria analysis. In the particular location Q, it is only illustrated the fuel tanks since it is considered the most advantageous location along the wings. Figure 4.2 consists of the bottom view of a Lockheed Martin C-130 with the locations represented and also the side view of the same aircraft.
although, there is a group of four locations that is preferred that corresponds to locations A, B, D and P. On Figure 4.3 and Figure 4.4 are represented current applications installed on this aircraft model. On the aircraft of Figure 4.3 there are turrets simultaneously on three different locations – B, D and P – whereas on the aircraft of Figure 4.4 there is a turret installed on location A.
Figure 4.3 – Picture of the aircraft Lockheed Martin C-130 with highlighted turrets installed [22].
Figure 4.4 – Picture of the aircraft Lockheed Martin C-130 with highlighted turret installed [23].
4.5 Mapping of the most adequate locations to install the sensor
“good” or “bad”. The comparison only allows one to decide which locations are the “better” or “most viable”. At this stage, these criteria help to narrow the possible locations for the study but it is important to state that this is a preliminary stage in which personal judgment is required. For each location, the criteria are evaluated by a three mark system, colors green, yellow and red. Green: the location meets the criteria. Yellow: the location is adaptable to the criteria. Red: The location does not meet the criteria. In Figure 4.5 it is represented the location comparison matrix which uses the marking system to relate the criteria to each location, being the former represented in the rows and the latter represented in the columns.
Figure 4.5 – Location comparison matrix.
As mentioned in 4.2, the criterion 2 is hereby separated into 5 narrower criteria. Since the purpose of the board is to compare each location and each mark is given on a relatively subjective basis, a list of comments on each mark is produced to help one understand the procedure that leads to the final conclusion. The list can be consulted in Annex A. Some of the marks are given based on common sense; however, there is the need to consult technical documentation of the aircraft to ground the evaluation. It is assumed that a location is ruled out as a viable option once it gets at least one red mark. The priority of the criteria defines the way each location is ranked as “better” or “worse”.
the evaluation. On the last row it is possible to see the result of each location’s evaluation being the quantity that there appears the amount of green marks the location has obtained.
4.6 Selection of the location to install the turret
In order to define a coherent evaluating system, two assumptions are made simultaneously to the phase VII, which are: A fixed support structure to the turret is more suitable than a retractable structure due to the sturdiness of the fixed structure which allows less dependency on maintenance and which minimizes the risk of mechanism failure. The other assumption is that regardless of redundancy (which might be a plausible criterion for the client and in which case changes the priorities), needing to install only one sensor is preferred to needing to install more than one due to economical reasons. These assumptions serve the purpose of enabling one to create the comparison matrix in an unambiguous manner by defining both the preconditions and the priorities of all the criteria for the installation of the turret.
Table 4.3 – Summary of the viable locations.
Comments
Recommended Locations
A Interference with Glideslope sensor [24];
Severe impact on the aerodynamics of the turret and aircraft;
B
Need for an external horizontal surface to fix the turret due to the asymmetry of the location;
Not viable from a certain turret dimension;
Possible Locations
C
Need for a lens/turret protection against projectile from the wheels of the landing gear;
Pressurized area – external fixation structure required;
D Pressurized area – external structure required between D and G;
Possible interference with APU or AC systems [24];
G
I Distance to the ground may be critical; Distance between antennas may be critical;
P
Needs a sizable structure that might influence the elevators, aerodynamically;
If in need for redundancy, these are better options;
Q
5
A framework for a design methodology
5.1 Introduction
In order to perform the modification efficiently, there is the need to follow a well-defined methodology. Stages need to be set as guidance to perform a modification as well as milestones to guarantee compliance with the preset targets along the process. An analogy is done between the domains of the Axiomatic Design (AD) and the domains considered to better describe the design methodology.
Axiomatic Design theory is used as a basis for the design of the modification. Figure 5.1 represents the domains considered by the AD methodology, where one may see the sequence of the design tasks from the beginning of the project to the end:
The first concern is related to the customer; defining his needs– Customer Domain
The second concern is about turning what the customer requests into functional requirements applicable to the project – Functional Domain
Then, the functional requirements need to be satisfied by physical solutions based on design parameters; different feasible alternatives that comply with every requirement must be created in order to assess the best solution – Physical Domain
The last domain involves the embodiment of the chosen solution and the process of performing the modification – Process Domain
Figure 5.1 – Axiomatic Design – Sequence of design and domain interdependence [25].
the design of the modification in study. The difference between the generic axiomatic theory and the adapted one is that in the latter, it lacks the retroactive arrows between FD and Customer Domain (CD) as well as between Process Domain (ProD) and PhyD. This is due to the fact that in the FD the customer needs are categorically defined and won’t change because of the functional analysis. Similarly to the ProD, it is only reached once the PhyD is also definitively characterized. Considering the ProD, there may be the need to repeat the entire process due to unexpected limitations, being these related to economical, labor or objective purposes; although it is different from interaction between domains.
5.2 Modification design outline
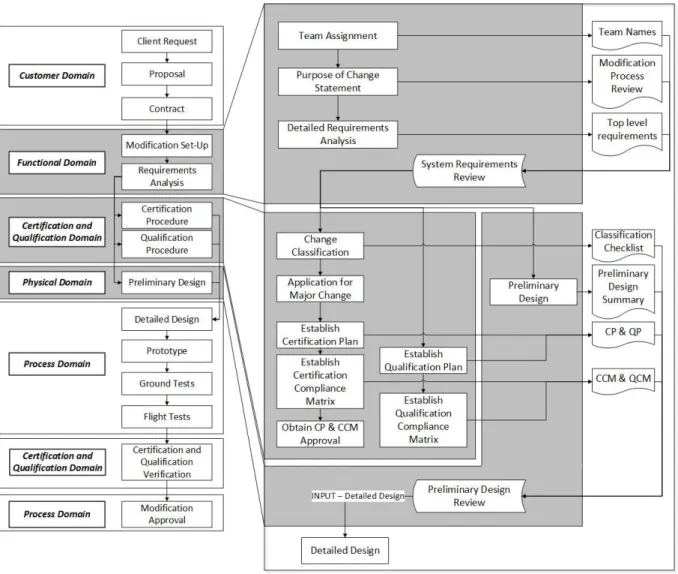
Figure 5.2 demonstrates the outline of the whole project. This modification design overview has the purpose of giving one the comprehension of the whole process and also the purpose of mapping each phase in the AD domains. In Figure 5.2 there is one domain – Certification and Qualification Domain (CQD) – that is not included in the AD methodology. This is on account of certification and qualification not being design needs; these are regulatory needs that do not fit in any of the design domains. It is considered that these needs may affect the process but not in a way to be classified as a functional or physical characteristic. The independence between this external domain and the PhyD is substantiated by the simultaneous actions of the certification and qualification procedures as well as the preliminary design.
Figure 5.2 – Modification design outline.
Table 5.1 – Description of the modification design outline.
Domain Phase Description
Customer Domain
Client Request Initial meetings: Exposing client's needs; Defining fundamental objectives; Scheduling dates for negotiation.
Proposal
Giving the client: Outline of the project; General steps; Budget; Schedule (setting maximums and minimums for the project); Raw order price.
Contract Officializing the project: Predicting results and setting the scope of work.
Functional Domain
Modification Set-Up
Initiating the modification process: Assigning a team; Checking for previous modifications to the system (aircraft or particular component); Marking the dates and references; Stating the description of the change, origin and reason for the change.
Requirements Analysis
Laying out the needed requirements: Analyzing contractual, regulatory, functional, operational and performance requirements which the modifications interfere with; Defining decisive criteria to stand for the stages of the preliminary design
Certification and Qualification Domain Certification Procedure
Preparation of the change certification: Establishment of the activities required to demonstrate compliance with Certification Specification; Identifying of the appropriate means of compliance for each requirement.
Qualification
Procedure If applicable, definition of the plan to demonstrate compliance with client’s requirements
Physical Domain
Preliminary Design
Development of the modification: Generation of different solutions; Choosing the most viable system; Analyzing if the system is actually viable.
Process Domain
Detailed Design
Creating the documentation necessary to perform the change: Models and installation drawings; Material, product and process specifications; Procedures; Reports
Prototype Materializing the solution: Performing the procedure to be subject to further tests
Ground Tests Performing the required ground tests (if applicable) Flight Tests Performing the required flight tests (if applicable)
Certification and Qualification Domain Certification and Qualification Verification
Assurance of the certification: Confirming that the certification status still complies with the regulations
Process Domain
Modification Approval
Since the main focus of the present work is on the viability study of the modification, one must specify the stages which belong to FD and PhyD. These are the domains in which the design solutions are created and the most important decisions are made. Table 5.2 describes the detailing of the mentioned stages. It is also useful to understand the CQD due to its influence on the Preliminary Design (as well as due to the need for the DOA to have more information about these procedures) so it is also considered for more detailing. Figure 5.3 is the result of zooming in on the outline of the project on the referred domains and it has the purpose of showing the depth of analysis on each part of the design.
Figure 5.3 – Detailing of the relevant domains and sequence of stages for those domains.
Table 5.2 – Description of FD, PhyD and CQD stages.
Stage Description Output
Team Assignment Designating the people in charge of the design based on experience and qualification.
Team Names
Purpose of Change
Statement Stating the description and origin of change as well as the purpose for change. Modification Process Review Detailed Requirements
Analysis Defining general requirements from client, equipment and aircraft. Top Level Requirements
Milestone – System Requirements Review
Assuring that the definition of the modification is complete. Relying on experience is essential for this task.
Change Classification Classifying as Major or Minor change. Classification Checklist Application For Major
Change Submitting the application for Major change to EASA. Establish Certification
Plan Identifying the documents and regulation necessary to perform the certification. Certification Plan
Establish Certification Compliance Matrix
Identifying the specific requirements and the respective means of compliance to assure the certification.
Certification Compliance Matrix
Obtain CP & CCM
Approval Submitting CP and CCM to EASA and receive acceptance. Establish Qualification
Plan Identifying the documents and client’s data necessary to perform the qualification. Qualification Plan Establish Qualification
Compliance Matrix Based on the client’s needs, determining the means of complying with those needs
Qualification Compliance Matrix
Preliminary Design
Analyzing the sensor’s possible locations, characteristics, structural link to the aircraft. Simulating the structural and aerodynamic impacts on the aircraft and sensor.
Preliminary Design Summary
Milestone – Preliminary Design Review
The client decides whether the Preliminary Design is acceptable or not. Checking for compliance with all previous requirements.
Necessary Requirements to start
the Detail Design
The reviews – System Requirements and Preliminary Design – need the outputs of every stage as these are the summaries of each domain where the Design Team assesses whether the target for each stage is achieved or not.
need to go back to the Physical Domain or not depends on the manufacturing viability of the system and that is the reason why one must always account for the experience of the Design Team on the Preliminary Design.
5.3 Preliminary design tasks for the methodology
In order to create a more in-depth methodology regarding the Preliminary Design with the purpose of expediting this procedure and preventing the appearance of flaws in the process, there is the need to define, for this particular modification, a set of tasks to perform. There is also the concern of creating an adjustable system, a modular group of tasks that a team may start regardless of the stage of the design process. This concern accounts for clients’ requirements since on one case the client may need the designer to analyze and make every decision thus being the methodology necessary in its entire extent; on the other case the client may already know the model of the sensor, or the specific location to install the equipment, hence the designer only needs to perform a part of the methodology.
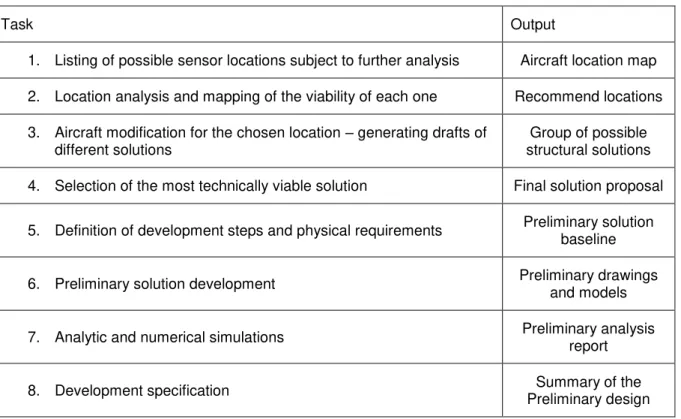
Table 5.3 describes the methodology created to aid the team in performing the preliminary design.
Table 5.3 – Preliminary design tasks.
Task Output
1. Listing of possible sensor locations subject to further analysis Aircraft location map 2. Location analysis and mapping of the viability of each one Recommend locations 3. Aircraft modification for the chosen location – generating drafts of
different solutions
Group of possible structural solutions 4. Selection of the most technically viable solution Final solution proposal
5. Definition of development steps and physical requirements Preliminary solution baseline
6. Preliminary solution development Preliminary drawings and models
7. Analytic and numerical simulations Preliminary analysis report
8. Development specification Preliminary design Summary of the
different criteria. These functional criteria serve as guidance to define the tasks of the Preliminary Design.
Whenever there is the need to make a decision in the Preliminary Design, that decision is based on functional criteria. Table 5.4 lists the link between a few functional requirements and the respective physical domain tasks.
Table 5.4 – Connection between Functional Domain and Physical Domain.
Functional Requirements Preliminary design Tasks
Sensor’s Location: Definition of criteria to
compare location Location analysis and mapping of the viability of each one Support Structure: Definition of criteria to
analyze support solutions Selection of the most technically viable solution Structural needs: Parameters of material
properties and geometry definition
Aerodynamic needs: Parameters of aerodynamic properties and geometry definition
Definition of development steps and physical requirements
6
Numerical modelling considerations
6.1 Experimental and computational approaches in the aircraft
design industry
6.1.1 Available aerodynamic analysis methods
The aerodynamic influence on the turret’s supporting structure is determined considering the airflow over the device with the goal of obtaining the pressure distribution over the turret and consequently, obtaining the aerodynamic force on the device. In order to predict the aerodynamic loads on the structure and eventual aeroelastic phenomena, the currently available tools for aerodynamic analysis are mainly grouped in two branches: Experimental testing which uses wind tunnel to simulate the real fluid flow over a scale model of the (airborne) part; and computational analysis, specifically known as Computational Fluid Dynamics (CFD), in which numerical methods and models are used to numerically solve the governing equations of fluid mechanics. Both methods are also able to consider turbulence, thermal and electric interactions and it now has the capacity of achieving high levels of accuracy.
Experimental methods
In order to predict the fluid flow behavior over a certain obstacle, mathematical equations were developed which represent an oversimplified (inviscid and non-turbulent) flow [26]. The
need for a more reliable way of simulating fluid flow was clear. The test in wind tunnel which replicates the actual flow was thoroughly developed and it has been the most relevant tool for aerodynamics analysis. Frequently one relies on empirical results available in the literature to estimate the approximate values for some stages of the design.
Computational methods
Computational methods started to prove useful for aerodynamics analysis since around 1960. Solving linear flow models for complex geometry became possible using panel methods (see more on panel methods in [28]; these were the first which were suitable for both subsonic
and supersonic flows delivering acceptably accurate results. The development of the first methods for approaching the nonlinear equations of transonic flow took place in the early stages as well. The potential of computational methods was clear and sustained their improvement over time. The efforts during the following decades resulted in the capacity of accurately resolving shock waves and contact discontinuities in compressible flows as well as treating viscous flows and vorticity effects using computational methods. The simultaneous evolution of both numerical algorithms and computational capacity has allowed CFD tools to become faster, economical and more accurate, thus enabling CFD methods to be an essential tool for current aircraft design and aerodynamics analysis [28].
Regarding complex geometries, the major concern is still the mesh generation. Techniques have been achieved based on mathematical transformations. In addition, in the last two decades, unstructured meshes have started to gain wide acceptance. Regardless of the fact that only since nearly 2000 unstructured meshes have started to be used in the industry, Euler and Navier-Stokes methods on this type of mesh have already been thoroughly developed since 1980 [28].
6.1.2 Applicability of aerodynamic analysis methods in the
aircraft design industry
During the distinct phases of design of an aircraft, there are tools which are better suited to each phase than the others. As for the preliminary design, the need is to have an approximate result for flight parameters to narrow down possibilities of configurations and more specifically, to create a prototype of the product; this first approach needs to be fast and economical. Regarding the detailed design, more accurate tools must be used to design components and specific characteristics of the production phase, which in turn compromise the duration and cost of the calculations. Nowadays, the cost of computational analysis is not as determining as it used to be since the once doubted enhanced computational capacity is a reality, the higher order computational schemes are not as avoided as they were, yet it is still a factor to decide whether to apply a lower order scheme on an initial phase or not [27] [28].
schemes, improving convergence to a steady state by using sophisticated acceleration methods, using parallel computing, among others. Another issue around the effectiveness of the use of CFD on industrial environment is the lack of proper interfaces between the CAD models and the CFD simulations. The geometry’s smoothness and continuity requirements needed for flow simulation are occasionally not met [27].
The computational capacity available nowadays is not unlimited. Despite the extreme breakthroughs known in this field in such short period of time, there remain many improvements to be achieved. Simulation of fluid flow requires simplification in order to make the simulation feasible. Real flow phenomena are complex due to nonlinearity or disparities of scales or many other reasons, which increases the amount of computational resources required for the simulation. Consequently, the decision depends on the amount of simplification to apply to which phenomenon or condition and one must ensure that the process remains viable and cost-effective. On a different note than the design phase – which implies a decision on the adequate method to the amount of detail needed for that phase – the decision referred above is on the relation between the resources available and the precise quality of the solution obtained. Figure 6.1 indicates the hierarchy of the models by level of simplification and contextualizes each model by its development decade. It represents the tradeoff between complexity and accuracy of flow simulation and computational resources (time and cost). Reynolds Averaged Navier-Stokes (RANS) models are the latest models represented on Figure 6.1, however, there are also recent methods available like Large Eddy Simulation (LES) and Direct Numerical Simulation (DNS); the former represents a more accurate way of treating flow separation than RANS whereas the latter is a RANS solver for turbulent flows in which velocity and pressure are known as a function of space and time (see more on [29]). LES is computationally highly
demanding and thus there are not many studies applied to tridimensional geometries [30].
Figure 6.1 – Hierarchy of aerodynamic computational tools according to time of development [28].
Table 6.1 – Comparison of each tool’s characteristics [27].
Experimental flow Computational flow
Advantages
Known accuracy of measuring technique;
More quality of results due to real flow. Disadvantages
Scaled geometry; Limited model flexibility; Not always well-defined; Low Reynolds number; Time consuming set-up; Increasing cost over time;
Questionable due to individual skill of aerodynamicist;
Blurry results sometimes;
Advantages
Real size geometry;
Unlimited parameter variations; Known boundary conditions; Real Reynolds number; May have shorter response; Decreasing cost over time; Disadvantages
Unknown errors;
Systematical errors due to equation usage;
Good reproducibility/objectivity;
Flow representation by model approximation;
Limited by computer capacity.
In this work the aerodynamic analysis of a flow over the turret is performed using CFD since it focuses on the preliminary stage of design; A comparison between meshes, solvers and other parameters is performed is order to optimize the CFD analysis. The decision is based on the tools’ comparison showed above.
It is crucial to state that experimental analysis is not replaced by CFD; however this method becomes less used in the initial stages of design. The main purpose of wind tunnel testing is the validation of the computational algorithms and results. The complementary relation between CFD and wind tunnel allows the designer to get an optimum configuration faster and less costly maintaining the reliability of the results.
6.2 Discretization of the fluid flow governing equations
CFD is based on the governing equations of fluid dynamics – continuity, energy and momentum equations – which respectively state that the mass, energy and momentum are conserved. There are two ways of representing these equations: the integral form and the differential form. While in terms of fluid dynamics theory there is not much difference between the two, in terms of CFD algorithms the solutions are distinct [31].
derivative or integral is approximated by differences, resulting in finite differences for the former and finite volumes for the latter [31].
A method normally used to convert a scalar transport equation to an algebraic equation that can be solved numerically consists of integrating the transport equation about each control volume, yielding a discrete equation that expresses the conservation law on a control-volume basis [32].
Several schemes of differencing the continuous governing equations into discrete domains have been developed. The following schemes are the ones which have revealed to be the most relevant for practical use through many years of CFD development. Table 6.2 lists five available differencing schemes and describes the theoretical basis of each one.
Intuitively, each scheme may be more suitable for a particular case than others; there is a reason for the development of each scheme. So there emerges the need to assess which is the most appropriate scheme to use in a particular study; the assessment is based on the trade-off between each scheme’s properties and each scheme’s computational demand.
The differencing schemes are assessed on the following criteria considering their ability to perform [33]:
Conservativeness – The values for the transport variables must be conserved on the entire domain, hence the flux of a certain flow variable that leaves a control volume or cell must be equal to the flux that enters the adjacent cell.
Boundedness – A general transport equation for the conservation of a flow variable has a source term which affects the property of boundedness of a scheme. Previous results from Scarborough (1958) have shown that a sufficient condition for a convergent iterative method may be represented according to the coefficients of the discretized equations.
Boundedness is achieved by diagonal dominance [33]. Another requirement is
that all coefficients of the discretized equations should have the same sign. If the scheme does not comply with the boundedness requirements, the solution may not converge at all or at least it may not be trustworthy.
Transportiveness – Relation between the flow direction and the relative weight of convection and diffusion terms.
Table 6.2 – Differencing schemes [33].
Differencing Scheme Description
Central Considers the central node of the interval to be discretized. Hence it is unable to determine the direction of the flow.
Upwind
Takes into account the direction of the flow since it uses information from the anterior nodes. The solution at a given node is obtained considering the values of the upwind nodes.
Hybrid
For regimes with predominant diffusion, it applies the central scheme for resolving both diffusion and convection terms. For regimes with higher convection, it disregards the diffusion terms and uses upwind. Thus the hybrid scheme is only necessary for situations in which the nature of the flow – being it mostly diffusion in some regions and only convection in others – justifies the partial use of both central and upwind schemes.
Power-law
Fair alternative to hybrid scheme; applies polynomial expressions to evaluate the flow and it has demonstrated to be an accurate approximation to the real values of the transported variables.
QUICK
The Quadratic upstream interpolation for convective kinetics (QUICK) scheme applies a quadratic interpolation for cell face values using three-points upstream-weighted. The value for the transport variable is calculated with a quadratic function with two nodes – one on each side of the cell – and a node upstream the cell. The QUICK scheme is a second order accuracy scheme that provides more accurate results than central and hybrid schemes. It has the advantage of maintaining the upwind-weighted terms.
6.3 Turbulence modeling
Figure 6.3 illustrates the velocity profiles of two boundary layer flows developing over a flat plate; one being laminar and the other turbulent. The average flow velocity near the wall is larger than for the laminar flow. The skin-friction drag is directly related to the shear stress close to the wall, which in turn is directly proportional (for Newtonian fluids) to the velocity gradient at the wall; thus being evident that turbulent flows induce larger skin-friction drag than laminar flows [31].
Figure 6.3 – Velocity profiles of laminar flow and turbulent flow near the wall [31].
Regarding pressure drag, turbulent flows are more capable of resisting the effects of adverse pressure gradients due to their higher kinetic energy near the wall and then flow separation occurs more easily in the laminar regime than in turbulent flows. The resulting wake in turbulent flow separation is smaller than in laminar flows and the pressure drag is therefore, lower [31].
Turbulence flows are characterized by fluctuating velocity fields. These variations also cause the momentum and energy values to vary. In order to make a numerical simulation feasible these small scale fluctuations are modelled by manipulating the Navier-Stokes equations (N-S equations). Averaging the instantaneous governing equations provides a computationally viable group of equations. Nevertheless, there is the need to resolve the additional unknown variables that are originated in the averaging process; these terms are solved using the turbulence models [32]. Figure 6.4 depicts the comparison between the real
Figure 6.4 – Comparison between instantaneous and time-averaged velocity contours of a flow [29].
In CFD, the preference for the usage of a certain turbulence model depends on several factors such as: the amount of accuracy needed, the available resources (time, manpower or funds) and others. It still does not exist an injective relation between the type of flow to be simulated and the turbulence model to be applied.
Since in this work the focus is on the preliminary design stage of the modification and time dependency is not considered, the approach only regards the RANS equations, despite RANS equations being also appropriate for transient state simulations. The LES approach or an eventual hybrid between the two is considered to be more suitable for the detailed design stage which involves more complex transient simulations; it introduces less error on the computation by resolving large eddies using the filtered N-S equations in an unsteady simulation. Instead of modeling time-averaged turbulence accounting for the small scales as RANS implements, LES models the eddies smaller than the filter on the N-S equations and computes the remaining large eddies. Despite having clear improvements in the accuracy of the results, LES needs to resolve turbulent eddies in both space and time domains which in turn also requires more demanding spatial and temporal discretizations; these factors cause the LES method to be avoided for a preliminary stage of design [32].
![Figure 1.1 – Comparison between commited and incurred costs on different stages of a product development [2]](https://thumb-eu.123doks.com/thumbv2/123dok_br/16554895.737301/28.892.264.622.131.526/figure-comparison-commited-incurred-different-stages-product-development.webp)
![Table 2.1 – List of recommended requirements from CS-25 to consider for the installation [6]](https://thumb-eu.123doks.com/thumbv2/123dok_br/16554895.737301/33.892.118.784.152.678/table-list-recommended-requirements-cs-consider-installation.webp)
![Figure 4.3 – Picture of the aircraft Lockheed Martin C-130 with highlighted turrets installed [22]](https://thumb-eu.123doks.com/thumbv2/123dok_br/16554895.737301/41.892.135.762.126.548/figure-picture-aircraft-lockheed-martin-highlighted-turrets-installed.webp)
![Figure 6.1 – Hierarchy of aerodynamic computational tools according to time of development [28]](https://thumb-eu.123doks.com/thumbv2/123dok_br/16554895.737301/55.892.244.648.128.410/figure-hierarchy-aerodynamic-computational-tools-according-time-development.webp)
![Figure 6.4 – Comparison between instantaneous and time-averaged velocity contours of a flow [29]](https://thumb-eu.123doks.com/thumbv2/123dok_br/16554895.737301/60.892.261.632.129.377/figure-comparison-instantaneous-time-averaged-velocity-contours-flow.webp)