States as LBO Specialists: Evidence from Portugal
Rui Alpalhão1 & Paulo Alves21 ISCTE Business School, Lisbon University Institute, Lisboa, Portugal
2 Lusófona University, Lisboa, Portugal &ISCAL, Lisbon Polytechnic Institute, Lisboa, Portugal
Correspondence: Rui Alpalhão, ISCTE Business School, Lisbon University Institute, Avenida das Forças Armadas, 1649 – 026 Lisboa, Portugal. E-mail: rui.alpalhao@iscte.pt
Received: December 6, 2012 Accepted: December 30, 2012 Online Published: April 8, 2013 doi:10.5430/ijfr.v4n2p68 URL: http://dx.doi.org/10.5430/ijfr.v4n2p68
Abstract
The paper’s purpose is to quantify the performance of a State in its action as a de facto LBO specialist, taking companies private to restructure them and subsequently reselling them in the share market. A sample comprising all the listed companies nationalized in Portugal in 1975 and 1976 that were subsequently privatised through a relisting by means of a share issue is constructed. The returns earned by the Portuguese Republic are computed, comparing the market values of nationalised companies at the time of their privatization with their theoretical value in a non-nationalization scenario. A negative abnormal return for the Portuguese Republic’s investment in shares is found. This negative return is much worse than the ones computed in similar work for France.
Keywords: nationalizations, privatizations, LBO, wealth transfers 1. Introduction
In a leveraged buyout, investors take a company private, with a view to recapitalize it, restructure it, and, eventually, take it public again. In most cases, those investors, usually termed “LBO specialists”, are privately-funded and privately-owned organizations. Nevertheless, a few situations occurred in which States took the role of LBO specialists, issuing public debt to take a sizeable number of companies private, and to eventually take them public again. These uncommon situations occurred twice in Europe in recent years: in France between 1982 and 1999, and in Portugal between 1975 and 2003.
In both cases, the State opted for nationalizations in a timing (late seventies, early eighties) where State ownership of companies was becoming a less popular choice among political leaders. After World War II, most mainstream economists, such as the Nobel Prize winners Allais (1947), Meade (1948) and Lewis (1949), were generally in favour of State ownership (Note 1). As time went by, economists began to increasingly favour regulated private ownership (see, e.g., Niskanen, 1971, Buchanan, 1972, Vickers and Yarrow, 1988). Influenced by these theories, politicians took to a privatizing stance that triggered a global privatization wave, usually referred to as beginning with the privatization of British Petroleum, in 1979. (Note 2)
Although this privatization wave spread over the planet rather quickly, specific political circumstances in Portugal and France caused an opposite move. The Portuguese Revolution of 1974, following a pro-communist military coup, led to a nationalization wave (in 1975 and 1976) and to the closing of the Lisbon Exchange between 1974 and 1977 (Alpalhão, 2012). In 1981, the socialist victory in the French elections also led to generalized nationalizations (Langhör and Viallet, 1986). In both cases, a large and spread over the entire economy State-owned sector emerged. The combination of rather disappointing operating results and of an international environment where States were privatizing rather than nationalizing eventually led the French and Portuguese governments to reverse their buyouts in the market. French privatizations started in 1987 and Portuguese privatizations in 1989. The end result of this nationalization – privatization sequence was to make the French and Portuguese States take the de facto role of an LBO specialist in their domestic stock markets. This raises the question, addressed in this paper, of how do the States’ experience compare with that of the privately-owned LBO specialist that took companies private and later did reverse LBO, taking the acquired companies public again. Do the States fare well as LBO specialists, or poorly?
The French experience has been documented in the literature in Dumontier and Laurin (2003). In this paper, we draw conclusions from the dataset of the Portuguese nationalization and privatization sequence. The second section
describes the methodology, the third the dataset, and the fourth computes value changes over the process and concludes.
2. Methodology
We aim at documenting the return on the Portuguese State’s investment in shares of companies taken private in the nationalization wave of 1975-76, and then public again from 1989 on. This return translates into a wealth transfer from all Portuguese citizens to the purchasers of shares in the State’s privatization offers. If the return is positive, the Portuguese citizens in general gain; if it is negative, this wealth transfer is detrimental to Portuguese citizens that did not acquire shares in the privatization offers.
To compute these returns, we compare the market values of nationalized companies at the time of their privatization with their theoretical value in a non-nationalization scenario. This approach is identical to Dumontier and Laurin (2003), although not the most commonly used approach in the literature. Most authors tend to compare the performance of State-owned and non State-owned companies [for instance, Dewenter and Malatesta, 2001; Wei, Varela and Hassan, 2002), or to compare the performance of privatized companies before and after the privatization [for instance, Villalonga, 2000; Harper, 2001; Boubakri and Cosset, 2002; Sun, Jia and Tong, 2002; Bortolotti, D’Souza, Fantini and Megginson, 2002; Boardman, Laurin and Vining, 2003; Wei, Varela, D’Souza and Hassan, 2003; Alexandre and Charreaux, 2005). In both cases accounting numbers are used, introducing biases caused by earnings management and differences in accounting standards, both between industries and between countries. Like Wei and Varela (2003) in their analysis of China’s privatized firms, we use market prices instead of accounting numbers, for two reasons: the conceptual superiority of market prices and the plain fact that the Portuguese data set, like the French data set in Dumontier and Laurin (2003), offers market prices for the companies, both at the nationalization date and after privatization.
3. Data
Our sample includes all the Portuguese companies that were nationalized that meet the following criteria: 1) a listing in Lisbon at the time of their nationalization; and
2) a (second) initial public offer as the first (eventually only) privatization offer.
These criteria can be met by companies that undertook restructuring (mergers or similar operations) while under State-ownership and by companies that returned to the market in their original form. The State cherry-picked the companies to be relisted from the larger set of companies that had been nationalised in 1975 and 1976. These relatively large and well-known new listings played a decisive role in the uplift of the Lisbon Exchange to developed market status, granted by Morgan Stanley in 1997.
Table 1 shows the size of the sample.
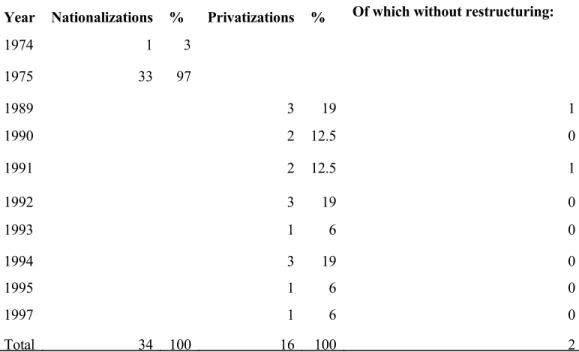
Table 1. Nationalizations of public companies later privatized in public offers
Year Nationalizations % Privatizations % Of which without restructuring:
1974 1 3 1975 33 97 1989 3 19 1 1990 2 12.5 0 1991 2 12.5 1 1992 3 19 0 1993 1 6 0 1994 3 19 0 1995 1 6 0 1997 1 6 0 Total 34 100 16 100 2
This table reports the time series of the Portuguese nationalizations of public companies that were later privatized in public offers. In share issue privatizations made through several offers in different moments in time, the reported year is the one of the first offer.
The 34 nationalizations of public companies that were reversed triggered 16 privatizations, whose initial offers took place between 1989 and 1997. In 1989 only one of the three companies (Banco Totta & Açores) that re-entered the market did so under the same name and without undergoing any corporate restructuring. A comeback to the equity market in an unchanged format occurred only once again, with Banco Espírito Santo in 1991. The remaining 14 privatizations (five insurers, Tranquilidade, Aliança, Bonança, Mundial-Confiança and Império, a brewer, Centralcer, five banks, Português do Atlântico , UBP, Crédito Predial, Fomento and Pinto & Sotto Mayor, a cement producer,
Cimpor, a pulp producer, Portucel, and the electrical utility EDP) were offers of companies that had resulted from
mergers. Our sample comprises all the offerings that meet our requirements, with the exception of the Tranquilidade offer because the privatized Tranquilidade resulted from the merger of the original Tranquilidade and two smaller insurers, Garantia Funchalense and A Nacional, of which only A Nacional was listed in 1974, and with a marginal market capitalization. This makes Tranquilidade substantially dissimilar to a “second” initial public offering. The statistics of the remaining 15 offers are posted in Table 2.
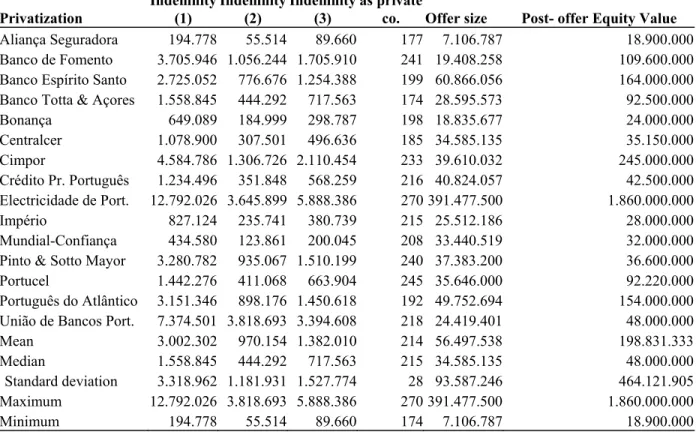
Table 2. Offer characteristics
Privatization Indemnity (1) Indemnity (2) Indemnity (3) Months as private
co. Offer size Post- offer Equity Value
Aliança Seguradora 194.778 55.514 89.660 177 7.106.787 18.900.000
Banco de Fomento 3.705.946 1.056.244 1.705.910 241 19.408.258 109.600.000
Banco Espírito Santo 2.725.052 776.676 1.254.388 199 60.866.056 164.000.000
Banco Totta & Açores 1.558.845 444.292 717.563 174 28.595.573 92.500.000
Bonança 649.089 184.999 298.787 198 18.835.677 24.000.000 Centralcer 1.078.900 307.501 496.636 185 34.585.135 35.150.000 Cimpor 4.584.786 1.306.726 2.110.454 233 39.610.032 245.000.000 Crédito Pr. Português 1.234.496 351.848 568.259 216 40.824.057 42.500.000 Electricidade de Port. 12.792.026 3.645.899 5.888.386 270 391.477.500 1.860.000.000 Império 827.124 235.741 380.739 215 25.512.186 28.000.000 Mundial-Confiança 434.580 123.861 200.045 208 33.440.519 32.000.000
Pinto & Sotto Mayor 3.280.782 935.067 1.510.199 240 37.383.200 36.600.000
Portucel 1.442.276 411.068 663.904 245 35.646.000 92.220.000
Português do Atlântico 3.151.346 898.176 1.450.618 192 49.752.694 154.000.000
União de Bancos Port. 7.374.501 3.818.693 3.394.608 218 24.419.401 48.000.000
Mean 3.002.302 970.154 1.382.010 214 56.497.538 198.831.333
Median 1.558.845 444.292 717.563 215 34.585.135 48.000.000
Standard deviation 3.318.962 1.181.931 1.527.774 28 93.587.246 464.121.905
Maximum 12.792.026 3.818.693 5.888.386 270 391.477.500 1.860.000.000
Minimum 194.778 55.514 89.660 174 7.106.787 18.900.000
This table reports the characteristics of 15 public share offers of (previously public) nationalized companies or of companies resulting from mergers of (previously public) nationalized companies. Indemnities (1), (2) and (3) quantify, respectively, the indemnities paid at the nominal value of indemnities, with TNE class XII and with the weighted average, with chapter 2 weights. Post-offer equity value is the market capitalization of outstanding shares at the close price of the first trading day. All values are in thousands of Portuguese Escudos.
The dependence of the value of indemnities paid in Portuguese nationalizations on payment means is addressed in a detailed fashion in Alpalhão (2012). Portuguese indemnities following the 1974-5 nationalizations were set using as basis the weighted average of audited book value as at the last year before nationalisation (weight of 85 per cent) and the average (Note 3) of high and low stock prices for each of the years between 1964 and 1974 (weight of 15 per cent). Indemnities were paid in cash only up to the amount of 50,000$00 PTE (Note 4)(Portuguese Escudos, the Portuguese currency at the time), and all amounts above that value entitled stockholders to receive tradable governments bonds, called TNE, the acronym of Títulos de Nacionalização e Expropriação (“nationalisation and expropriation securities”).
TNE paid interest, accrued since the nationalisation date and computed at rates varying inversely with the absolute
indemnity value, with a maximum of 13.5 per cent and a minimum of 2.5 per cent (applicable to indemnities above PTE 6,050,000$00 (Note 5)). Market rates, at the time, were in the vicinity of 15% (Valério, 2001).
Taking the nominal value of indemnities as metric, the mean indemnity was of almost precisely three billion PTE (Note 6), with a huge range between the maximum of almost thirteen billion (the electrical utility EDP) and a minimum of 195 million (the insurer Aliança). If, on the other hand, we take the weighted average indemnity using the weights of the thirteen different series of TNE issued (see Alpalhão, 2012, for details), these figures are reduced by 54%, taking into account the fact that the present value of most TNE was severely below their respective nominal value, due to the very modest interest rates most of these securities carried.
These companies spent on average 214 months private, with a small range between a minimum of 174 months (the first privatization, the Totta & Açores bank) and a maximum of 270 months (EDP). This time frame is much bigger than in American SIPO, documented in Muscarella and Vetsuypens (1989) to be of 34 months (for a sample of 74 SIPO that took place in the United States between 1976 and 1983), in Cao and Lerner (2009) to be of 82 months (for a sample of 496 American SIPO between 1980 and 2002) and in Cao (2011) to be of 45 months (in this case for a sample of 594 American SIPO, these taking place from 1981 to 2006). It is also significantly higher than in UK SIPO, which Von Drathen and Faleiro (2007) find to be of 37 months, for a sample of 128 SIPO, listed from 1990 to 2006.
The mean privatization’s size was of 56 billion PTE (19 times the value of indemnities, at nominal value), and the biggest’s (EDP) size was of 391 billion PTE (31 times the value of nominal indemnities). The average market value of privatized companies, at first trading day closing, was of 199 billion PTE (66 times the indemnities), with a maximum of 1.9 trillion PTE accounted for by EDP, that closed at a price corresponding approximately to 145 times the value of indemnities paid to the shareholders of the nationalized companies merged into EDP.
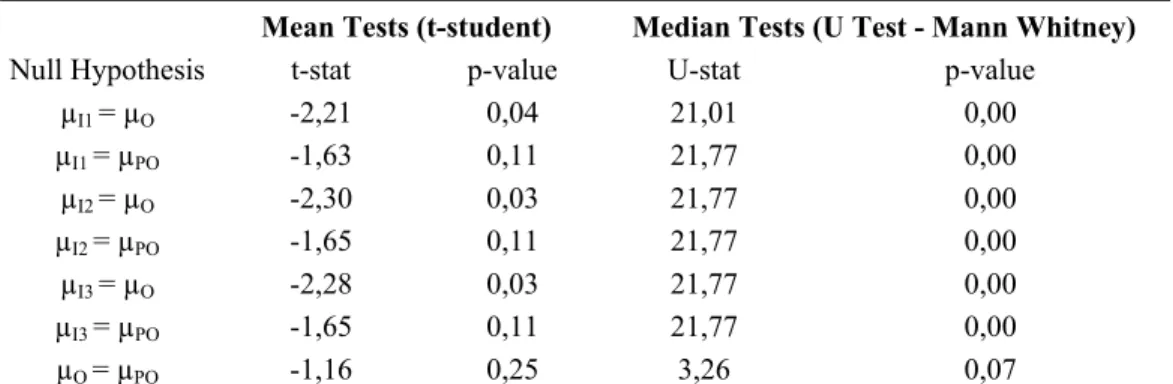
Table 3. Offer characteristics – hypothesis tests
Mean Tests (t-student) Median Tests (U Test - Mann Whitney)
Null Hypothesis t-stat p-value U-stat p-value
µI1 = µO -2,21 0,04 21,01 0,00 µI1 = µPO -1,63 0,11 21,77 0,00 µI2 = µO -2,30 0,03 21,77 0,00 µI2 = µPO -1,65 0,11 21,77 0,00 µI3 = µO -2,28 0,03 21,77 0,00 µI3 = µPO -1,65 0,11 21,77 0,00 µO = µPO -1,16 0,25 3,26 0,07
This table compares means (and medians) of indemnities of nationalized firms with the results of firms´s privatization (offer size and post-offer equity value). µI1, µI2, µI3, µO, andµPO are respectively means (medians) of indemnities, offer size and post-offer equity value.
Comparing the mean (and median) value of indemnities with the offer values and post-offer equity values we can, generally, conclude statistically (see Table 3) that the amounts paid by the Republic to the former shareholders were lower than the public offer prices, as well as than the post-offer equity values. From table 3 the attractive results of the privatization offers are visible, namely from the Portuguese capital market development point of view, one of the stated goals of the Portuguese privatizations. The mean (and median) post-offer equity values were consistently higher than the amounts of the public offers.
4. Value Changes
We compute the value change of the nationalized companies during their time as private companies as
1 ) ) 1 ( 1 ( 12 2 0 j j E E j j j j j j RBTA ZP N V V (1)
where VO
j is the value of company j using the offer price and the denominator is the pre-privatization State investment in
company j, adding the indemnities paid by the State and the net investment during the period between the nationalization and the privatization offer. NjZPj is the value of the indemnities paid to the shareholders of company j, δj is a factor that
represents the net investment in the company during its years as a private company, RBTAj represents the mean monthly
return on the BTA index between the dates when indemnities were set for share j and its first privatization offer (which we define as the Republic’s opportunity cost for its investment in nationalized shares), and Ej is the number of months from
the nationalization and the first privatization offer of company j.
The relevant net investment (GAFEEP, 1995; Vilar, 1998) in the companies when private is given by the Republic’s cash outflow to the nationalized companies derived from its shareholders status (that is, without taking into account subsidies and compensations paid to nationalized companies that rendered public services, as well as debt for shares swaps and debt guarantees) and dividends paid to the Republic by the nationalized companies.
In percentage of indemnities,
δj = δ1j – δ2j (2)
where δ1
j and δ2j represent, respectively, the Republic’s cash out-flow due to its shareholder status and the dividends paid
to the Republic.
Since this information is not available for each company every year, we take δj=δ,
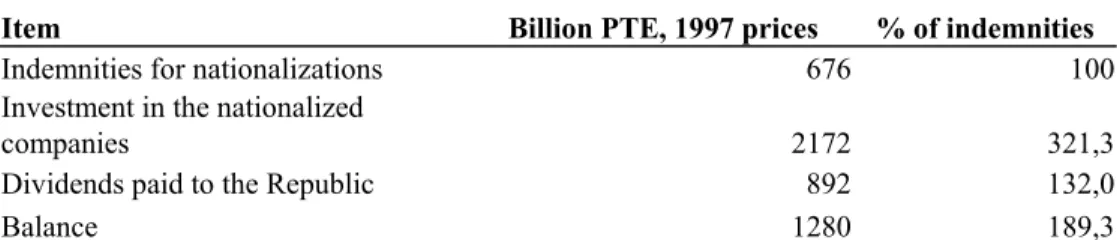
j, and compute δ using the datadocumented in Vilar (1998) for the period 1978-1997 (Table 4). Table 4. Cash flows to and from the republic and nationalized companies
Item Billion PTE, 1997 prices % of indemnities
Indemnities for nationalizations 676 100
Investment in the nationalized
companies 2172 321,3
Dividends paid to the Republic 892 132,0
Balance 1280 189,3
This table reports cash flows to and from the Republic and nationalized companies, between 1978 and 1997. The Republic’s investment is total cash outflow minus subsidies, compensations for public services rendered, equity for debt swaps and debt guarantees. Data are from Vilar (1998).
On average, the Republic’s net investment, after nationalizations, was 89.3% higher than the amount spent in indemnities, making δ=1.893.
ΔVj represents the annual return on the shares of the j-th company to be nationalized and privatized (in a Ej months
holding period). A suitable benchmark for this return is the market portfolio’s return, as usually used to assess the returns of private equity investments (Kaplan and Schoar’s, 2005 public market equivalent). The fact that we are analyzing returns in private companies makes the calculation of excess returns, that is, the difference between the annual return on the shares of the j-th company and its expected return, using for example the capital asset pricing model, infeasible. We therefore define the market return in the same holding period as ΔVBTAj as
1 12 1 j E Z j V j j IBTA IBTA VBTA (3)
This translates, for each company, in the growth of an investment in the BTA index between the indemnity payment date (IBTAZ
j) and the privatization date (IBTAVj) (Note 7). We use this return to discount the values of the net investment in
each company, that, for lack of more precise data, we assume occurred in the mid point of the private company period. Indemnities were paid on 16 December 1978 (banks and insurance companies) and 25 May 1979 (non financial companies). The last privatization offer in our sample – EDP – took place on 16 June 1997. The time series of the BTA index during these 19 years (Figure 1) posts very clearly the profile of a (re)emerging market, status that the Lisbon Exchange held, in the Morgan Stanley Capital International definition, until precisely 2 December 1997, less than six months after the EDP offer.
0,0 1000,0 2000,0 3000,0 4000,0 5000,0 6000,0 7000,0 8000,0
Figure 1. BTA Index, 15-12-1978 to 16-06-97 (source: MC Corretagem)
On the eve of the setting of the indemnities to be paid to banks and insurers’ shareholders, the index value was 60.9, 32.5% below its opening value (90.2 as at April 1, 1977). On the day of the EDP offer, the BTA stood at 4330.2, 36.4% below its all-time high of 6 October 1987, immediately before the interview of Prime Minister Aníbal Cavaco Silva to the Portuguese National Television where he commented that “cats were being sold for the price of hares” (Note 8) on the Lisbon Exchange.
We define the abnormal return on the j-th company as
ΔVAj =ΔVj – ΔVBTAj (4)
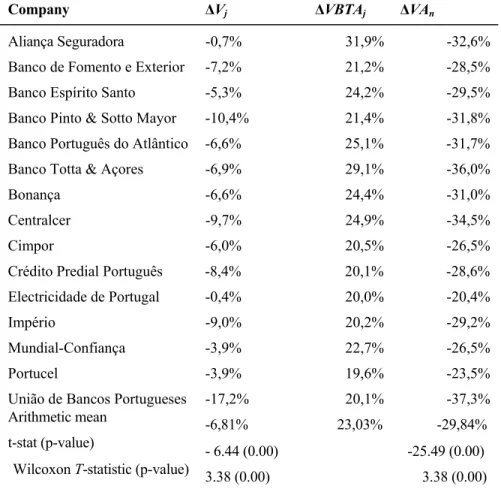
ΔVj, ΔVBTAj and ΔVAj values for the sample are posted in Table 5.
Table 5. Statistics for the nationalized companies’ value changes during their time as private companies
Company ΔVj ΔVBTAj ΔVAn
Aliança Seguradora -0,7% 31,9% -32,6%
Banco de Fomento e Exterior -7,2% 21,2% -28,5%
Banco Espírito Santo -5,3% 24,2% -29,5%
Banco Pinto & Sotto Mayor -10,4% 21,4% -31,8%
Banco Português do Atlântico -6,6% 25,1% -31,7%
Banco Totta & Açores -6,9% 29,1% -36,0%
Bonança -6,6% 24,4% -31,0%
Centralcer -9,7% 24,9% -34,5%
Cimpor -6,0% 20,5% -26,5%
Crédito Predial Português -8,4% 20,1% -28,6%
Electricidade de Portugal -0,4% 20,0% -20,4%
Império -9,0% 20,2% -29,2%
Mundial-Confiança -3,9% 22,7% -26,5%
Portucel -3,9% 19,6% -23,5%
União de Bancos Portugueses -17,2% 20,1% -37,3%
Arithmetic mean -6,81% 23,03% -29,84%
t-stat (p-value) - 6.44 (0.00) -25.49 (0.00)
Weighted mean -6,78% 21,47% -28,25%
Median -6,63% 21,38% -29,50%
Standard deviation 4,09% 3,63% 4,53%
Maximum -0,36% 31,90% -20,40%
Minimum -17,16% 19,62% -37,30%
This table reports the descriptive statistics of the nationalized companies value change during their operation as private companies, both gross and deducted from the return on the BTA index. The weights in the weighted average are mean indemnities, as in Alpalhão (2012).
During a period of high volatility, the Portuguese Republic’s performance as equity investor and manager was lacklustre, both in absolute terms and relatively to the public market equivalent. No offer posts a positive value change. The mean (and the median) of the offers presents a negative change of -6.81% (-6.63%), both statistically significant at the 1% level. That is, the State did not even recover capital invested in indemnities and subsequent investments in nationalized companies. Additionally, but confirming the fragile investments done by the Portuguese State, the portfolio mean (median) abnormal return is clearly negative (-29.84% unweighted and -28.25% weighted) and different from zero at the 1% significance level.
A negative value for this return is consistent with the generalized empirical evidence of post-privatization performance improvement, although the source of negative returns may not be totally due to inefficient management, taking into account privatization pricing tactics and market conditions at the time of the privatization offers.
In the French case, Dumontier and Laurin (2003) document a return only slightly below zero (-0.25%), pointing to a negligible value destruction.
Muscarella and Vetsuypens’ (1990) work on American SIPO documents an absolute return of 268.4%, much above the Portuguese numbers, but not significantly different from zero after adjustment for leverage and market returns.
5. Conclusion
We can conclude that the Portuguese citizens, as indirect investors in the nationalized companies, earned a return much lower than the one available to them through a passive investment in the Portuguese market portfolio, and also lower than the returns earned in comparable international cases. The Portuguese Republic did a poor job as an LBO specialist.
Acknowledgement
This research draws upon the first author’s doctoral dissertation. The support and helpful comments of the thesis supervisor, António Gomes Mota, of thesis committee members António Nogueira Leite, Miguel Athayde Marques, Clara Raposo and José Paulo Esperança are gratefully acknowledged. All remaining errors are the authors’ sole responsibility.
References
Alexandre, H., & G. Charreaux. (2004). Efficiency of French Privatizations: a Dynamic Vision. Journal of Corporate
Finance, 10(3), 467-494. http://dx.doi.org/10.1016/S0929-1199(02)00044-5
Allais, M. (1947, July & October). Le Problème de la Planification Economique dans une Economie Collectiviste.
Revue Internationale des Sciences Sociales Kyklos, I, 254-280, and II, 48-71.
Alpalhão, R. (2012). From Market to State: Wealth Transfers in the Portuguese Nationalisations of the 1970s.
Financial History Review, 19(1), 49-74. http://dx.doi.org/10.1017/S0968565011000138
Bel, G. (2007). The Coining of ‘Privatization’ and Germany’s National Socialist Party”, Journal of Economic
Perspectives, 20(3), 187-194. http://dx.doi.org/10.1257/jep.20.3.187
Bel, G. (2010). Against the Mainstream: Nazi Privatization in 1930’s Germany. Economic History Review, 63(1), 34-55. http://dx.doi.org/10.1111/j.1468-0289.2009.00473.x
Boardman, A., C. Laurin, & A.Vining. (2003). Privatization in North America. In Parker D., & Sall D. (Eds.),
International Handbook on Privatization (pp. 129-160). Cheltenham: Edward Elgar.
Bortolotti, B., J. D’souza, M. Fantini, & W. Megginson. (2002). Sources of Performance Improvement in Privatised Firms: a Clinical Study of the Global Telecommunications Industry. Telecommunications Policy, 26(5-6), 243-68. http://dx.doi.org/10.1016/S0308-5961(02)00013-7
Boubakri, N., & J. Cosset. (2002). Does Privatization Deliver? Evidence from Africa. Journal of African Economies,
11(suppl.1), 111-140. http://dx.doi.org/10.1093/jafeco/11.suppl_1.111
Buchanan, J. (1972). Theory of Public Choice. Ann Arbor: University of Michigan Press. Burke, K. (1988). The First Privatisation. London: The Historian’s Press.
Cao, J. (2011). IPO Timing, Buyout Sponsors’ Exit Strategies, and Firm Performance of RLBOs. Journal of Financial
and Quantitative Analysis, 46(4), 1001-1024. http://dx.doi.org/10.1017/S0022109011000160
Cao, J., & J. Lerner. (2009). The Performance of Reverse Leveraged Buyouts. Journal of Financial Economics, 91(2), 139-157.
Dewenter, K., & P. Malatesta. (2001). State-Owned and Privately-Owned Firms: an Empirical Analysis of Profitability, Leverage and Labour Intensity. American Economic Review, 91(1), 320-334. http://dx.doi.org/10.1257/aer.91.1.320
Drathen, C. von, & F. Faleiro. (2007). The Performance of Leveraged Buyout-Backed Initial Public Offerings in the UK. Unpublished working paper, London Business School.
Dumontier, P., & C.Laurin, C. (2003). The Financial Impact of the French Government’s Nationalization/Privatization Strategy. Paper presented at the EFMA 2003 Helsinki Meetings.
GAFEEP. (1995). Privatizações em Portugal: uma reforma estrutural [Privatizations in Portugal: a structural reform]. Lisbon: Ministério das Finanças.
Harper, J. (2001). Short-Term Effects of Privatization on Operating Performance in the Czech Republic. Journal of
Financial Research, 24(1), 119-31.
Hayek, F. von. (1944). The Road to Serfdom. Chicago: University of Chicago Press.
Kaplan, S., & A. Schoar. (2005). Private Equity Performance: Returns, Persistence and Capital flows. Journal of
Finance, 60(4), 1791-1823. http://dx.doi.org/10.1111/j.1540-6261.2005.00780.x
Langhör, H., & C.Viallet. (1986). Compensation and Wealth Transfers in the French Nationalizations 1981-82.
Journal of Financial Economics, 17(2), 273-312. http://dx.doi.org/10.1016/0304-405X(86)90067-X Lewis, W. (1949). The Principles of Economic Planning. London: George Allen & Unwin.
Meade, J. (1948). Planning and the Price Mechanism: the Liberal Socialist Solution. London: George Allen & Unwin. Megginson, W., & J. Netter. (2001). From State to Market: a Survey of Empirical Studies on Privatization. Journal of
Economic Literature, 39(2), 321-389. http://dx.doi.org/10.1257/jel.39.2.321
Megginson, W., & J. Netter. (2003). History and Methods of Privatization. In Parker D., & Sall D. (Eds.),
International Handbook on Privatization (pp. 25-40). Cheltenham: Edward Elgar.
Muscarella, C., & M. Vetsuypens. (1989). The Underpricing of ‘Second’ Initial Public Offerings. Journal of Financial
Research, 12(3), 183-192.
Niskanen, W. (1971). Bureaucracy and Representative Government. Chicago: Aldine.
Sun, Q., J. Jia., & W. Tong. (2002). Malaysian Privatization: a Comprehensive Study. Financial Management, 31(4), 5-31. http://dx.doi.org/10.2307/3666175
Valério, N. (2001). The Escudo: the Portuguese Currency Unit 1911-2001. Lisbon: Bank of Portugal. Vickers, J., & G. Yarrow. (1988). Privatization: an Economic Analysis. Cambridge: MIT Press.
Vilar, E. (ed.) (1998). Livro Branco do Sector Empresarial do Estado [The State’s Corporate Sector White Book]. Lisbon: Ministério das Finanças.
Villalonga, B. (2000). Privatization and Efficiency: Differentiating Ownership Effects from Political, Organizational
and Dynamic Effects. Journal of Economic Behavior and Organization, 42, 43-74.
http://dx.doi.org/10.1016/S0167-2681(00)00074-3
Wei, Z., & O. Varela. (2003). State Equity Ownership and Firm Market Performance: Evidence from China’s Newly Privatized Firms. Global Finance Journal, 14(1), 65-82. http://dx.doi.org/10.1016/S1044-0283(03)00005-X Wei, Z., O. Varela, & M. Hassan. (2002). Ownership and Performance in Chinese Manufacturing Industry. Journal of
Wei, Z., O. Varela, J. D’souza, & M. Hassan. (2003). The Financial and Operating Performance of China’s Newly Privatized Firms. Financial Management, 32(2), 107-126. http://dx.doi.org/10.2307/3666339
Notes
Note 1. One exception is Hayek (1944).
Note 2. Although Megginson and Netter (2001) name the sale of a minority share in Volkswagen by the German government of Konrad Adenauer, in 1961, as the first privatization. It should be noted that this shareholding returned to State ownership four years later, and, unlike the BP offer, did not mark the beginning of an era of massive and worldwide sale of State-owned companies to the public. Bel (2007) places the first privatizations quite before, in the thirties in Nazi Germany. Megginson and Netter (2003), and Burke (1998), prefer to give the pioneering place to the denationalization of steel and coal in the United Kingdom in the early fifties. For an interesting discussion of the coining of the term “privatization” itself, Bel (2010).
Note 3. For unlisted companies this value was to be replaced by a so-called “capital value”, computed as a multiple of declared dividends.
Note 4. €1,00 = 200,482 PTE. This being the case, 50 thousand PTE equals approximately €250,00. Note 5. Approximately €1,21 million.
Note 6. Roughly €5 million.
Note 7. The BTA Index, published by Banco Totta & Açores, became, after the Lisbon Exchange reopening in the seventies, the market’s most popular benchmark, replacing in that role the Bank of Portugal Index.
Note 8. A popular Portuguese saying meaning, in this case, stock prices well above their fundamentals. Aníbal Cavaco Silva, Prime Minister at the time and the President of the Portuguese Republic at the time of writing, was a Public Finance Professor and had been a very successful Finance Minister before becoming Prime Minister. His views on economic and financial issues were (and still are) widely respected.