Phytochemical characterization and antioxidant activity of Opuntia
microdasys (Lehm.) Pfeiff flowers in different stages of maturity
Hassiba Chahdouraa,b, João C.M. Barreiraa,c, Lillian Barrosa, Celestino Santos-Buelgac,
Isabel C.F.R. Ferreiraa,*, Lotfi Achourb
a
Mountain Research Centre (CIMO), ESA, Polytechnic Institute of Bragança, Campus de Santa Apolónia, Ap. 1172, 5301-855 Bragança, Portugal.
b
Unité de Recherche 03/UR/09-01 «Génome, Diagnostic Immunitaire et Valorisation», Institut Supérieur de Biotechnologie de Monastir, Avenue Tahar Hadded, BP 74, 5000, Université de Monastir, Monastir, Tunisia.
c
Grupo de Investigación en Polifenoles (GIP-USAL), Faculty of Pharmacy, University of Salamanca, Campus Miguel de Unamuno, 37007 Salamanca, Spain.
*Author to whom correspondence should be addressed (e-mail: [email protected],
Abstract
The diversity of Opuntia spp. bioactive molecules makes them good candidates for production of health promoting foods. The chemical composition of O. microdasys
flowers in different maturity stages was profiled with respect to hydrophilic and
lipophilic compounds. Furthermore, the antioxidant activity was evaluated though
radicals scavenging activity, reducing power and lipid peroxidation inhibition. Soluble
sugars profile revealed the presence of fructose, glucose, sucrose and trehalose; the
detected organic acids were oxalic, quinic, malic, and citric acid; phenolic compounds
included five hydroxycinnamoyl, two kaempferol and six isorhamnetin derivatives;
twenty three fatty acids were quantified in all flowering stages, except C20:2, which
was only found in post flowering stage (F3); α-, β-, γ-, and δ-tocopherols were
quantified in all samples. The highest contents in soluble sugars and phenolic
compounds were detected in full flowering stage (F2), while organic acids and
tocopherols were predominant in vegetative stage (F1). The highest levels of saturated,
monounsaturated and polyunsaturated fatty acids were found in F3, F2 and F1,
respectively. F1 gave the highest antioxidant activity. Principal components analysis
showed clearly individualized groups corresponding to each flowering stage, identifying
the most distinctive features, which might be useful to select a flowering stage for
incorporation in functional foods.
1. Introduction
The cactus plant (Opuntia spp.) belongs to the Cactaceae family; it isnative to Mexico, being widespread throughout Central and South America, Australia, South Africa, but
also throughout the whole Mediterranean area. These plants grow wild in arid and
semi-arid regions, where the production of more succulent food plants is severely limited
(Galati et al., 2002). Opuntia spp. did not receive much attention by the scientific community until the beginning of 1980, but an increase of research works and
publications on the chemical characterization of the flowers and other organs of these
plants occurred. This renewed interest might be ascribed to the multi-functionality of
Opuntia spp. fruits, pads, and flowers, due to the great number of potentially active nutrients that offer interesting opportunities for the production of health promoting food
and food supplements (Stintzing & Carle, 2005).In fact, Opuntia ssp. species has also been gradually achieving economic importance due to FAO recommendations, which
strengthened an increased cooperation among scientists, technicians and growers from
different countries, facilitating the exchange of information, knowledge and technical
cooperation on cactus, contributing to the diffusion of its cultivation (Galati et al., 2002).
Antioxidants and radical scavengers are considered important nutraceuticals, exerting a
protective effect in several diseases (Feugang et al., 2006). Moreover, it has been well documented that natural polyphenolic compounds have a close relationship with these
properties (Heim et al., 2002; Pallarès et al., 2013). Oxidative stress and deficient antioxidant defences have been implicated in some clinical disorders. Therefore,
diet-derived antioxidants may be particularly important in protecting against chronic
directed towards identification of natural antioxidants (plant derived) that may be used
as food supplements able to promote health (Senanayake et al., 2013).
The flowers of Opuntia genus are used in traditional Tunisian and Italian (Sicily) medicine. Their infusions, for instance, are known as diuretic agents and as having the
capacity to expulse renal calculus and cure ulcer (Yeddes et al., 2014).Flower extracts
(50% aqueous methanol and ethanol) of O. ficus indica f. inermis, O. ficus indica (L.),
O. stricta (Haw.) have shown anti-fungicide, anti-bacterial, antioxidant and antiulcerogenic activities (Alimi et al.; 2011; Ammar et al., 2012). Isorhamnetin glycosylated compounds were reported as the major phenolic compounds in flowers
from O. ficus indica from Italy (Leo et al., 2010) and Tunisia (Yeddes et al., 2014).
However, as far as we know, there are no reports concerning phytochemical
composition of O. microdasys flowers.
In this context, the present work aims to compare the chemical composition of flowers
of O. microdasys in different maturity stages, with respect to hydrophilic (soluble sugars, organic acids and phenolic compounds) and lipophilic (fatty acids and
tocopherols) molecules. Furthermore, in vitro antioxidant properties (free radicals scavenging activity, reducing power and lipid peroxidation inhibition) of their
methanolic extracts were evaluated and compared to the corresponding phytochemical
profile, in order to establish the most adequate stages to be incorporated in functional
foods, for instance using microencapsulation techniques, and/or to develop nutraceutical
formulations like capsules, pills or syrups.
2. Materials and methods
Opuntia microdasys flowers were collected from the cliff of Monastir (Tunisia)at three phenological stages: (F1) vegetative stage, with green closed petal flowers; (F2) full
flowering stage: stamens are separated around the stylet and the flowers are fully
opened and the nectar production starts; (F3) post flowering stage: the flowers are dried
and close to senescence. All samples were collected during 2013: F1 samples were
harvested in the beginning of June; F2 were harvested after the first fortnight; F3
samples were obtained in the last week of June. Opuntia microdasys flowers were dried under shade, grounded with a Warring blender (Phillips, France), reduced to a fine dried
powder (20 mesh) and mixed to obtain a homogenous sample.
2.2. Standards and reagents
Acetonitrile (99.9%), n-hexane (97%) and ethyl acetate (99.8%) were of HPLC grade
from Fisher Scientific (Lisbon, Portugal). The fatty acids methyl ester (FAME)
reference standard mixture 37 (standard 47885-U) was purchased from Sigma (St.
Louis, MO, USA), as also were other individual fatty acid isomers and standards:
L-ascorbic acid, tocopherols (α-, β-, γ-, and δ-isoforms), soluble sugars (D(-)-fructose,
D(+)-melezitose, D(+)-sucrose, D(+)-glucose, D(+)-trehalose and D(+)-raffinose
pentahydrate), organic acids and trolox
(6-hydroxy-2,5,7,8-tetramethylchroman-2-carboxylic acid). Phenolic compounds were purchased from Extrasynthèse (Genay,
France). Racemic tocol, 50 mg/mL, was purchased from Matreya (Pleasant Gap, PA,
USA). 2,2-Diphenyl-1-picrylhydrazyl (DPPH) was obtained from Alfa Aesar (Ward
Hill, MA, USA). Water was treated in a Milli-Q water purification system (TGI Pure
Water Systems, Greenville, SC, USA). All other chemicals and solvents were of
2.3. Chemical composition in hydrophilic compounds 2.3.1. Soluble sugars
Soluble sugars were determined by high performance liquid chromatography coupled to
a refraction index detector (HPLC-RI). Dried sample powder (1.0 g) was spiked with
the melezitose as internal standard (IS, 5 mg/mL), and was extracted with 40 mL of
80% aqueous ethanol at 80 ºC for 30 min. The resulting suspension was centrifuged
(Centurion K24OR refrigerated centrifuge, West Sussex, UK) at 15,000g for 10 min. The supernatant was concentrated at 60 ºC under reduced pressure and defatted three
times with 10 mL of ethyl ether, successively. After concentration at 40 ºC, the solid
residues were dissolved in water to a final volume of 5 mL and filtered through 0.2 µm
nylon filters from Whatman (Pinela et al., 2012). The equipment of analysis consisted of an integrated system with a pump (Knauer, Smartline system 1000, Brelin,
Germany), degasser system (Smartline manager 5000), auto sampler (AS-2057 Jasco,
Easton, MD, USA) and an RI detector (Knauer Smartline 2300). Data were analysed
using Clarity 2.4 Software (DataApex). The chromatographic separation was achieved
with a Eurospher 100-5 NH2 column (4.6 × 250 mm, 5 mm, Knauer) operating at 30 ºC
(7971 R Grace oven). The mobile phase was acetonitrile/deionized water (70:30, v/v) at a flow rate of 1 mL/min. The compounds were identified by chromatographic
comparisons with authentic standards. Quantification was performed using the internal
standard method and soluble sugars contents were further expressed in g per 100 g of
dry weight (dw).
2.3.2. Organic acids
Organic acids were determined using ultra-fast liquid chromatography coupled to a
25 mL of meta-phosphoric acid (25 ºC at 150 rpm) for 45 min and subsequently filtered
through Whatman No. 4 paper. Before analysis, the sample was filtered through 0.2 µm
nylon filters (Barros et al., 2013). The analysis was performed using a Shimadzu 20A series UFLC (Shimadzu Corporation, Kyoto, Japan). Separation was achieved on a
SphereClone (Phenomenex, Torrance, CA, USA) reverse phase C18 column (5 µm, 250
mm × 4.6 mm i.d.) thermostatted at 35 ºC. The elution was performed with sulphuric
acid (3.6 mM) using a flow rate of 0.8 mL/min. Detection was carried out in a PDA,
using 215 and 245 nm (for ascorbic acid) as preferred wavelengths. The organic acids
found were quantified by comparison of the area of their peaks recorded at 215 and 245
nm with calibration curves obtained from commercial standards of each compound:
ascorbic acid (y=8E+07x+55079; R2=1); citric (y=1E+06x+4170.6; R2=1); fumaric acid (y=172760x+52193; R2=0.999); malic acid (y=952269x+17803; R2=1); oxalic acid (y=1E+07x+96178; R2=0.999) and quinic acid (y=601768x+8853.2; R2=1). The results were expressed in g per 100 g of dry weight (dw).
2.3.3. Phenolic compounds
The powdered plant samples (~1 g) were extracted by stirring with 30 mL of
methanol/water (80:20, v/v), at room temperature, 150 rpm, for 1 h. The extract was filtered through Whatman nº 4 paper. The residue was then re-extracted twice with
additional portions (30 mL) of methanol/water (80:20, v/v). The combined extracts were evaporated at 35 °C (rotary evaporator Büchi R-210, Flawil, Switzerland) to remove
methanol. The aqueous phase was lyophilized and re-dissolved in 20% aqueous
methanol at 5 mg/mL and filtered through a 0.22-µm disposable LC filter disk for high
performance liquid chromatography (HPLC-DAD-MS) analysis. The extracts were
Clara, CA, USA) with a quaternary pump and a diode array detector (DAD) coupled to
an HP Chem Station (rev. A.05.04) data-processing station. A Waters Spherisorb S3
ODS-2 C18, 3 µm (4.6 mm × 150 mm) column thermostatted at 35 °C was used. The
solvents used were: (A) 0.1% formic acid in water, (B) acetonitrile. The elution gradient
established was isocratic 15% for 5 min, 15% B to 20% B over 5 min, 20-25% B over
10 min, 25-35% B over 10 min, 35-50% for 10 min, and re-equilibration of the column,
using a flow rate of 0.5 mL/min. Double online detection was carried out in the DAD
using 280 nm and 370 nm as preferred wavelengths and in a mass spectrometer (MS)
connected to HPLC system via the DAD cell outlet.
MS detection was performed in an API 3200 Qtrap (Applied Biosystems, Darmstadt,
Germany) equipped with an ESI source and a triple quadrupole-ion trap mass analyzer
that was controlled by the Analyst 5.1 software. Zero grade air served as the nebulizer
gas (30 psi) and turbo gas for solvent drying (400 ºC, 40 psi). Nitrogen served as the
curtain (20 psi) and collision gas (medium). The quadrupols were set at unit resolution.
The ion spray voltage was set at -4500V in the negative mode. The MS detector was
programmed for recording in two consecutive modes: Enhanced MS (EMS) and
enhanced product ion (EPI) analysis. EMS was employed to show full scan spectra, so
as to obtain an overview of all of the ions in sample. Settings used were: declustering
potential (DP) -450 V, entrance potential (EP) -6 V, collision energy (CE) -10V. EPI
mode was performed in order to obtain the fragmentation pattern of the parent ion(s) in
the previous scan using the following parameters: DP -50 V, EP -6 V, CE -25V, and
collision energy spread (CES) 0 V. Spectra were recorded in negative ion mode between
m/z 100 and 1000.
The phenolic compounds present in the samples were characterised according to their
the quantitative analysis of phenolic compounds, a 5-level calibration curve was
obtained by injection of known concentrations (2.5-100 µg/mL) of different standard
compounds: p-coumaric acid (y=884.6x+184.49; R2=0.999); caffeic acid (y=611.9x-4.573; R2=0.999); ferulic acid (y=505.97x-64.578; R2=0.999); kaempferol-3-O -rutinoside (y=239.16x-10.587; R2=1); isorhamnetin-3-O-rutinoside (y=327.42x+313.78;
R2=1) and isorhamnetin-3-O-glucoside (y=262.31x+9.8958; R2=1). The results were expressed in µg per g of extract.
2.4. Chemical composition in lipophilic compounds 2.4.1. Fatty acids
Fatty acids were determined by gas-liquid chromatography with flame ionization
detection (GC-FID)/capillary column, after trans-esterification procedure. Fatty acids
(obtained after Soxhlet extraction of ≈3 g of dry flowers) were methylated with 5 mL of
methanol/sulphuric acid/toluene (2:1:1, v/v/v), during at least 12 h in a bath at 50 ºC and 160 rpm; then 3 mL of deionised water were added, to obtain phase separation; the
FAME were recovered with 3 mL of diethyl ether by shaking in vortex, and the upper
phase was passed through a micro-column of anhydrous sodium sulphate, in order to
eliminate the water; the sample was recovered in a vial with Teflon, and before injection
the sample was filtered with 0.2 µm nylon filter from Whatman (Pinela et al., 2012).
The analysis was carried out with a DANI model GC 1000 instrument equipped with a
split/splitless injector, a flame ionization detector (FID at 260 ºC) and a
Macherey-Nagel (Düren, Germany) column (50% cyanopropyl methyl-50%
phenylmethylpolysiloxane, 30 m × 0.32 mm i.d. × 0.25 µm df). The oven temperature
program was as follows: the initial temperature of the column was 50 ºC, held for 2 min,
3 ºC/min ramp to 200 ºC, 20 ºC/min ramp to 220 ºC and held for 15 min. The carrier gas
(hydrogen) flow-rate was 4.0 mL/min (0.61 bar), measured at 50 ºC. Split injection
(1:40) was carried out at 250 ºC. Fatty acid identification was made by comparing the
relative retention times of FAME peaks from samples with standards. The results were
recorded and processed using the CSW 1.7 Software (DataApex 1.7) and expressed in
relative percentage of each fatty acid.
2.4.2. Tocopherols
Tocopherols were determined by HPLC (equipment described above), and a
fluorescence detector (FP-2020; Jasco). A solution of butylated hydroxytoluene (BHT)
in hexane (10 mg/mL; 100 µL) and IS solution in hexane (tocol; 50 µg/mL; 400 µL)
were added to the sample prior to the extraction procedure. The samples (~500 mg)
were homogenized with methanol (4 mL) by vortex mixing (1 min). Subsequently,
hexane (4 mL) was added and again vortex mixed for 1 min. After that, saturated NaCl
aqueous solution (2 mL) was added, the mixture was homogenized (1 min), centrifuged
(5 min, 4000g) and the clear upper layer was carefully transferred to a vial. The sample was re-extracted twice with hexane. The combined extracts were taken to dryness under
a nitrogen stream, redissolved in 2 mL of n-hexane, dehydrated with anhydrous sodium
sulphate, filtered through 0.2 µm nylon filters from Whatman, transferred into a dark
injection vial prior to the analysis (Pinela et al., 2012). The fluorescence detector was programmed for excitation at 290 nm and emission at 330 nm. The chromatographic
separation was achieved with a Polyamide II (250 mm × 4.6 mm i.d.) normal-phase
column from YMC Waters operating at 30 ºC. The mobile phase used was a mixture of
with authentic standards. Quantification was based on calibration curves obtained from
commercial standards of each compound using the IS methodology. The results were
expressed in mg per 100 g of dry weight (dw).
2.5. Evaluation of bioactive properties 2.5.1. Samples preparation
The methanolic extract was obtained from the dried plant material. The sample (≈1 g)
was extracted by stirring with 25 mL of methanol (25 ºC at 150 rpm) for 1 h and
subsequently filtered through Whatman No. 4 paper. The residue was then extracted
with 25 mL of methanol (25 ºC at 150 rpm) for 1 h. The combined methanolic extracts
were evaporated at 40 ºC (rotary evaporator Büchi R-210, Flawil, Switzerland) to
dryness.
Methanolic extract was redissolved in methanol (final concentration, 5 mg/mL) for
antioxidant activity evaluation. The final solutions were further diluted to different
concentrations to be submitted to distinct bioactivity evaluation in in vitro assays. The results were expressed in EC50 values (sample concentration providing 50% of
antioxidant activity or 0.5 of absorbance in the reducing power assay) for antioxidant
activity.
2.5.2. Antioxidant activity
2.5.2.1. DPPH radical-scavenging activity
DPPH radical-scaveging activity was performed using an ELX800 Microplate Reader
(Bio-Tek Instruments, Inc; Winooski, VT, USA). The reaction mixture in each one of
the 96-wells consisted of one of the different concentrations of the extracts (30 µL) and
mol/L). The mixture was left to stand for 60 min in the dark. The reduction of the DPPH
radical was determined by measuring the absorption at 515 nm (Pinela et al., 2012). The radical scavenging activity (RSA) was calculated as a percentage of DPPH
discolouration using the equation: %RSA = [(ADPPH−AS)/ADPPH] × 100, where AS is the absorbance of the solution when the sample extract has been added at a particular level,
and ADPPH is the absorbance of the DPPH solution. The extract concentration providing 50% of radical scavenging activity (EC50) was calculated from the graph of RSA
percentage against extract concentration. Trolox was used as a standard.
2.5.2.2. Reducing power
This methodology was performed using the Microplate Reader described above. The
different concentrations of the extracts (0.5 mL) were mixed with sodium phosphate
buffer (200 mmol/L, pH 6.6, 0.5 mL) and potassium ferricyanide (1% w/v, 0.5 mL). The mixture was incubated at 50 °C for 20 min, and trichloroacetic acid (10% w/v, 0.5 mL) was added. The mixture (0.8 mL) was poured in the 48-wells, as also deionized water
(0.8 mL) and ferric chloride (0.1% w/v, 0.16 mL), and the absorbance was measured at 690 nm (Pinela et al., 2012). The extract concentration providing 0.5 of absorbance (EC50) was calculated from the graph of absorbance at 690 nm against extract
concentration. Trolox was used as a standard.
2.5.2.3. Inhibition of β-carotene bleaching
A solution of β-carotene was prepared by dissolving β-carotene (2 mg) in chloroform
(10 mL). Two millilitres of this solution were pipetted into a round-bottom flask. After
the chloroform was removed at 40 °C under vacuum, linoleic acid (40 mg), Tween 80
shaking. Aliquots (4.8 mL) of this emulsion were transferred into different test tubes
containing different concentrations of the extracts (0.2 mL). The tubes were shaken and
incubated at 50 °C in a water bath. As soon as the emulsion was added to each tube, the
zero time absorbance was measured at 470 nm (Pinela et al., 2012). β-Carotene bleaching inhibition was calculated using the following equation: (β-carotene content
after 2 h of assay/initial β-carotene content) × 100. The extract concentration providing
50% antioxidant activity (EC50) was calculated by interpolation from the graph of β
-carotene bleaching inhibition percentage against extract concentration. Trolox was used
as a standard.
2.5.2.4. Inhibition of lipid peroxidation using thiobarbituric acid reactive substances (TBARS)
Brains were obtained from porcine (Sus scrofa), dissected and homogenized with a Polytron in ice-cold Tris-HCl buffer (20 mM, pH 7.4) to produce a 1:2 (w/v) brain tissue homogenate that was centrifuged at 3000g (Centorion K24OR refrigerated centrifuge) for 10 min. An aliquot (0.1 mL) of the supernatant was incubated with the different
concentrations of the extracts (0.2 mL) in the presence of FeSO4 (10 µM; 0.1 mL) and
ascorbic acid (0.1 mM; 0.1 mL) at 37 °C for 1 h. The reaction was stopped by the
addition of trichloroacetic acid (28%, w/v, 0.5 mL), followed by thiobarbituric acid (TBA, 2%, w/v, 0.38 mL), and the mixture was then heated at 80 °C for 20 min. After centrifugation at 3000g for 10 min to remove the precipitated protein, the color intensity of the malondialdehyde (MDA)-TBA complex in the supernatant was measured by its
concentration providing 50% lipid peroxidation inhibition (EC50) was calculated from
the graph of TBARS inhibition percentage against extract concentration. Trolox was
used as a standard.
2.6. Statistical analysis
All extractions were performed in triplicate and each replicate was also analysed in
triplicate. The results are expressed as means±standard deviations. All statistical tests
were performed at a 5% significance level using the SPSS software, version 19.0 (IBM
Inc).
The fulfillment of the one-way ANOVA requirements, specifically the normal
distribution of the residuals and the homogeneity of variance, were tested by the
Shapiro-Wilk’s and the Levene’s tests, respectively. In the cases where statistical
significance differences were identified, the dependent variable were compared using
Tukey’s honestly significant difference (homoscedasticity) or Tamhane’s T2
(heteroscedasticity) multiple comparison tests.
Principal components analysis (PCA) was applied as pattern recognition unsupervised
classification method. The construction of the matrix for PCA included 59 variables
(corresponding to the evaluated parameters) and 27 samples (corresponding to the
flowering stages). PCA transforms the original, measured variables into new
uncorrelated variables called principal components. The first principal component
covers as much of the variation in the data as possible. The second principal component
is orthogonal to the first and covers as much of the remaining variation as possible, and
so on (Patras et al., 2011). The number of dimensions kept for data analysis was evaluated by the respective eigenvalues (which should be greater than one), by the
variance (that should be as higher as possible) explained by the number of components
selected. The number of plotted dimensions was chosen to allow meaningful
interpretations.
3. Results and discussion
3.1. Chemical composition in hydrophilic compounds
The results for soluble sugars composition are shown in Table 1. The soluble sugars in
the three stages of maturation found were fructose, glucose, sucrose and trehalose, with
prevalence of fructose and glucose. Except for trehalose (1.50 g/100 g dw in F1), the
highest amounts of each quantified soluble sugar were present in the full flowering
stage (F2). The fact that the highest values quantified for F2 was especially evident for
glucose and fructose, the soluble sugars with higher sweeter power (despite fructose is
twice as sweet as glucose) among the detected ones, might be related with the initiation
of nectar production in this stage (Nookaraju et al., 2010).
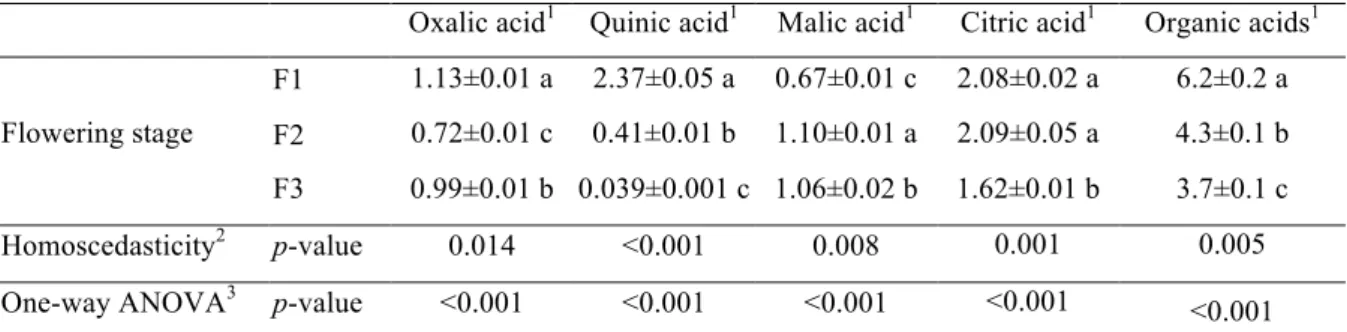
Oxalic, quinic, malic, and citric acids were quantified in all the stages of maturation of
O. microdasys flowers (Table 2). The highest content in organic acids (6.2g/100 g dw) was found in the vegetative stage (F1), mostly due to quinic and citric acid contents. In
fact, all the evaluated organic acids (except malic acid) tended to decrease with
advanced flower maturity. The evolution of organic acids in this study corroborates the
general principle stating that organic acids are used as respiratory substrates in mature
stages (Moing et al., 2001).
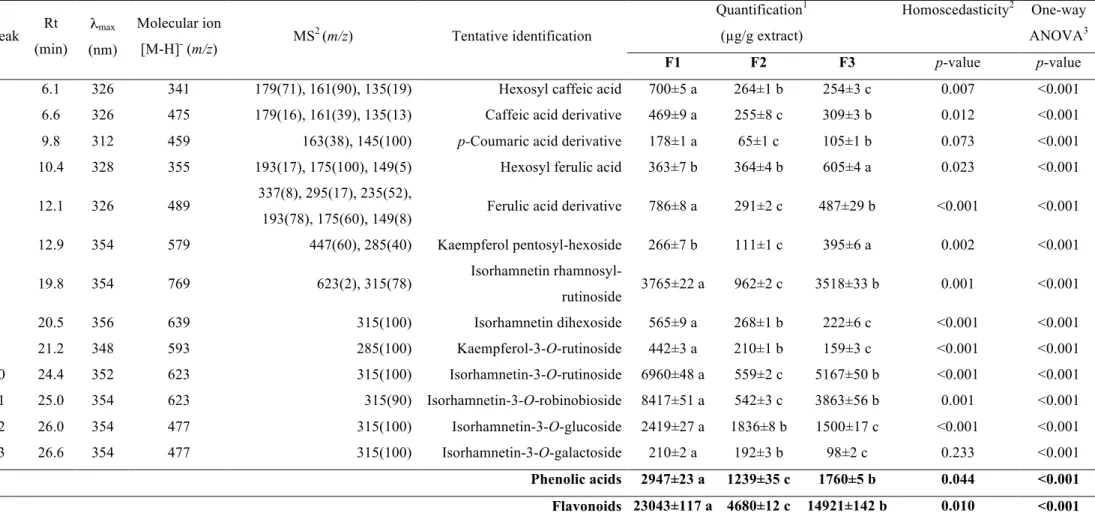
The characterization of the phenolic compounds was performed by
HPLC-DAD/ESI-MS analysis, and data of the retention time, λmax, pseudomolecular ion, main fragment
flavonoids are presented in Table 3. An exemplifying HPLC phenolic profile, recorded
at 370 nm, is presented in Figure 1 for F1 stage.
UV and mass spectra obtained by HPLC-DAD-ESI/MS analysis showed that the
phenolic composition O. microdasys flowers were characterized by the presence of hydroxycinnamoyl derivatives and flavonols (kaempferol and isorhamnetin derivatives).
Sugar substituents consisted of hexosides and rutinosides, as deduced from the losses of
162 Da and 308 Da, respectively.
Thirteen compounds were detected, five of which were hydroxycinnamic acid
derivatives. Peaks 1 and 2 were tentatively identified as caffeic acid derivatives, that
were assigned according to their characteristic UV spectra, showing maximum
wavelength around 326 nm, and to the ions at m/z 179 ([caffeic acid-H]-), 161 ([caffeic acid-H-H2O]-) and 135 ([caffeic acid-CO2-H]-) observed in their MS2 spectra. Similar
reasoning can be applied to assign peak 3 as a coumaric acid derivative, and peaks 4 and
5 as ferulic acid derivatives. Based in its pseudomolecular ion [M-H]- at m/z 341, peak 1 was attributed to a hexosyl caffeic acid, although sugar position and nature could not be
established. Similarly peak 4 can be attributed to a hexosyl ferulic acid.
Peaks 2, 3 and 5 correspond to equivalent compounds derived from one of the three
hydroxycinnamic acids, i.e., caffeic, coumaric and ferulic acids. In all cases, a loss of
296 mu is produced from the respective pseudomolecular ion to yield the
hydroxycinnamic acid residue, although the nature of that loss could not be established,
so that the structures of those peaks remain unknown.
The remaining phenolic compounds corresponded to kaempferol (λmax around 348 nm
([M-H-132-162]-. Peak 9 was positively identified as kaempferol-3-O-rutinoside according to its retention, mass and UV-vis characteristics and by comparison with a commercial
standard. All the remaining compounds were isorhamnetin derivatives. Peak 7, with a
pseudo molecular ion [M-H]- at m/z 769, releasing fragments at m/z 623 (-146 u; loss of deoxyhexosyl residue) and 315 (-146-308 u; loss of deoxyhexosyl +rutinosyl residues),
could be assigned as isorhamnetin rhamnosyl-rutinoside. Peak 8 showed a
pseudomolecular ion [M-H]- at m/z 639, yielding a unique fragment at m/z at 315 (isorhamnetin) from the loss of two hexosyl residues (162 + 162 u). The position of the
sugar substituents could not be definitely concluded, although it might be assumed that
they could constitute a dissaccharide O-linked to the aglycone, since no fragment at m/z
447 from the loss of one hexosyl moiety was observed. Thus, peak 8 was just assigned
as an isorhamnetin O-dihexoside.
Peaks 10 and 11 ([M-H]- at m/z 623) release one MS2 fragment ion at m/z 315, consistent with the loss of a deoxyhexosyl-hexoside moiety (308 u). Peak 10 was
positively identified as isorhamnetin-3-O-rutinoside according to its retention, mass and UV-vis characteristics by comparison with a commercial standard. Peak 11 was
tentatively identified as isorhamnetin-3-O-robinobioside (i.e., rhamnosyl-galactoside), previously reported in Opuntia ficus-indica flowers (Leo et al., 2010).
Finally, peaks 12 and 13 ([M-H]- at m/z 477) correspond to isorhamnetin derivatives with a hexosyl moiety. Peak 12 was positively identified as isorhamnetin-3-O-glucoside according to its retention, mass and UV-vis characteristics by comparison with a
commercial standard. Peak 13 was tentatively identified as isorhamnetin-3-O -galactoside, as previously reported in Opuntia genus (Leo et al., 2010).
Flavonoids, especially isorhamnetin derivatives, were the majority phenolic compounds
phenolic compounds, except hexosyl ferulic acid and kaempferol pentosyl-hexoside,
which were higher in F3. Considering the total amounts as divided by subgroups of
phenolic compounds, phenolic acids (2947±23 µg/g extract) were significantly higher in
F1, similarly to the observed for flavonol derivatives (23043±117 µg/g extract). F2
presented the lowest amounts, either in respect to phenolic acids (1239±35 µg/g
extract), as well as for flavonol derivatives (4680±12 µg/g extract).
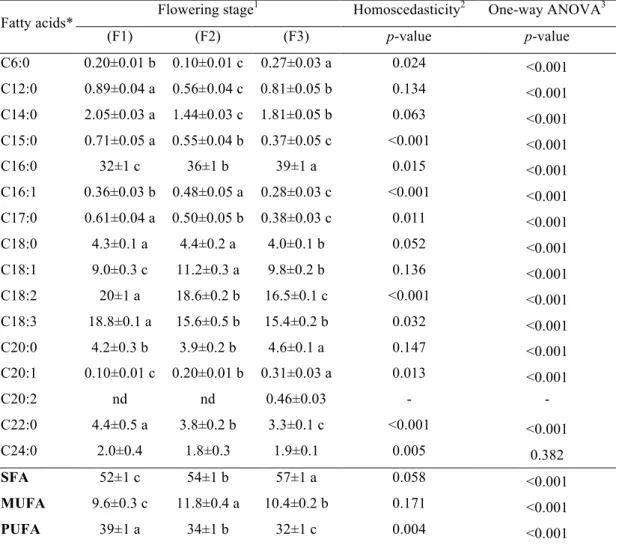
3.2. Chemical composition in lipophilic compounds
The results of fatty acids (FA) profiles are shown in Table 4. Besides those included in
the table, caprylic acid (C8:0), capric acid (C10:0), tridecanoic acid (C13:0), myristoleic
acid (C14:1), eicosatrienoic acid plus heneicosanoic acid (C20:3 + C21:0) and
tricosanoic acid (C23:0) were also detected in trace amounts (<0.2%). All fatty acids
showed significant differences along the assayed maturity stages, except for lignoceric
acid (C24:0; p = 0.382). Saturated fatty acids (SFA), particularly due to palmitic acid (C16:0) contents, predominated over unsaturated ones in all maturity stages, presenting
highest values in F3. On the other hand, monounsaturated fatty acids (MUFA), mostly
due to oleic acid (18:1) contribution, had maximum values in F2, while polyunsaturated
fatty acids (PUFA), with relevance for linoleic and linolenic acids (C18:2 and C18:3),
gave the highest values in F1. The detected profiles are similar to those commonly
found in Opuntia genus (Ammar et al., 2012). Linoleic acid is the most prominent PUFA in the Western diet and previous studies showed health benefits in the prevention
of cancer diseases (Whelan, 2008). α-Linolenic acid is essential for human metabolism and has many beneficial effects, including the prevention of a number of diseases, such
as coronary heart diseases, inflammation, autoimmune disorders, hypertension,
along time for PUFA forms might be related with higher oxidative losses caused by the
longer exposition to abiotic stress, since these molecules are more prone to oxidation.
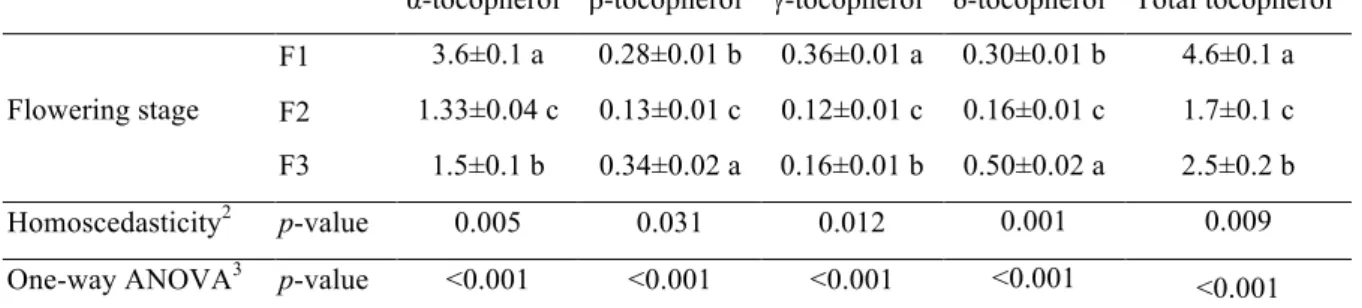
Regarding tocopherols composition (Table 5), α-tocopherol was, by far, the most
abundant vitamer in the three flowering stages. Total tocopherols (4.6 mg/100 g dw)
and α- (3.6 mg/100 g dw) γ- (0.37 mg/100 g dw) vitamers gave maximal values in F1,
while β- (0.28 mg/100 g dw) and δ-tocopherol (0.30 mg/100 g dw) were highest in F3.
Tocopherols are important natural antioxidants in plant foods, especially those rich in
PUFA due to their capacity to scavenge lipid peroxyl radicals of unsaturated lipid
molecules, preventing propagation of lipid peroxidation (Traber, 2007). Due to its role as free radical scavenger, vitamin E is also believed to protect against degenerative
processes, such as cancer and cardiovascular diseases (Burton and Traber, 1990; Kagan et al., 2003).
3.3. Evaluation of bioactive properties
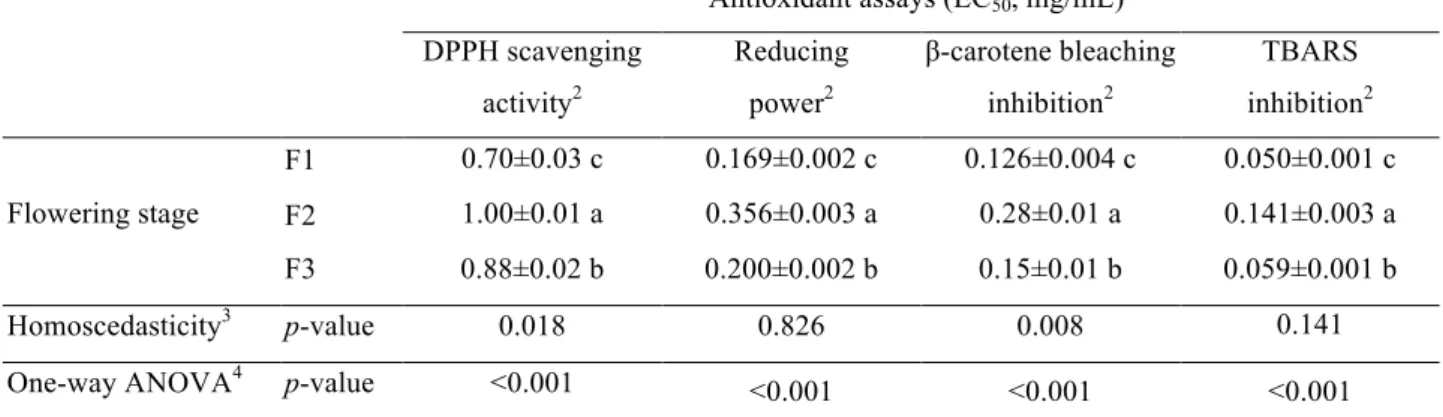
The antioxidant properties of the studied flowering stages were evaluated by DPPH
radical scavenging capacity, reducing power (Fe3+ into Fe2+) and inhibition of lipid
peroxidation using β-carotene-linoleate model system and TBARS assay (Barros et al., 2010). With no exception, F1 gave the highest antioxidant activity for all assays, followed by F3. The results obtained in the evaluation of antioxidantactivity are often
associated with the phenolic composition (Cheung et al., 2003; Li et al., 2014). The results presented herein are in agreement with this premise, since F1, the flowering
stage with highest phenolic acid and flavonol contents gave also the most powerful
antioxidant activity (DPPH scavenging activity: EC50 = 0.70 mg/mL, reducing power:
EC50 = 0.169 mg/mL, β-carotene bleaching inhibition: EC50 = 0.126 mg/mL, and
the lowest contents in phenolic acids and flavonols presented the worst results in all
antioxidant activity assays (DPPH scavenging activity: EC50 = 1.00 mg/mL, reducing
power: EC50 = 0.356 mg/mL, β-carotene bleaching inhibition: EC50 = 0.28 mg/mL, and
TBARS inhibition: EC50 = 0.141 mg/mL).
3.4. Principal Components Analysis
In order to have a more integrated approach regarding the differences in chemical
profiles and antioxidant activity for the three assayed flowering stages, considering the
results obtained for all the parameters simultaneously, a principal components analysis
(PCA) was applied.
The plot of component loadings (Figure 2), indicates that the first two dimensions
(first: Cronbach’s α, 0.984; eigenvalue, 31.032; second: Cronbach’s α, 0.973;
eigenvalue, 22.854) account for most of the variance of all quantified variables (52.60
and 38.74%, respectively). Only two dimensions were plotted, because the inclusion of
additional dimensions would not allow a meaningful interpretation. Groups
corresponding to each flowering stage (F1, F2 and F3) were clearly individualized, as it
could be expected from Tables 1-6 (it should be reminded that only the fatty acid C24:0
gave no statistical differences among flowering stages). Group corresponding to F1 is
mainly characterized by the high levels in quinic acid, organic acids, hexosyl caffeic
acid, kaempferol-3-O-rutinoside, isorhamnetin dihexoside, C14:1, C18:3, PUFA, α -tocopherol and γ-tocopherol, and low contents in malic acid, C8:0, C10:0, C16:0 and
C20:1. F2, by its side, distinguished for having high contents in fructose, glucose, total
soluble sugars, low contents in isorhamnetin-3-O-rutinoside, isorhamnetin rhamonsyl-rutinoside, C12:0, C13:0, C18:1, MUFA and β-tocopherol and also for having low
Finally, the most divergent characteristics for F3 were its high contents in hexosyl
ferulic acid, C20:0, C20:2 and SFA, and low amounts in citric acid, trehalose,
isorhamnetin-3-O-galactoside and C23:0.
Conclusion
The three assayed flowering stages displayed identical chemical profiles from a
qualitative point of view; except for the fact that F3 was the only stage presenting
C20:2. The three stages presented exactly the same soluble sugars, organic acids,
phenolic compounds, fatty acids and tocopherols. Nevertheless, the amounts in each
stage showed statistically significant differences, which were reflected in the
antioxidant activity results. In fact, the extracts of F1 proved to have the highest radical
scavenging activity and reducing power, in agreement with their higher amounts of
phenolic acids and flavoinds, and also the most effective lipid peroxidation inhibition,
(as shown in β-carotene bleaching inhibition and TBARS formation inhibition), as
expected from their higher amounts in tocopherols and PUFA. These differences were
meaningfully reflected in the applied PCA, as it could be observed by the distribution of
the biplot markers in different clusters (corresponding to each flowering stage), which
allowed the prompt observation of all significant differences in an integrated manner.
The detected differences might be useful for the selection of a specific flowering stage
concerning its incorporation in functional foods.
Acknowledgements
The authors are grateful to Fundação para a Ciência e a Tecnologia (FCT, Portugal) for
financial support to CIMO (strategic project PEst-OE/AGR/UI0690/2011), João C.M.
2008” contract). The GIP-USAL is financially supported by the Spanish Government
through the Consolider-Ingenio 2010 Programme (FUN-C-FOOD, CSD2007-00063).
References
Alimi, H, Hfaiedh, N., Bouoni, Z., Sakly, M., & Ben Rhouma, K. (2011). Evaluation of
antioxidant and antiulcerogenic activities of Opuntia ficus indica f. inermis
flowers extract in rats. Environmental Toxicology and Pharmacology, 32, 406-416.
Ammar, I., Ennouri, M., Khemakhem, B., Yangui, T., & Attia, H. (2012). Variation in
chemical composition and biological activities of two species of Opuntia flowers at four stages of flowering. Industrial Crops and Products, 37, 34-40.
Barros, L., Carvalho, A.M., Sá Morais, J., & Ferreira, Isabel C.F.R. (2010).
Strawberry-tree, blackthorn and rose fruits: Detailed characterization in nutrients and
phytochemicals with antioxidant properties. Food Chemistry, 120, 247-254. Barros, L., Pereira, C., & Ferreira, Isabel C.F.R. (2013). Optimized analysis of organic
acids in edible mushrooms from Portugal by ultra fast liquid chromatography and
photodiode array detection. Food Analytical Methods, 6, 309-316.
Bernal, J., Mendiola, J.A., Ibáñez, E., & Cifuentes, A. (2011). Advanced analysis of
nutraceuticals. Journal of Pharmaceutaical and Biomedical Analysis, 55, 758-774.
Burton, G.W. & Traber, M.G. (1990). Vitamin E: Antioxidant activity, biokinetics, and
bioavailability. Annual Review of Nutrition, 10, 357-382.
Carocho, M. & Ferreira, Isabel C.F.R. (2013). A review on antioxidants, prooxidants
methodologies and future perspectives. Food and Chemical Toxicology, 51, 15-25.
Cheung, L.M., Cheung, P.C.K., & Ooi, V.E.C. (2003). Antioxidant activity and total
phenolics of edible mushroom extracts. Food Chemistry, 81, 249-255.
Feugang, J.M., Konarski, P., Zou, D., Stintzing, F.C., & Zou, C. (2006). Nutritional and
medicinal use of Cactus pear (Opuntia spp.) cladodes and fruits. Frontiers in Bioscience, 11, 2574-2589.
Galati, E.M., Tripodo, M.M., Trovato, A., Miceli, N., & Monforte, M.T. (2002).
Biological effect of Opuntia ficus indica (L.) Mill. (Cactaceae) waste matter.
Journal of Ethnopharmacology, 79, 17-21.
Heim, K.E., Tagliaferro, A.R., & Bobilya, D.J. (2002). Flavonoid antioxidants:
chemistry, metabolism and structure-activity relationships. Nutritional Biochemistry, 13, 572-584.
Kagan, V.E., Kuzmenko, A.I., Shvedova, A.A., Kisin, E.R., Li, R., Martin, I., Quinn,
P.J., Tyurin, V.A., Tyurina, Y.Y., & Yalowich, J.C. (2003). Direct evidence for
recycling of myeloperoxidase-catalyzed phenoxyl radicals of a vitamin E
homologue,2,2,5,7,8-pentamethyl-6-hydroxy chromane, by
ascorbate/dihydrolipoate in living HL-60 cells. Biochimica et Biophysica Acta, 1620, 72-84.
Leo, M.D., Abreu, M.B.D., Pawlowska, A.M., Cioni, P.L., & Braca, A. (2010).
Profiling the chemical content of Opuntia ficus-indica flowers by HPLC-PDA-ESI-MS and GC/EIMS analyses. Phytochemistry Letters, 3, 48-52.
Li, A.-N., Li, S., Li H.-B., Xu, D.-P., Xu, X.-R., Chen, F. (2014). Total phenolic
Moing, A., Renaud, C., Gaudillère, M., Raymond, P., Roudeillac, P., &
Denoyes-Rothan, B. (2001). Biochemical changes during fruit development of four
strawberry cultivars. Journal of the American Society of Horticulture Sciences.
126, 394-403.
Nookaraju, A., Upadhyaya, C.P., Pandey, S.K., Young, K.E., Hong, S.J., Park, S.K., &
Park, S.W. (2010). Molecular approaches for enhancing sweetness in fruits and
vegetables. Scientia Horticulturae, 127, 1-15.
Pallarès, V., Fernández-Iglesias, A., Cedó, L., Castell-Auví, A.,Pinent, M., Ardévol, A.,
Salvadó, M.J., Garcia-Vallvé, S., & Blay, M. (2013). Grape seed procyanidin
extract reduces the endotoxic effects induced by lipopolysaccharide in rats. Free Radical Biology and Medicine, 60,107-114.
Patras, A., Brunton, N.P., Downey, G., Rawson, A., Warriner, K., & Gernigon, G.
(2011). Application of principal component and hierarchical cluster analysis to
classify fruits and vegetables commonly consumed in Ireland based on in vitro
antioxidant activity. Journal of Food Composition and Analysis, 24, 250-256. Pinela, J., Barros, L., Dueñas, M., Carvalho, A.M., Santos-Buelga, C., & Ferreira, Isabel
C.F.R. (2012). Antioxidant activity, ascorbic acid, phenolic compounds and
sugars of wild and commercial Tuberaria lignosa samples: effects of drying and oral preparation methods. Food Chemistry, 135, 1028-1035.
Senanayake, S.P.J.N. (2013). Green tea extract: Chemistry, antioxidant properties
and food applications -‐ A review. Journal of Functional Foods, 5, 1529-‐1541.
Stintzing, F.C. & Carle, R. (2005). Cactus stems (Opuntia spp.): A review on their
Traber, M.G. (2007). Vitamin E regulatory mechanisms. Annual Review of Nutrition,
27, 347-362.
Whelan, J. (2008). The health implications of changing linoleic acid intakes.
Prostaglandins, Leukotrienes and Essential Fatty Acids, 79, 165-167.
Yeddes, N., Chérif, J.K., Guyot, S., Baron, A., & Trabelsi-Ayadi, M. (2014). Phenolic
profile of Tunisian Opuntia ficus indica thornless form flowers via
chromatographic and spectral analysis by reversed phase-high performance liquid
chromatography-UV-photodiode array and electrospray ionization-mass
Table1. Soluble sugars composition (g/100 g dw) in three stages of flowering (F1-F3)
of Opuntia microdasys (mean± SD).
Fructose1 Glucose1 Sucrose1 Trehalose1 Soluble sugars1
Flowering stage
F1 2.17±0.03 b 2.42±0.05 c 1.61±0.05 b 1.50±0.04 a 7.7±0.1 b
F2 5.96±0.02 a 4.97±0.03 a 1.90±0.02 a 1.42±0.04 b 14.2±0.1 a
F3 2.12±0.02 c 2.89±0.03 b 0.61±0.01 c 1.08±0.01 c 6.7±0.1 c
Homoscedasticity2 p-value 0.287 0.008 <0.001 0.002 0.308
One-way ANOVA3 p-value <0.001 <0.001 <0.001 <0.001 <0.001
1
Means were evaluated using Tukey (homoscedasticity) or Tamhane’s T2 (heteroscedasticity) post hoc tests. 2
Homoscedasticity among cultivars was tested by means of the Levene test: homoscedasticity, p-value>0.05; heteroscedasticity, p-value<0.05.
3
Table 2. Organic acids composition (g/100 g dw) in three stages (F1-F3) of flowering of Opuntia microdasys (mean± SD).
Oxalic acid1 Quinic acid1 Malic acid1 Citric acid1 Organic acids1
Flowering stage
F1 1.13±0.01 a 2.37±0.05 a 0.67±0.01 c 2.08±0.02 a 6.2±0.2 a
F2 0.72±0.01 c 0.41±0.01 b 1.10±0.01 a 2.09±0.05 a 4.3±0.1 b
F3 0.99±0.01 b 0.039±0.001 c 1.06±0.02 b 1.62±0.01 b 3.7±0.1 c
Homoscedasticity2 p-value 0.014 <0.001 0.008 0.001 0.005
One-way ANOVA3 p-value <0.001 <0.001 <0.001 <0.001 <0.001
1
Means were evaluated using Tukey (homoscedasticity) or Tamhane’s T2 (heteroscedasticity) post hoc tests. 2
Homoscedasticity among cultivars was tested by means of the Levene test: homoscedasticity, p-value>0.05; heteroscedasticity, p-value<0.05.
3
Table 3. Retention time (Rt), wavelengths of maximum absorption (λmax), mass spectral data, relative abundances of fragment ions, tentative
identification and quantification of the phenolic compounds in three stages of flowering (F1-F3) of Opuntia microdasys (mean± SD).
Peak Rt (min)
λmax
(nm)
Molecular ion
[M-H]- (m/z) MS
2 (m/z) Tentative identification
Quantification1
(µg/g extract)
Homoscedasticity2 One-way
ANOVA3
F1 F2 F3 p-value p-value
1 6.1 326 341 179(71), 161(90), 135(19) Hexosyl caffeic acid 700±5 a 264±1 b 254±3 c 0.007 <0.001
2 6.6 326 475 179(16), 161(39), 135(13) Caffeic acid derivative 469±9 a 255±8 c 309±3 b 0.012 <0.001
3 9.8 312 459 163(38), 145(100) p-Coumaric acid derivative 178±1 a 65±1 c 105±1 b 0.073 <0.001
4 10.4 328 355 193(17), 175(100), 149(5) Hexosyl ferulic acid 363±7 b 364±4 b 605±4 a 0.023 <0.001
5 12.1 326 489 337(8), 295(17), 235(52),
193(78), 175(60), 149(8) Ferulic acid derivative 786±8 a 291±2 c 487±29 b <0.001 <0.001
6 12.9 354 579 447(60), 285(40) Kaempferol pentosyl-hexoside 266±7 b 111±1 c 395±6 a 0.002 <0.001
7 19.8 354 769 623(2), 315(78) Isorhamnetin
rhamnosyl-rutinoside 3765±22 a 962±2 c 3518±33 b 0.001 <0.001
8 20.5 356 639 315(100) Isorhamnetin dihexoside 565±9 a 268±1 b 222±6 c <0.001 <0.001
9 21.2 348 593 285(100) Kaempferol-3-O-rutinoside 442±3 a 210±1 b 159±3 c <0.001 <0.001
10 24.4 352 623 315(100) Isorhamnetin-3-O-rutinoside 6960±48 a 559±2 c 5167±50 b <0.001 <0.001
11 25.0 354 623 315(90) Isorhamnetin-3-O-robinobioside 8417±51 a 542±3 c 3863±56 b 0.001 <0.001
12 26.0 354 477 315(100) Isorhamnetin-3-O-glucoside 2419±27 a 1836±8 b 1500±17 c <0.001 <0.001
13 26.6 354 477 315(100) Isorhamnetin-3-O-galactoside 210±2 a 192±3 b 98±2 c 0.233 <0.001
Phenolic acids 2947±23 a 1239±35 c 1760±5 b 0.044 <0.001
Flavonoids 23043±117 a 4680±12 c 14921±142 b 0.010 <0.001
1
Means were evaluated using Tukey (homoscedasticity) or Tamhane’s T2 (heteroscedasticity) post hoc tests.
2
Homoscedasticity among cultivars was tested by means of the Levene test: homoscedasticity, p-value>0.05; heteroscedasticity, p-value<0.05.
3
Table 4. Fatty acids composition (relative percentage) in three stages of flowering (F1-F3) of Opuntia microdasys (mean± SD).
Fatty acids* Flowering stage
1 Homoscedasticity2 One-way ANOVA3
(F1) (F2) (F3) p-value p-value
C6:0 0.20±0.01 b 0.10±0.01 c 0.27±0.03 a 0.024 <0.001
C12:0 0.89±0.04 a 0.56±0.04 c 0.81±0.05 b 0.134 <0.001
C14:0 2.05±0.03 a 1.44±0.03 c 1.81±0.05 b 0.063 <0.001
C15:0 0.71±0.05 a 0.55±0.04 b 0.37±0.05 c <0.001 <0.001
C16:0 32±1 c 36±1 b 39±1 a 0.015 <0.001
C16:1 0.36±0.03 b 0.48±0.05 a 0.28±0.03 c <0.001 <0.001
C17:0 0.61±0.04 a 0.50±0.05 b 0.38±0.03 c 0.011 <0.001
C18:0 4.3±0.1 a 4.4±0.2 a 4.0±0.1 b 0.052 <0.001
C18:1 9.0±0.3 c 11.2±0.3 a 9.8±0.2 b 0.136 <0.001
C18:2 20±1 a 18.6±0.2 b 16.5±0.1 c <0.001 <0.001
C18:3 18.8±0.1 a 15.6±0.5 b 15.4±0.2 b 0.032 <0.001
C20:0 4.2±0.3 b 3.9±0.2 b 4.6±0.1 a 0.147 <0.001
C20:1 0.10±0.01 c 0.20±0.01 b 0.31±0.03 a 0.013 <0.001
C20:2 nd nd 0.46±0.03 - -
C22:0 4.4±0.5 a 3.8±0.2 b 3.3±0.1 c <0.001 <0.001
C24:0 2.0±0.4 1.8±0.3 1.9±0.1 0.005 0.382
SFA 52±1 c 54±1 b 57±1 a 0.058 <0.001
MUFA 9.6±0.3 c 11.8±0.4 a 10.4±0.2 b 0.171 <0.001
PUFA 39±1 a 34±1 b 32±1 c 0.004 <0.001
*Caproic acid (C6:0); lauric acid (C12:0); myristic acid (C14:0); pentadecanoic acid (C15:0); palmitic acid (C16:0); palmitoleic acid (C16:1); heptadecanoic acid (C17:0); stearic acid (C18:0); oleic acid (C18:1); linoleic acid (C18:2); linolenic acid (C18:3); arachidic acid (C20:0); eicosenoic acid (C20:1c); eicosadienoic acid (C20:2); behenic acid (C22:0); lignoceric acid (C24:0).
1
Means were evaluated using Tukey (homoscedasticity) or Tamhane’s T2 (heteroscedasticity) post hoc tests.
2
Homoscedasticity among cultivars was tested by means of the Levene test: homoscedasticity, p-value>0.05; heteroscedasticity, p-value<0.05.
3
Table 5. Tocopherols composition (mg/100 g dw) in three stages (F1-F3) of flowering of Opuntia microdasys (mean± SD).
α-tocopherol1 β-tocopherol1 γ-tocopherol1 δ-tocopherol1 Total tocopherol1
Flowering stage
F1 3.6±0.1 a 0.28±0.01 b 0.36±0.01 a 0.30±0.01 b 4.6±0.1 a
F2 1.33±0.04 c 0.13±0.01 c 0.12±0.01 c 0.16±0.01 c 1.7±0.1 c
F3 1.5±0.1 b 0.34±0.02 a 0.16±0.01 b 0.50±0.02 a 2.5±0.2 b
Homoscedasticity2 p-value 0.005 0.031 0.012 0.001 0.009
One-way ANOVA3 p-value <0.001 <0.001 <0.001 <0.001 <0.001
1
Means were evaluated using Tukey (homoscedasticity) or Tamhane’s T2 (heteroscedasticity) post hoc tests.
2
Homoscedasticity among cultivars was tested by means of the Levene test: homoscedasticity, p-value>0.05; heteroscedasticity, p-value<0.05.
3
Table 6. Antioxidant activity of methanolic extracts obtained from three stages of flowering (F1-F3) of Opuntia microdasys (mean± SD).
Antioxidant assays (EC50, mg/mL)1
DPPH scavenging
activity2
Reducing
power2
β-carotene bleaching
inhibition2
TBARS
inhibition2
Flowering stage
F1 0.70±0.03 c 0.169±0.002 c 0.126±0.004 c 0.050±0.001 c
F2 1.00±0.01 a 0.356±0.003 a 0.28±0.01 a 0.141±0.003 a
F3 0.88±0.02 b 0.200±0.002 b 0.15±0.01 b 0.059±0.001 b
Homoscedasticity3 p-value 0.018 0.826 0.008 0.141
One-way ANOVA4 p-value <0.001 <0.001 <0.001 <0.001
1
EC50 values correspond to the sample concentration achieving 50% of antioxidant activity or 0.5 of absorbance in reducing power
assay. In each row different letters mean significant differences (p < 0.05).
2
Means were evaluated using Tukey (homoscedasticity) or Tamhane’s T2 (heteroscedasticity) post hoc tests.
3
Homoscedasticity among cultivars was tested by means of the Levene test: homoscedasticity, p-value>0.05; heteroscedasticity, p-value<0.05.
4
Figure 1. HPLC chromatogram of the phenolic compounds of Opuntia microdasys
flowers at the assayed flowering stages recorded at 370 nm: F1, black dashed line; F2,
grey line; F3, black line. 1- Hexosyl caffeic acid; 2- Caffeic acid derivative; 3-
p-Coumaric acid derivative; 4- Hexosyl ferulic acid; 5- Ferulic acid derivative; 6-
Kaempferol pentosyl-hexoside; 7- Isorhamnetin rhamnosyl-rutinoside; 8- Isorhamnetin
dihexoside; 9- Kaempferol-3-O-rutinoside; 10- Isorhamnetin-3-O-rutinoside; 11-
O-robinobioside; 12- O-glucoside; 13-
Isorhamnetin-3-O-galactoside.
Figure 2. Biplot of objects and component loadings using flowering stage as labeling