Crashworthiness Performance of Stiffened Foam-filled Tapered
Structures under Axial and Oblique Dynamic Loads
Abstract
This paper aims to explore crashworthiness performance of new designed foam-filled tapered structures under axial and oblique impact load conditions. The structures consisted of inner and outer tapered tubes connected together by four stiffening plates. They also included square, hexagonal, octagonal, decagonal and circular cross-sectional shapes with different ratios of a/b (ratio of the inner tube side length to the outer tube one). The ratio of a/b was assumed to be 0, 0.25, 0.5, 0.75 and 1. Crashworthiness criteria of specific energy absorption (SEA), peak collapse force (Fmax) and crash force efficiency (CFE) were
obtained for these structures using the experimentally validated model in LS-DYNA. Based on the numerical results, semi-foam filled structures (i.e. those with the ratio of a/b=0.5) demonstrated greater crashworthiness performance than foam filled single-cell ones. Furthermore, according to the TOPSIS calculations, cross sectional shape of decagonal was found to be an outstanding potential profile for the automobile structural components.
Keywords
Crashworthiness, Foam-filled tapered structure, Axial and oblique loads, TOPSIS
1 INTRODUCTION
Application of aluminum in automobile body and components has been increased in recent decades due to its low cost and high weight-stiffness efficiency. In addition, automobile parts made of aluminum can be produced to almost any shape via extrusion processes (Hou et al., 2007). Because of the mentioned manufacturing benefits, new interesting thin-walled structures made of aluminum have been introduced by the researchers to further improve the crashworthiness capacity and automobile safety. For example, Hosseini-Tehrani and Pirmohammad (2007, 2010, 2011) studied crushing behavior of aluminum extruded tubes with different cross-sectional shapes. In another study, Esmaeili-Marzdashti et al. (2017) investigated crashworthiness of the S-shaped octagonal tubes with different cross-sections. Liu and Day (2008) studied bending collapse of thin-walled circular tubes made of aluminum. Tran et al. (2014) investigated the collapse behavior of aluminum extruded square tubes with different profiles.
Many investigations have been also made on the tapered tubes. For example, Ghamarian et al. (2011) investigated crashworthiness performance of circular end-capped tapered columns experimentally and numerically. Qi et al. (2012) and Hosseini-Tehrani et al. (2008) investigated crashworthiness of tapered square tubes. Nagel and Thambiratnam (2005, 2006) compared the energy absorption response of straight and tapered thin-walled rectangular tubes under quasi-static axial loading. They showed that the tapered tubes are desirable energy absorbers due to their relatively stable crush load and deformation response compared with straight tubes.
Because of some outstanding reasons, such as having higher energy absorption capacity and lower weight, foam-filled thin-walled structures have been widely used in automobile, railway and aerospace industries. Many investigations have been performed experimentally (Meguid et al., 2004; Reyes et al., 2004; Mamalis et al., 2008; Seitzberger et al., 1997) analytically (Wang et al., 2007; Niknejad et al., 2011; Gupta and Velmurugan, 1999) and numerically (Ahmad and Thambiratnam, 2009a; Ziaei-Rad et al., 2008; Santosa et al., 2001; Fang et al., 2016) on the foam-filled thin-walled structures. Reid et al. (1986) studied quasi-static and dynamic axial crushing of empty and polyurethane foam-filled square and rectangular tubes manufactured from sheet metal. They discussed on both the stability and the energy absorbing characteristics of these tubes. Reddy and Wall (1988) performed some experiments on the circular tubes filled with polyurethane foam. They observed that the foam filler not only stabilizes the buckling mechanism of the empty
Sadjad PirmohammadA*
Soheil Ahmadi SaravaniB
A Department of Mechanical Engineering,
University of Mohaghegh Ardabili, Ardabil, Iran. E-mail: [email protected]
B Department of Mechanical Engineering,
University of Mohaghegh Ardabili, Ardabil, Iran. E-mail: [email protected] *Corresponding Author
http://dx.doi.org/10.1590/1679-78254596
deformation mode of tube from diamond into concertina. In another study, the experimental and numerical crushing responses of polystyrene foam-filled thin-walled aluminum tubes were investigated by Aktay et al. (2006). They observed that the energy absorption capacity of foam-filled tubes were higher than the sum of the energy absorption capacities of empty tube and foam-filler. Ghamarian et al. (2013) studied crashworthiness of the foam-filled conical tubes with shallow spherical caps. Ahmad et al. (2010) investigated collapse response of foam-filled conical tubes. Ahmad and Thambiratnam (2009b) made an investigation on the crushing behavior of circular tapered tubes under quasi-static and dynamic axial loading. Hou et al. (2011) investigated the collapse behavior of tapered structures of hollow single, foam filled single and collinear double tubes. Song et al. (2013) optimized geometry of the foam filled tapered columns using several models.
In addition, some researchers used foam-filled double-cell tubes to improve the energy absorption capabilities of thin-walled tubes. For example, Yuen et al. (2008) mad an experimental work on the crushing characteristics of double-cell square and circular tubes filled with foam. According to their results, the foam-filled double-double-cell profiles made with circular tubes had higher energy absorption capabilities than those made with square tubes. Fang et al. (2014) studied crashworthiness of foam-filled bitubal structures with circular cross section. In another study, Zhang et al. (2012) optimized dimensions of foam-filled bitubal tubes with square cross section. Zheng et al. (2014) compared the energy absorption capabilities of foam-filled single and bitubal polygonal tubes under axial loading. Their results showed that the foam-filled circular bitubal column was the most promising configuration.
Previous studies reveal that combination of tapered tubes and foam filler perform very well as the energy absorption devices. Therefore, new designs of foam-filled tapered structures were investigated in the present study. Crushing behavior of these structures was simulated in LS-DYNA. In order to compare the structures, the crashworthiness indicators, SEA (specific energy absorption), Fmax (peak collapse force) and CFE (crash force efficiency) were calculated from the numerical analyses. TOPSIS method was finally used to select the best structure in terms of energy absorption capability.
2 GEOMETRY OF STIFFENED FOAM FILLED TAPERED STRUCTURES AND FINITE ELEMENT MODELING
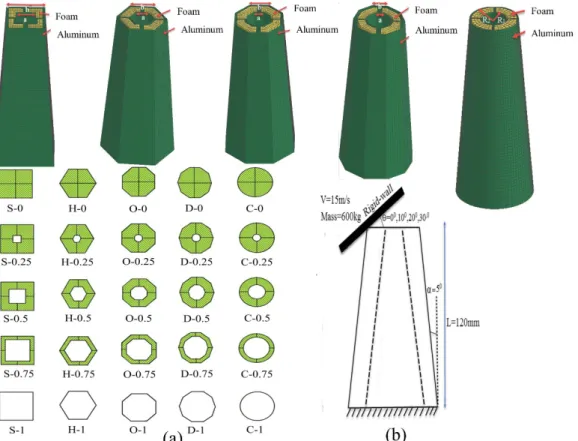
Fig. 1a displays the structures studied in the present research. According to this figure, the structures consist of two inner and outer tapered tubes, which have been connected together by four stiffening plates. These structures include square, hexagonal, octagonal, decagonal and circular cross-sectional shapes with different ratios of a/b (ratio of the inner tube side length to the outer tube one). Meanwhile, polyurethane foam was employed to fill the spaces between the inner and outer tubes. The ratio of a/b was assumed to be 0, 0.25, 0.5, 0.75 and 1 for all the cross sectional shapes illustrated in Fig. 1a. It is noticed that the ratios of a/b=0 and a/b=1 refer to the simple stiffened foam-filled tapered structure (without the inner tube) and single-cell tapered structure (without the inner tube and foam), respectively; whereas, the other ratios of a/b refer to the stiffened foam-filled structures with two concentric tapered tubes connected together by four plates. According to Fig. 1a, the structures studied in the present work were designated as S-r, H-r, O-r, D-r, and C-r for convenience, which S, H, O, D, C represent the structures with square, hexagonal, octagonal, decagonal and circular cross-sectional shapes, respectively, and r represents the value of R1/R2 (for circular structure) or a/b (for other structures).
All the tapered structures studied in the current work had the same thickness of 2mm and total length of 120mm. Perimeter of the outer tube at the large end was also taken the same (equal with 160mm) for all the studied structures. In addition, the tapered angle was taken α=5° for all the structures (see Fig. 1b).
All the structures had the same boundary and impact conditions. According to Fig. 1b, the large end of the tapered structures was constrained in all directions to simulate the clamping support, and the small end was assumed free. A moving rigid-wall with a speed of 15m/s and mass of 600kg impacted on the small end of the tapered structures at different axial (θ=0°) and oblique (θ=10°, 20° and 30°) angles. In order to measure the crashworthiness capacity, all the structures were crushed 90mm (75% of the total length).
Crashworthiness performance of the foam-filled tapered structures was studied using the non-linear finite element code LS-DYNA. Four-node Belytschko–Tsay shell elements with five integration points through the thickness were used in the present study, which suitably model the crushing behavior of the structures. In addition, eight-node solid elements with hourglass control (to avoid spurious zero energy collapse modes) and reduced integration techniques (to avoid volumetric locking) were used for modeling the foam (Mamalis et al., 2008). Mesh convergence analyses were carried out in LS-DYNA, and the element sizes of 2mm×2mm for the shell elements and 2mm×2mm×2mm for the solid elements were finally found suitable.
A suitable contact algorithm for modeling the interaction between the structure walls and foam filler was needed. Thereby, AUTOMATIC-SURFACE-TO-SURFACE algorithm was defined for the contact interfaces of the foam and structure walls. This contact algorithm was also used for the contact between the rigid-wall and the structure walls. Furthermore, AUTOMATIC-SINGLE-SURFACE algorithm was employed for not penetrating structure walls into each other. MODIFIED-PIECEWISE-LINEAR-PLASTICITY code was employed to simulate the aluminum properties, and crushable foam material model (MAT_CRUSHABLE_FOAM code) was used to model the foam properties in LS-DYNA. Also, the moving rigid-wall was modelled by MAT-RIGID code in LS-LS-DYNA. The rigid-wall was constrained to move only along the vertical axis, while a tied constraint was defined for the large end of the tapered structures.
The friction coefficient related to the contact between the foam filler and structure walls influences the crushing force remarkably, and it is very hard to characterize this parameter from the experiments. This was regarded as a variable in the numerical analysis to achieve correlation with experimental results. Therefore, the friction coefficient of 0.2 was found a suitable value. In addition, the contact between the structure walls and rigid-wall was assumed frictionless.
Figure 2: (a) Plastic behavior of Aluminum alloy AA6060, (b) true stress-strain for the polyurethane foam (Rezvani and Jahan, 2015)
3 MODEL VALIDATION
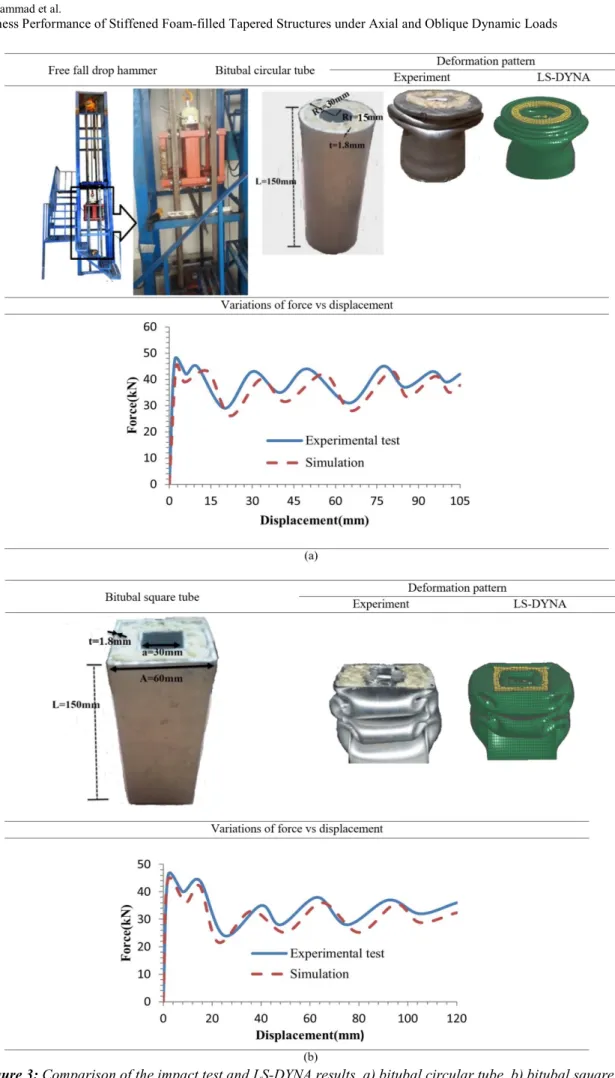
bitubal specimens. According to Fig. 3, good agreements were achieved between the impact tests and numerical simulations in terms of the deformation patterns and the force–displacement responses.
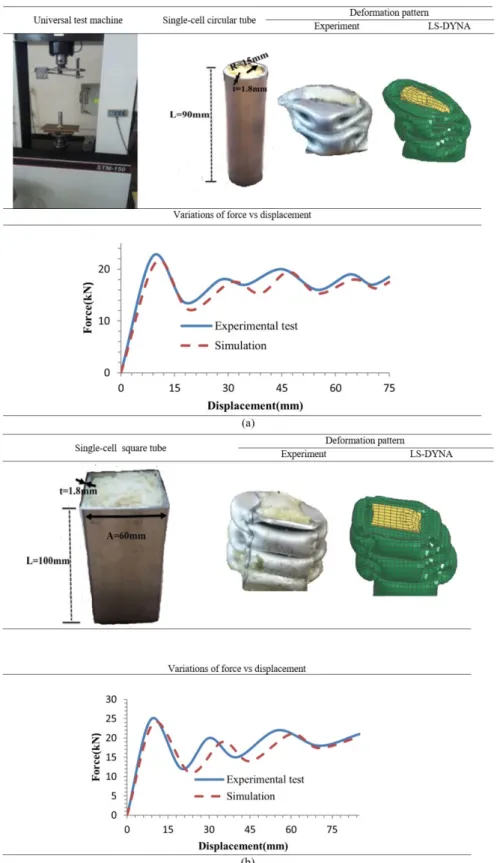
Figure 4: Comparison of the universal test and LS-DYNA results, a) single-cell circular tube, b) single-cell square tube
4 CRASHWORTHINESS INDICATORS
0
( )
cF d
EA
SEA
m
m
(1)where, EA is the energy absorbed by a structure, which can be calculated as the area under the force-displacement curve. In addition, δc is the maximum displacement that rigid-wall collapses a structure, δ is the rigid-wall displacement, and F(δ) is variations of force versus displacement. Meanwhile, m is the total mass of structure.
SEA is frequently used for indicating energy absorption capacity of structures. A suitable thin-walled structure must have higher value of SEA.
Another important crashworthiness criterion used by vehicle engineers is the peak collapse force which is defined as below:
m ax ( )
F M ax F orce displacem ent curve (2)
Hence, the maximum force available in the force-displacement curve is defined as the Fmax, which is attempted to reduce for the sake of vehicle safety. Therefore, a suitable thin-walled structure must have less value of Fmax.
Another crashworthiness indicator is the crash force efficiency (CFE) which is calculated by the division of the mean collapse load (Fmean) to the Fmax as follows:
max mean
F
CFE
F
(3)Mean collapse force (Fmean) is the ratio of the total energy absorbed by a structure to the effective stroke length δ. Similar to the SEA, the greater is the value of CFE the better is the crashworthiness of thin-walled structure.
5 NUMERICAL RESULTS AND DISCUSSIONS
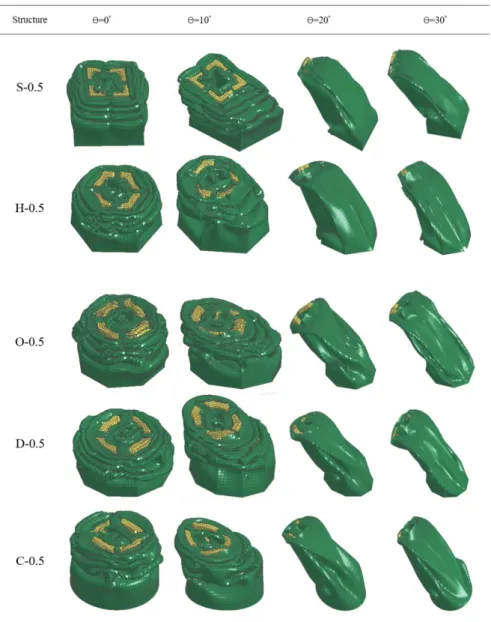
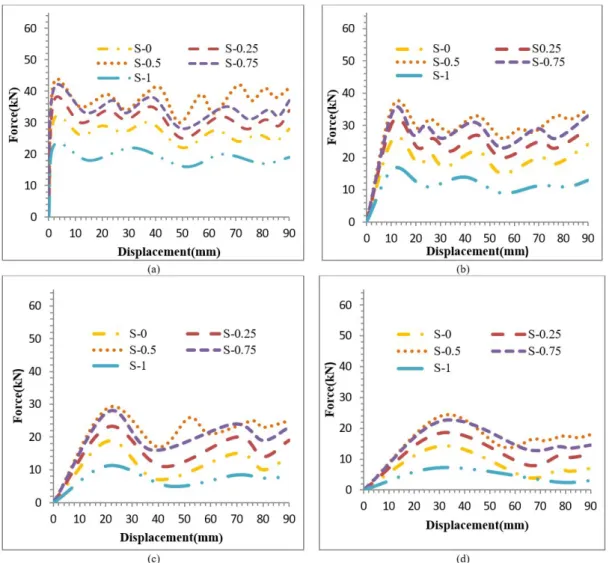
Crushing behavior of the structures displayed in Fig. 1 was analyzed in LS-DYNA based on the explanations given in Section 2. Fig. 5 shows deformation patterns of the foam-filled tapered structures for the case of a/b=0.5. It is noticed that for the sake of brevity, the deformation patterns have been given in Fig. 5 only for the case of a/b=0.5. It is also reminded that the rigid-wall identically crushed 75% of the total length of the structures (i.e. 90mm from the total length of 120mm). As seen in Fig. 5, the square structure showed progressive and concertina deformation pattern; while, the structures with other cross sectional shapes progressively collapsed in diamond mode under axial impact.
When the structures were loaded under the oblique impact of θ=10°, all the structures showed mixed mode of progressive diamond and global bending. Meanwhile, the structures tended to slide sideways a little because of the oblique loading. However, effective progressive deformation pattern was still observed for θ=10° similar to the axial impact. For the larger oblique impacts of θ=20° and θ=30°, all the structures collapsed in the less effective global bending mode. Therefore, all the structures absorbed the rigid-wall energy by bending at the regions near to the incidental and distal ends. As is well known, structures are desired to be loaded axially due to dissipating remarkable collision energy; nevertheless, the oblique impact is inevitable in the real vehicle collisions, so the structures must have ability of absorbing higher collision energy under oblique impacts.
Figure 6: Force-displacement curves for the square structures subjected to the impact angles a) Ɵ=0°, b) Ɵ=10°, c) Ɵ=20°, d) Ɵ=30°
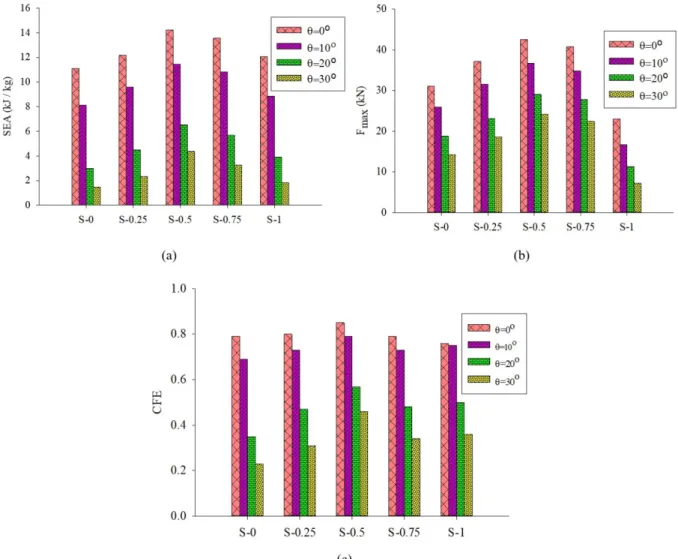
Fig. 7a depicts values of the SEA calculated for the foam-filled square tapered structures with different ratios of a/b under different impact angles. As seen in Fig. 7a, by increasing the ratio of a/b, the value of SEA increased to reach its maximum value at the ratio of a/b=0.5, and then decreased. Meanwhile, this trend of SEA variations was observed for all the structures with different cross sectional shapes under both the axial and oblique impacts (see Tables 1a-5a). Furthermore, as seen in Fig. 7a, by increasing the impact angle, values of the SEA reduced due to changing the collapse mode from progressive folding into the global bending. As is well known, the bending mode dissipates less energy than the progressive folding mode.
Fig. 7b shows values of the Fmax for the square structures. Similar to the results observed for the SEA, by increasing the ratio of a/b, value of the Fmax increased to reach its peak value at the ratio of a/b=0.5, and then reduced. In addition, by increasing the impact angle, values of the Fmax decreased. Because, the collapse mode was changed from progressive folding into the global bending as mentioned above; therefore, the level of force values for the bending collapses was considerably less than that for the folding one. It is worthmentioning that this trend of Fmax variations was also observed for all the structures studied in this research (see Tables 1a-5a).
Figure 7: Crashworthiness indicators of a) SEA, b) Fmax and c) CFE for the square structures under different loading angles
6 SELECTION OF THE SUITABLE RATIO OF a/b AND THE BEST CROSS SECTIONAL SHAPE
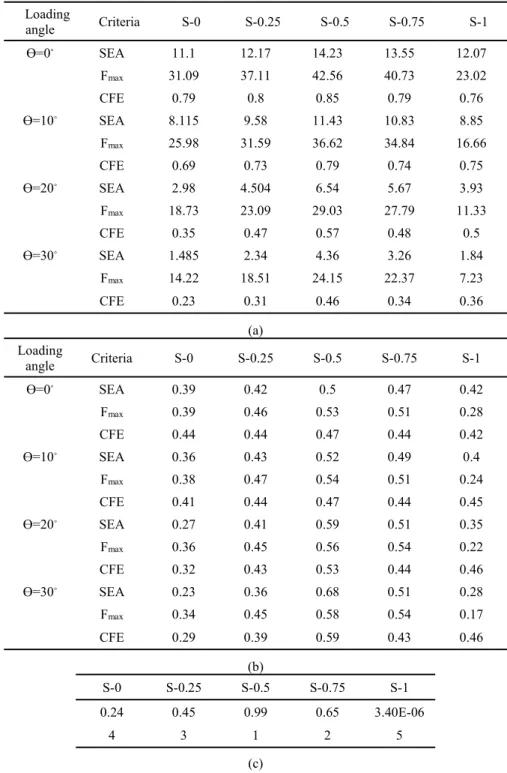
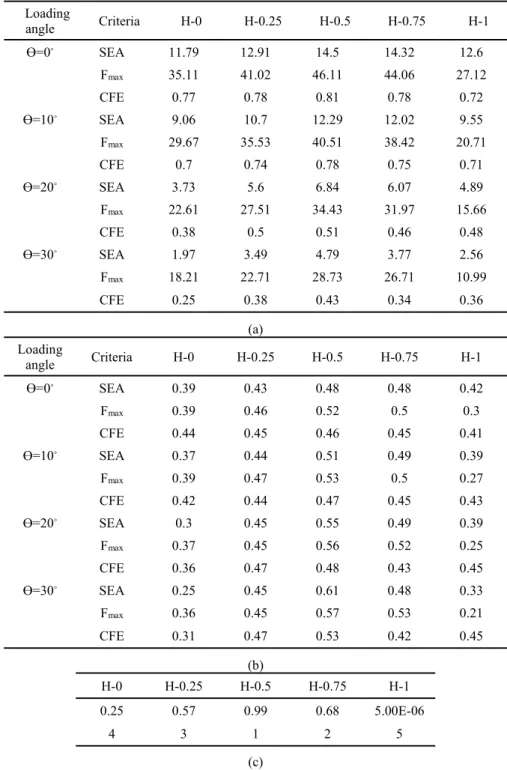
In order to select the suitable ratio of a/b and the best cross sectional shape for the structures studied in the present work, TOPSIS (technique for ordering preferences by similarity to ideal solution) method was employed. Indeed, TOPSIS is a decision making method when more than one criterion exists. Since there were three crashworthiness indicators (i.e. SEA, Fmax and CFE) for stating the crashworthiness capacity of the structures, so a decision making method was needed for selecting the suitable structure. In the TOPSIS, two artificial alternatives are considered i.e. ideal alternative (which has the best level for the crashworthiness indicators) and negative ideal alternative (which has the worst values of crashworthiness indicators). TOPSIS selects the alternative closest to the ideal alternative and farthest from the negative ideal one. More details on the formulation and theory of the TOPSIS can be found in (Pirmohammad and Nikkhah, 2017).
greater crashworthiness capability. Therefore, by using the stiffened bitubal structures with the ratio of 0.5, we can save in foam consumption, and weight of the structures can be significantly reduced as well. On the other hand, the single-cell structures (without the inner tube and foam) showed the worst energy absorption capacity. Consequently, the foam-filled structures generally demonstrated better crashworthiness performance than single-cell structures without the foam filler. Indeed, the foam available within the structures resisted against the inward penetration of the structure walls and stiffening plates during the collapsing process. These useful interactions between the foam and structure walls improved the crashworthiness capacity of the foam-filled structures.
Table 1: TOPSIS calculations for the foam-filled square tapered structures, a) decision making matrix, b) normalized decision making matrix, c) ranking results
Loading
angle Criteria S-0 S-0.25 S-0.5 S-0.75 S-1
Ɵ=0◦ SEA 11.1 12.17 14.23 13.55 12.07
Fmax 31.09 37.11 42.56 40.73 23.02
CFE 0.79 0.8 0.85 0.79 0.76
Ɵ=10◦ SEA 8.115 9.58 11.43 10.83 8.85
Fmax 25.98 31.59 36.62 34.84 16.66
CFE 0.69 0.73 0.79 0.74 0.75
Ɵ=20◦ SEA 2.98 4.504 6.54 5.67 3.93
Fmax 18.73 23.09 29.03 27.79 11.33
CFE 0.35 0.47 0.57 0.48 0.5
Ɵ=30◦ SEA 1.485 2.34 4.36 3.26 1.84
Fmax 14.22 18.51 24.15 22.37 7.23
CFE 0.23 0.31 0.46 0.34 0.36
(a) Loading
angle Criteria S-0 S-0.25 S-0.5 S-0.75 S-1
Ɵ=0◦ SEA 0.39 0.42 0.5 0.47 0.42
Fmax 0.39 0.46 0.53 0.51 0.28
CFE 0.44 0.44 0.47 0.44 0.42
Ɵ=10◦ SEA 0.36 0.43 0.52 0.49 0.4
Fmax 0.38 0.47 0.54 0.51 0.24
CFE 0.41 0.44 0.47 0.44 0.45
Ɵ=20◦ SEA 0.27 0.41 0.59 0.51 0.35
Fmax 0.36 0.45 0.56 0.54 0.22
CFE 0.32 0.43 0.53 0.44 0.46
Ɵ=30◦ SEA 0.23 0.36 0.68 0.51 0.28
Fmax 0.34 0.45 0.58 0.54 0.17
CFE 0.29 0.39 0.59 0.43 0.46
(b)
S-0 S-0.25 S-0.5 S-0.75 S-1
0.24 0.45 0.99 0.65 3.40E-06
4 3 1 2 5
Table 2: TOPSIS calculations for the foam-filled hexagonal tapered structures, a) decision making matrix, b) normalized decision making matrix, c) ranking results
Loading
angle Criteria H-0 H-0.25 H-0.5 H-0.75 H-1
Ɵ=0◦ SEA 11.79 12.91 14.5 14.32 12.6
Fmax 35.11 41.02 46.11 44.06 27.12
CFE 0.77 0.78 0.81 0.78 0.72
Ɵ=10◦ SEA 9.06 10.7 12.29 12.02 9.55
Fmax 29.67 35.53 40.51 38.42 20.71
CFE 0.7 0.74 0.78 0.75 0.71
Ɵ=20◦ SEA 3.73 5.6 6.84 6.07 4.89
Fmax 22.61 27.51 34.43 31.97 15.66
CFE 0.38 0.5 0.51 0.46 0.48
Ɵ=30◦ SEA 1.97 3.49 4.79 3.77 2.56
Fmax 18.21 22.71 28.73 26.71 10.99
CFE 0.25 0.38 0.43 0.34 0.36
(a) Loading
angle Criteria H-0 H-0.25 H-0.5 H-0.75 H-1
Ɵ=0◦ SEA 0.39 0.43 0.48 0.48 0.42
Fmax 0.39 0.46 0.52 0.5 0.3
CFE 0.44 0.45 0.46 0.45 0.41
Ɵ=10◦ SEA 0.37 0.44 0.51 0.49 0.39
Fmax 0.39 0.47 0.53 0.5 0.27
CFE 0.42 0.44 0.47 0.45 0.43
Ɵ=20◦ SEA 0.3 0.45 0.55 0.49 0.39
Fmax 0.37 0.45 0.56 0.52 0.25
CFE 0.36 0.47 0.48 0.43 0.45
Ɵ=30◦ SEA 0.25 0.45 0.61 0.48 0.33
Fmax 0.36 0.45 0.57 0.53 0.21
CFE 0.31 0.47 0.53 0.42 0.45
(b)
H-0 H-0.25 H-0.5 H-0.75 H-1
0.25 0.57 0.99 0.68 5.00E-06
4 3 1 2 5
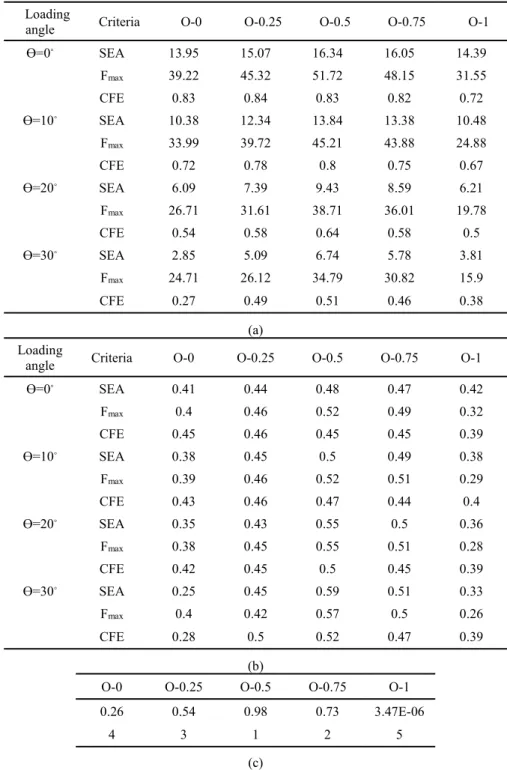
Table 3: TOPSIS calculations for the foam-filled octagonal tapered structures, a) decision making matrix, b) normalized decision making matrix, c) ranking results
Loading
angle Criteria O-0 O-0.25 O-0.5 O-0.75 O-1
Ɵ=0◦ SEA 13.95 15.07 16.34 16.05 14.39
Fmax 39.22 45.32 51.72 48.15 31.55
CFE 0.83 0.84 0.83 0.82 0.72
Ɵ=10◦ SEA 10.38 12.34 13.84 13.38 10.48
Fmax 33.99 39.72 45.21 43.88 24.88
CFE 0.72 0.78 0.8 0.75 0.67
Ɵ=20◦ SEA 6.09 7.39 9.43 8.59 6.21
Fmax 26.71 31.61 38.71 36.01 19.78
CFE 0.54 0.58 0.64 0.58 0.5
Ɵ=30◦ SEA 2.85 5.09 6.74 5.78 3.81
Fmax 24.71 26.12 34.79 30.82 15.9
CFE 0.27 0.49 0.51 0.46 0.38
(a) Loading
angle Criteria O-0 O-0.25 O-0.5 O-0.75 O-1
Ɵ=0◦ SEA 0.41 0.44 0.48 0.47 0.42
Fmax 0.4 0.46 0.52 0.49 0.32
CFE 0.45 0.46 0.45 0.45 0.39
Ɵ=10◦ SEA 0.38 0.45 0.5 0.49 0.38
Fmax 0.39 0.46 0.52 0.51 0.29
CFE 0.43 0.46 0.47 0.44 0.4
Ɵ=20◦ SEA 0.35 0.43 0.55 0.5 0.36
Fmax 0.38 0.45 0.55 0.51 0.28
CFE 0.42 0.45 0.5 0.45 0.39
Ɵ=30◦ SEA 0.25 0.45 0.59 0.51 0.33
Fmax 0.4 0.42 0.57 0.5 0.26
CFE 0.28 0.5 0.52 0.47 0.39
(b)
O-0 O-0.25 O-0.5 O-0.75 O-1
0.26 0.54 0.98 0.73 3.47E-06
4 3 1 2 5
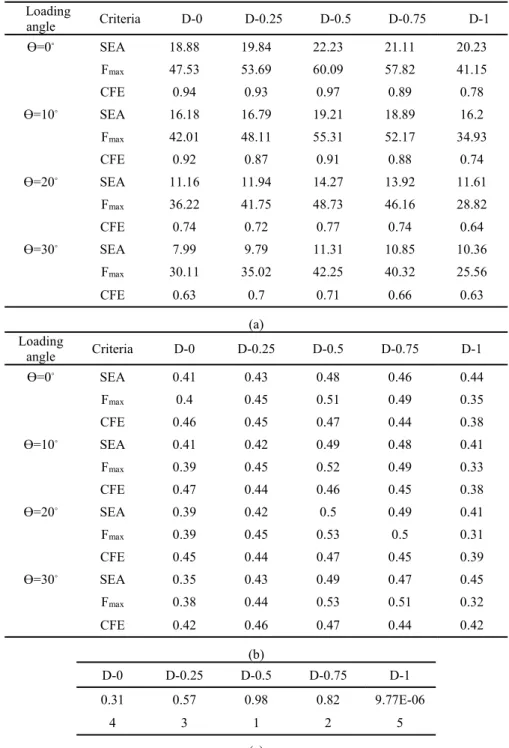
Table 4: TOPSIS calculations for the foam-filled decagonal tapered structures, a) decision making matrix, b) normalized decision making matrix, c) ranking results
Loading
angle Criteria D-0 D-0.25 D-0.5 D-0.75 D-1
Ɵ=0◦ SEA 18.88 19.84 22.23 21.11 20.23
Fmax 47.53 53.69 60.09 57.82 41.15
CFE 0.94 0.93 0.97 0.89 0.78
Ɵ=10◦ SEA 16.18 16.79 19.21 18.89 16.2
Fmax 42.01 48.11 55.31 52.17 34.93
CFE 0.92 0.87 0.91 0.88 0.74
Ɵ=20◦ SEA 11.16 11.94 14.27 13.92 11.61
Fmax 36.22 41.75 48.73 46.16 28.82
CFE 0.74 0.72 0.77 0.74 0.64
Ɵ=30◦ SEA 7.99 9.79 11.31 10.85 10.36
Fmax 30.11 35.02 42.25 40.32 25.56
CFE 0.63 0.7 0.71 0.66 0.63
(a) Loading
angle Criteria D-0 D-0.25 D-0.5 D-0.75 D-1
Ɵ=0◦ SEA 0.41 0.43 0.48 0.46 0.44
Fmax 0.4 0.45 0.51 0.49 0.35
CFE 0.46 0.45 0.47 0.44 0.38
Ɵ=10◦ SEA 0.41 0.42 0.49 0.48 0.41
Fmax 0.39 0.45 0.52 0.49 0.33
CFE 0.47 0.44 0.46 0.45 0.38
Ɵ=20◦ SEA 0.39 0.42 0.5 0.49 0.41
Fmax 0.39 0.45 0.53 0.5 0.31
CFE 0.45 0.44 0.47 0.45 0.39
Ɵ=30◦ SEA 0.35 0.43 0.49 0.47 0.45
Fmax 0.38 0.44 0.53 0.51 0.32
CFE 0.42 0.46 0.47 0.44 0.42
(b)
D-0 D-0.25 D-0.5 D-0.75 D-1
0.31 0.57 0.98 0.82 9.77E-06
4 3 1 2 5
Table 5: TOPSIS calculations for the foam-filled circular tapered structures, a) decision making matrix, b) normalized decision making matrix, c) ranking results
Loading
angle Criteria C-0 C-0.25 C-0.5 C-0.75 C-1
Ɵ=0◦ SEA 15.79 17.1 18.69 18.26 15.93
Fmax 44.12 50.12 56.34 53.57 36.21
CFE 0.85 0.86 0.87 0.84 0.7
Ɵ=10◦ SEA 12.84 14.05 16.51 16.05 12.12
Fmax 38.82 44.66 50.33 49.01 29.77
CFE 0.79 0.8 0.86 0.81 0.65
Ɵ=20◦ SEA 8.24 9.207 11.58 11.1 8.66
Fmax 31.77 36.86 43.82 41.13 24.72
CFE 0.62 0.63 0.69 0.66 0.56
Ɵ=30◦ SEA 5.08 7.05 8.63 8.03 6.09
Fmax 29.54 31.82 38.02 35.92 20.12
CFE 0.41 0.55 0.59 0.56 0.48
(a) Loading
angle Criteria C-0 C-0.25 C-0.5 C-0.75 C-1
Ɵ=0◦ SEA 0.41 0.44 0.48 0.47 0.41
Fmax 0.4 0.46 0.51 0.49 0.33
CFE 0.45 0.46 0.47 0.45 0.37
Ɵ=10◦ SEA 0.39 0.43 0.51 0.49 0.37
Fmax 0.4 0.46 0.52 0.5 0.3
CFE 0.44 0.45 0.48 0.46 0.37
Ɵ=20◦ SEA 0.37 0.41 0.52 0.5 0.39
Fmax 0.39 0.45 0.53 0.5 0.3
CFE 0.43 0.44 0.48 0.46 0.39
Ɵ=30◦ SEA 0.32 0.44 0.54 0.5 0.38
Fmax 0.41 0.44 0.53 0.5 0.28
CFE 0.35 0.47 0.5 0.47 0.41
(b)
C-0 C-0.25 C-0.5 C-0.75 C-1
0.31 0.55 0.99 0.83 5.44E-06
4 3 1 2 5
Table 6: TOPSIS calculations for the foam-filled tapered structures with the ratio of a/b=0.5, a) decision making matrix, b) normalized decision making matrix, c) ranking results
Loading
angle Criteria S-0.5 H-0.5 O-0.5 D-0.5 C-0.5
Ɵ=0◦ SEA 14.23 14.5 16.34 22.23 18.69
Fmax 42.56 46.11 51.72 60.09 56.34
CFE 0.85 0.81 0.83 0.97 0.87
Ɵ=10◦ SEA 11.43 12.29 13.84 19.21 16.51
Fmax 36.62 40.51 45.21 55.31 50.33
CFE 0.79 0.78 0.8 0.91 0.86
Ɵ=20◦ SEA 6.54 6.84 9.43 14.27 11.58
Fmax 29.03 34.43 38.71 48.73 43.82
CFE 0.57 0.51 0.64 0.77 0.69
Ɵ=30◦ SEA 4.36 4.79 6.74 11.31 8.63
Fmax 24.15 28.73 34.79 42.25 38.02
CFE 0.46 0.43 0.51 0.71 0.59
(a) Loading
angle Criteria S-0.5 H-0.5 O-0.5 D-0.5 C-0.5
Ɵ=0◦ SEA 0.36 0.37 0.41 0.56 0.47
Fmax 0.36 0.39 0.44 0.51 0.48
CFE 0.43 0.41 0.42 0.49 0.44
Ɵ=10◦ SEA 0.34 0.36 0.41 0.57 0.49
Fmax 0.35 0.39 0.43 0.53 0.48
CFE 0.42 0.42 0.43 0.49 0.46
Ɵ=20◦ SEA 0.28 0.3 0.41 0.62 0.5
Fmax 0.32 0.38 0.43 0.55 0.49
CFE 0.39 0.35 0.44 0.53 0.48
Ɵ=30◦ SEA 0.25 0.28 0.39 0.66 0.5
Fmax 0.31 0.37 0.45 0.55 0.49
CFE 0.37 0.35 0.41 0.57 0.48
(b)
S-0.5 H-0.5 O-0.5 D-0.5 C-0.5
2.19E-06 0.1 0.27 0.99 0.47
5 4 3 1 2
(c)
7 CONCLUSIONS
This paper explored the crashworthiness responses of several new designed foam-filled tapered thin-walled structures with different ratios of a/b under axial and oblique impact load conditions. The crashworthiness criteria of specific energy absorption (SEA), peak collapse force (Fmax) and CFE (crash force efficiency) were taken into account to compare these structures. The following important notes can be presented as outcomes of this research study:
• Generally, all the foam-filled tapered structures showed progressive and concertina deformation pattern under axial impact. When they were loaded under the oblique impact of θ=10°, all the structures showed mixed mode of progressive diamond and global bending. For the larger oblique impacts of θ=20° and θ=30°, all the structures were collapsed in the less effective global bending mode. • As the ratio of a/b increased, values of the SEA and CFE increased to reach their maximum value at the ratio of a/b=0.5, and then decreased
• By increasing the ratio of a/b, value of the Fmax increased to reach its peak value at the ratio of a/b=0.5, and then reduced. In addition, by
increasing the impact angle, value of the Fmax decreased.
• According to the TOPSIS results, the foam-filled tapered structures with the ratio of a/b=0.5 demonstrated more suitable energy absorbing devices than those with other ratios of a/b for the structures with any cross sectional shape. This result signifies that the semi-foam filled structures (i.e. S-0.5, H-0.5, O-0.5, D-0.5 and C-0.5) offered greater crashworthiness performance. It is noticed that by using these structures, we can save in foam consumption as well as weight of the structures can be significantly reduced.
• From the TOPSIS calculations, the decagonal foam-filled tapered structure was finally found as the best design of cross sectional shape in terms of crashworthiness performance. Therefore, this foam-filled tapered structure can be an outstanding potential profile for the automobile structural components.
ACKNOWLEDGMENTS
This research project has been financially supported by the Office of Vice Chancellor for Research under a research grant of Project No.: 1365-96/7/22 from University of Mohaghegh Ardabili. This support is gratefully acknowledged.
REFERENCES
Abramowicz, W. Wierzbicki, T., (1988). Axial crushing of foam-filled columns, International Journal of Mechanical Sciences 30(3-4) 263-271.
Ahmad, Z. Thambiratnam, D.P., (2009a). Application of foam-filled conical tubes in enhancing the crashworthiness performance of vehicle protective structures, International journal of crashworthiness 14(4) 349-363.
Ahmad, Z. Thambiratnam, D., (2009b). Crushing response of foam-filled conical tubes under quasi-static axial loading, Materials & design 30(7) 2393-2403
Ahmad, Z. Thambiratnam, D. Tan, A., (2010). Dynamic energy absorption characteristics of foam-filled conical tubes under oblique impact loading, International Journal of Impact Engineering 37(5) 475-488.
Aktay, L. Toksoy, A.K. Güden, M., (2006). Quasi-static axial crushing of extruded polystyrene foam-filled thin-walled aluminum tubes: experimental and numerical analysis, Materials & design 27(7) 556-565.
Azarakhsh, S. Rahi, A. Ghamarian, A. Motamedi, H., (2015) Axial crushing analysis of empty and foam-filled brass bitubular cylinder tubes, Thin-Walled Structures 95 60–72.
Esmaeili-Marzdashti, S. Sebaey, T.A., Pirmohammad, S., Esmaeili-Marzdashti, S., (2017). Crash Analysis And Design of Multi-Cell Octagonal S-Shape Members Under Axial And Oblique Impacts.
Fang, J. Gao, Y., An, X., Sun, G., Chen, J., Li, Q., (2016). Design of transversely-graded foam and wall thickness structures for crashworthiness criteria, Composites Part B: Engineering 92 338-349.
Fang, J. Gao, Y., Sun, G., Zhang, Y., Li, Q., (2014). Crashworthiness design of foam-filled bitubal structures with uncertainty, International Journal of Non-Linear Mechanics 67 120-132.
Ghamarian, A. Zarei, H., Farsi, M., Ariaeifar, N., (2013). Experimental and Numerical Crashworthiness Investigation of the Empty and Foam‐Filled Conical Tube with Shallow Spherical Caps, Strain 49(3) 199-211.
Ghamarian, A. Zarei, H.R. Abadi, M.T., (2011). Experimental and numerical crashworthiness investigation of empty and foam-filled end-capped conical tubes, Thin-Walled Structures 49(10) 1312-1319.
Hosseini-Tehrani, P. Pirmohammad, S. Golmohammadi, M., (2008). Study on the collapse of tapered tubes subjected to oblique loads, Proceedings of the Institution of Mechanical Engineers, Part D: Journal of Automobile Engineering 222(11) 2025-2039.
Hosseini-Tehrani, P., Pirmohammad, S., (2010). Study on Crashworthiness Characteristics of Several Concentric Thin Wall Tubes, ASME 2010 10th Biennial Conference on Engineering Systems Design and Analysis, American Society of Mechanical Engineers, pp. 1-8.
<jrn>Hosseini-Tehrani, P., Pirmohammad, S., (2011). Collapse Study of a Pair Thin-Walled Prismatic Column Subjected to Oblique Loads, Int. J. Auto. Eng1 267-279.</jrn>
Hou, S. Li, Q., Long, S., Yang, X., Li, W., (2007). Design optimization of regular hexagonal thin-walled columns with crashworthiness criteria, Finite Elements in Analysis and Design 43(6) (2007) 555-565.
Hou, S. Han, X., Sun, G., Long, S., Li, W., Yang, X., Li, Q., (2011). Multiobjective optimization for tapered circular tubes, Thin-Walled Structures 49(7) 855-863.
Kavi, H. Toksoy, A.K. Guden, M., (2006). Predicting energy absorption in a foam-filled thin-walled aluminum tube based on experimentally determined strengthening coefficient, Materials & design 27(4) 263-269.
Liu, Y. Day, M.L., (2008). Bending collapse of thin-walled circular tubes and computational application, Thin-Walled Structures 46(4) 442-450
Mamalis, A. Manolakos, D., Ioannidis, M., Spentzas, K., Koutroubakis, S., (2008). Static axial collapse of foam-filled steel thin-walled rectangular tubes: experimental and numerical simulation, International Journal of Crashworthiness 13(2) 117-126.
Meguid, S. Attia, M. Monfort, A., (2004). On the crush behaviour of ultralight foam-filled structures, Materials & design 25(3) 183-189.
Nagel, G. Thambiratnam, D., (2005). Computer simulation and energy absorption of tapered thin-walled rectangular tubes, Thin-walled structures 43(8) 1225-1242.
Nagel, G.M. Thambiratnam, D.P., (2006). Dynamic simulation and energy absorption of tapered thin-walled tubes under oblique impact loading, International Journal of Impact Engineering 32(10) 1595-1620.
Niknejad, A. Liaghat,G., Naeini, H.M., Behravesh, A., (2011). Theoretical and experimental studies of the instantaneous folding force of the polyurethane foam-filled square honeycombs, Materials & Design 32(1) 69-75.
Pirmohammad, S. Nikkhah, H., (2017). Crashworthiness investigation of bitubal columns reinforced with several inside ribs under axial and oblique impact loads, Proceedings of the Institution of Mechanical Engineers, Part D: Journal of Automobile Engineering 0954407017702986
Qi, C. Yang, S. Dong, F., (2012). Crushing analysis and multiobjective crashworthiness optimization of tapered square tubes under oblique impact loading, Thin-Walled Structures 59 (2012) 103-119.
Reddy, T. Wall, R., (1988). Axial compression of foam-filled thin-walled circular tubes, International Journal of Impact Engineering 7(2) 151-166.
Reid, S. Reddy, T. Gray, M., (1986). Static and dynamic axial crushing of foam-filled sheet metal tubes, International Journal of Mechanical Sciences 28(5) 295-322.
Rezvani, M.J. Jahan, A., (2015). Effect of initiator, design, and material on crashworthiness performance of thin-walled cylindrical tubes: A primary multi-criteria analysis in lightweight design, Thin-Walled Structures 96 169-182.
Santosa, S. Banhart, J. Wierzbicki, T., (2001). Experimental and numerical analyses of bending of foam-filled sections, Acta Mechanica 148(1) 199-213.
Seitzberger, M. Rammerstorfer, F.G., Degischer, H.P., Gradinger, R., (1997). Crushing of axially compressed steel tubes filled with aluminium foam, Acta Mechanica 125(1) 93-105.
Song, X. Sun, G., Li, G., Gao, W., Li, Q., (2013). Crashworthiness optimization of foam-filled tapered thin-walled structure using multiple surrogate models, Structural and Multidisciplinary Optimization 47(2) 221-231.
Tran, T. Hou, S., Han, X., Nguyen, N., Chau, M., (2014). Theoretical prediction and crashworthiness optimization of multi-cell square tubes under oblique impact loading, International Journal of Mechanical Sciences 89 177-193.
Wang, Q. Fan, Z. Gui, L., (2007). Theoretical analysis for axial crushing behaviour of aluminium foam-filled hat sections, International Journal of Mechanical Sciences 49(4) 515-521.
Yan, L. Chouw, N. Jayaraman, N., (2014) Effect of triggering and polyurethane foam-filler on axial crushing of natural flax/epoxy composite tubes, Materials and Design 56 528–541.
Yuen, S.C.K. Nurick, G. Starke, R., (2008). The energy absorption characteristics of double-cell tubular profiles, Latin American Journal of Solids and Structures 5(4) 289-317.
Zhang, Y. Sun, G., Li, G., Luo, Z., Q. Li, Q., (2012). Optimization of foam-filled bitubal structures for crashworthiness criteria, Materials & Design 38 99-109.
Zheng, G. Wu, S., Sun, G., Li, G., Li, Q., (2014). Crushing analysis of foam-filled single and bitubal polygonal thin-walled tubes, International Journal of Mechanical Sciences 87 226-240.