Service quality evaluation in the tourist apartments
industry: A segmented and weighted
importance-satisfaction analysis
JUAN CARLOS MARTÍN * [ [email protected] ] CIRA MENDOZA ** [ [email protected] ] CONCEPCIÓN ROMÁN *** [ [email protected] ]
Abstract | Hospitality industry is highly competitive and meeting customer needs and expectations is essential today
for consumer loyalty and business sustainability. This paper aims to develop an analytical framework to assist a sample of four complexes of tourist apartments in identifying and setting improvement priorities on their direct quality-based strategies. A synthetic service quality indicator adjusted by resources (SQIabr) through a weighted importance-satisfaction
matrix has been created in order to analyze and rank the performance of each establishment. Data were obtained from 164 customer reviews for 47 service quality attributes and from two different segments: repeat and first-time tourists. Through segmentation, this study allows managers to identify differences between both user groups and implement more accurate planning and decision making strategies to enhance the quality of their services and, consequently, to improve their long-term success.
Keywords | Importance-satisfaction analysis, Segmentation, Customer satisfaction, Tourist apartments industry, Synthetic
service quality indicator.
Resumo | O setor da hotelaria é altamente competitivo e atender às necessidades e expectativas dos clientes é hoje
essencial para a lealdade do consumidor e sustentabilidade do negócio. Este trabalho tem como objetivo desenvolver um quadro analítico para auxiliar uma amostra de quatro complexos de apartamentos turísticos na identificação e definição de prioridades de melhoria nas suas estratégias diretas, com base na qualidade. A fim de analisar e classificar o desempenho de cada estabelecimento foi criado um indicador sintético de qualidade de serviço ajustado por recursos (SQIabr), através de uma matriz de importância-satisfação ponderada. Os dados foram obtidos a partir de 164 comentários
de clientes para 47 atributos de qualidade de serviço e dois segmentos diferentes: repetição e turistas de primeira viagem. Através da segmentação, este estudo permite aos gestores identificar as diferenças entre os dois grupos de utilizadores e implementar estratégias de tomada de decisão e de planeamento mais precisas para melhorar a qualidade dos seus serviços e, consequentemente, potenciar o seu sucesso a longo prazo.
Palavras-chave | Análise de importância-satisfação, Segmentação, Satisfação do cliente, Apartamentos turísticos, Indicador
sintético de qualidade de serviço.
* PhD in Economics from the University of Las Palmas de Gran Canaria. Full Professor at the University of Las Palmas de Gran Canaria, Spain. ** Junior Researcher and PhD Candidate at the University of Las Palmas de Gran Canaria. MSc in Tourism Management and Planning from the University of Las Palmas de Gran Canaria, Spain.
1. Introduction
Service quality has become a crucial part of tourism literature. The principal concern of hospitality managers is attracting tourists to their businesses. But in a competitive market, consumers are more exigent with their choices and their service expectations are higher. According to O’Neill (2001), today tourists intend to find services that meet their own personal needs. In this sense, it is increasingly difficult for hospitality managers to cater customers’ needs and expectations and they have become aware of how crucial service quality is for the success of any organization. By delivering higher levels of service quality, managers can stand out their services and products among the competition.
Hung, Huan and Chen (2003, p. 79) define service quality as “the degree to which an event or experience meets individual’s needs or expectations”. From the quality of the service experience and the product in comparison to previously held expectations, according to Garbarino and Johnson (1999), the customer satisfaction is derived. Definitions of customer satisfaction state that this term is the consequence of customers’ comparison about their perception of how one service has been performed and their expectations about it (Lewis & Bloom, 1983; Lehtinen & Lehtinen, 1982; Grönroos, 1984; Parasuraman, Zeithaml & Berry, 1985). The level of customer satisfaction on important service aspects is what determines the service quality levels of an organization (Hung et al., 2003).
Perceptions of tourists on quality and overall performance play a significant role in determining repeat visits and positive word-of-mouth recommendations (Akta, Aksu & Cizel, 2007). If people are satisfied with the accommodation they stayed at, they may be more likely to return and to tell others favourable references. Repeat tourists have generally been considered as desirable in marketing and tourism studies (Opperman, 2000). The costs needed to attract this group are lower than those required to attract first-time tourists. Besides,
the fact that customers come back constitutes a positive indicator of satisfaction (Oppermann, 1998). Therefore, tourists’ satisfaction or dissatisfaction with previous experiences is crucial to customers’ retention as intentions for the next purchase may be affected (Woodruff, Cadotte, & Jenkins, 1983). In fact, Johnson, Nader & Fornell (1996) demonstrated that customer satisfaction is related to customer loyalty, which, in turn, is related to profitability. To retain customers, managers should identify the critical factors that determine customer satisfaction and loyalty. Repeat tourists and first-time tourists constitute both two different market segments. Previous literature has analysed these two different segments from various perspectives such as loyalty, profitability and sustainability (Shanka & Taylor, 2004; Anwar & Sohail, 2004; Hughes & Morrison-Saunders, 2002; Kemperman, Joh & Timmermans, 2003; Fallon & Schofield, 2004). The investigation of the relative importance of each service component to the overall impression for both segments and how the business performs in relation to those components is essential to meet their expectations and to obtain better quality results.
Each firm is constrained by limitations on its available resources. In this sense, it is not a valid strategy to allocate a lot of resources for those less valued attributes as they will fulfil in excess the needs and expectations of their clients in some unimportant areas (overkilled areas). Thus, managers need specific tools to determine areas where they need to revise resource allocation. Importance-satisfaction analysis is a simple, effective and recognized technique to assist managers in setting strategic priorities for the management of service quality (Matzler, Sauerwein & Heischmidt, 2002). This method was first introduced by Martilla and James (1977). Importance and satisfaction are analysed for quality attributes and combined into a matrix that allow an organization to identify improvement priorities and direct quality-based marketing strategies. The extension of the analysis into the tourist apartments industry provides opportunities
for individual firms to evaluate its performance by identifying primary drivers of customer satisfaction, setting improvement priorities, identifying possible overkills and areas of “acceptable” disadvantage (Maztler, Bailon, Hinterhuber, Renzl & Pichler, 2004). The present study aims to develop an analytical framework to analyze service quality performance in a segmented sample of four complexes of tourist apartments located in the south of Gran Canaria Island. A synthetic service quality indicator adjusted by resources (SQIabr), obtained using a weighted importance-satisfaction matrix analysis, is proposed in order to make comparisons among the organizations. The sample has been segmented in repeat and first-time tourists, in order to better understand whether these two segments present a different pattern of global satisfaction which allows managers of the organizations obtaining more effective and accurate marketing strategies.
The rest of the paper is organized as follows. Next section details the importance-satisfaction analysis and the methodology employed to build the synthetic service quality indicators. The results obtained are analyzed and commented in section three, and finally, section four concludes with some managerial implications.
2. Methodology
2.1. Weighted importance-satisfaction matrix Since its genesis in the work by Martilla and James (1977), importance-performance analysis (IPA) has become a commonly used tool to the measurement of customer satisfaction and, consequently, the evaluation of an organization’s performance in the market. Hospitality managers are often faced with time constraints and limited budgets. In this sense, IPA is an inexpensive to implement and broadly applicable performance
evaluation tool. By determining the strong and weak aspects, IPA allows for a simple and functional identification of improvement opportunities and a guidance of strategic planning efforts (Den, 2007; Rial, Rial, Varela & Real, 2008). Importance-satisfaction analysis is constituted as an analogue approach to IPA. In the present work we have applied a novel segmented importance-satisfaction analysis through the construction and interpretation of a weighted importance-satisfaction matrix. Our importance-satisfaction matrix differs from traditional IPA in which regions in the matrix are separated by percentiles. Crosshairs in traditional IPA analysis are established in the mean value of data or in the mean value of the scale. Moreover, we build a synthetic service quality indicator to rank the customer service performance of the four complexes of tourist apartments in the sample.
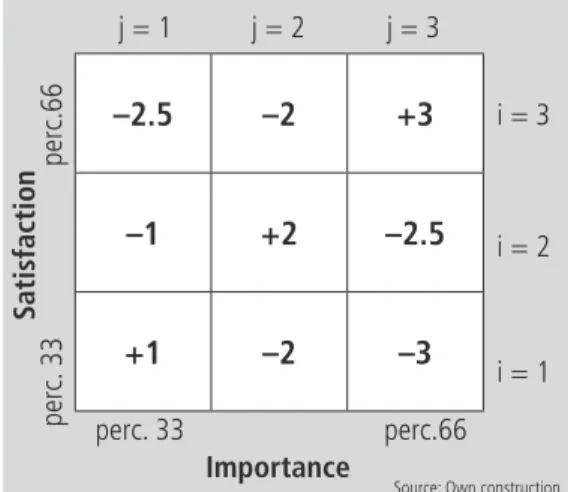
Importance and satisfaction variables are measured using the same set of attributes, so as they can be directly compared within the same attributes via the importance-satisfaction matrix. The combination of importance and satisfaction variables is represented in a two-dimensional chart. Importance is measured on a horizontal axis and satisfaction is depicted along the vertical axis. Mean values of importance and satisfaction were calculated for each service attribute. Service attributes were then sorted into three percentiles. The combination of the percentiles for importance and satisfaction in the grid results in a nine-quadrant matrix, where each quadrant represents different service quality performance zones. Traditional IPA matrix is divided into four quadrants. Notation Zij (i, j=1, 2, 3) is used to simplify the illustration, representing the different service status zones. Figure 1 shows the importance-satisfaction matrix.
Each area in the matrix indicates different service quality strategies. Interpretations follow the combination of importance and satisfaction percentiles of each attribute. The top-right zone (Z33) reflects customers who are significantly satisfied and feel the service attribute as significantly important.
The middle zone (Z22) reflects clients who are moderately satisfied and consider the service attribute as moderately important. The bottom-left zone (Z11) reflects customers who present a low level of satisfaction and consider the service attribute as unimportant in the overall quality. Organizations should maintain service quality performance in these three shaded target zones (Z11, Z22, Z33). They should provide levels of customer service according to the importance clients give to each of the service attributes. When a complex of apartments presents all its service attributes in the target zones, it means that there is no need to implement any additional strategy that requires a change in the managerial procedures. Service attributes located in cells outside the target zones indicate that the firm should focus on them to enhance customer satisfaction. Service attributes located in cells in which the percentile of satisfaction is greater than the percentile of importance suggests that the complex has over satisfied clients regarding some dimensions: satisfaction exceeds service importance. Possible overkills are being produced and the organization may be wasting resources. Attributes on these zones are candidates for possible cost-cutting strategies. These areas requiring possible cost reduction strategies are zones Z31, Z32 and Z21. By moving to the correspondent target zones in the direction
showed by down arrows in figure 1, the organization can reduce the waste of resources. On the contrary, companies should change part of the resources and efforts to increase the satisfaction levels in the zones Z12, Z13 and Z23. Attributes on these areas exhibit under-satisfied customers: importance exceeds satisfaction.Services improvement efforts should focus on these attributes to increase the satisfaction level and move in the direction showed by up arrows in figure 1 to reach the corresponding target zones.
Managerial actions to develop successful marketing programs can be determined basing on this analysis. Attributes that are rated high in importance and high in satisfaction (zone Z33) constitute the major strength and should be maintained and heavily promoted (Lambert & Sharma, 1990). Investing scarce resources on these attributes suggests great strategic advances. Attributes having a low importance rating and a low satisfaction rating (zone Z11) suggest that investing scarce resources on these attributes may have little strategic advance. Attributes that are rated high in importance and low in satisfaction (zone Z13) are those attributes that an organization should pay particular attention to, investing greatest amount of resources to improve the performance of these attributes. Zone Z13 requires top priority and should be targeted for immediate improvement efforts.
– – – – – +++ – ++ – – – + – – – – – – Satisfaction Importance j = 1 j = 2 j = 3 perc. 33 perc. 33 perc.66 perc.66 i = 3 i = 2 i = 1
Figure 1 | Importance-satisfaction matrix.
Source: Own construction.
–2.5 –2 +3 –1 +2 –2.5 +1 –2 –3 Satisfaction Importance j = 1 j = 2 j = 3 perc. 33 perc. 33 perc.66 perc.66 i = 3 i = 2 i = 1
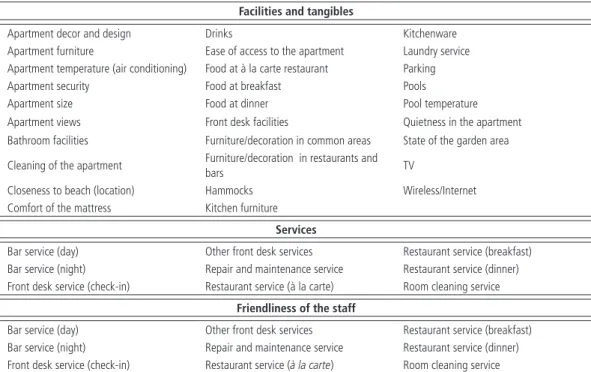
Figure 2 | Weights used to evaluate service quality
performance.
As mentioned above, each quadrant matrix represents different service quality strategies, so that different degrees of priority for action are required. The degree of priority for action is represented by the quantity of minus signs in figure 1. The more minus signs are, the more immediate and higher priority improvement actions should be implemented to enhance service quality performance. The priorities for improvements are as follows: first, Z13; then Z31 and Z23; followed by Z12 and Z32; and Z21 is the last. Plus signs in figure 1 indicate the degree of good customer service performance. The more important the service attributes are, the greater the strategic advance will be when investing resources on these attributes. Therefore, weights in target zones have different values. In this sense, zone Z33 has greater weight than zone Z22, and this one presents greater weight than zone Z11. Based on this reasoning, ad-hoc subjective1 weights for each zone in the matrix
need to be proposed as a way to represent the different levels of improvement priority and good performance in order to consistently evaluate service quality performance. Figure 2 shows the weights used to evaluate service quality performance.
2.2. Synthetic service quality indicator adjusted by resources (SQIabr)
From the weighted matrix, the present study develops a synthetic service quality indicator adjusted by resources (SQIabr) to measure service provider’s performance and rank the complexes of tourist apartments analyzed. This indicator facilitates global interpretations by condensing the measurement of several sub indicators into one value. SQIabr is obtained through repeat and non-repeat tourists’ segmentation for each of the three dimensions (tangibles, services and friendliness of the staff), for
each complex and globally. It is worth noting that, as Tarrant and Smith (2002) pointed out, the quadrant approach has the drawback that it cannot distinguish between attributes located in different points in the same region. Some attributes can overlap either of the axes or be too close to the intersection point of the quadrants so a compromise solution regarding the position of this attribute has to be envisaged.
Therefore, 32 service quality indexes are calculated. SQIabr by dimension is calculated according to Eq. (1), in which r, 1≤ r ≤ 3 , denotes the service
quality dimension and k denotes the apartment
complex. This indicator depends on the weight matrix wij and on the number of service quality
attributes located in each row i and column j in the
importance-satisfaction matrix. The denominator, expressed by Eq. (2), represents the total number of attributes that exist in the importance-satisfaction matrix for dimension r and organization k.
Global SQIabr is formulated by Eq. (3), in which Nk, calculated by Eq. (4), represents the number of total service quality attributes for firm k.
SQIabr constitutes an index for performance improvement. It reflects the extent to which there is a mismatch between what customers claim and the quality of what they are offered. The organization obtains the highest level of service quality performance when all customers state that
1 It is out of the scope of the present paper but these weights
should closely represent the profit or objective function of the apartment. Nevertheless, these ad-hoc values could be elicited from qualitative experts’ opinions of apartments’ managers.
all the service attributes were both highly important and very well supplied. On the contrary, the lowest level is obtained when all the service attributes were both highly important and poorly supplied. By the comparison of the SQIabr indicators managers can evaluate their performance by knowing their relative position in the market and guide strategic plans to enhance their service quality results.
2.3. Survey methods
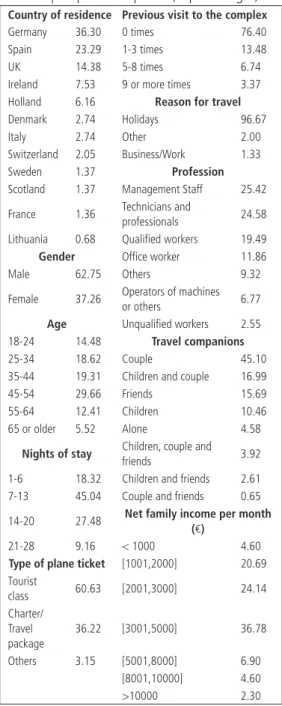
47 service quality attributes have been selected to measure service quality performance. Table 1 presents the service quality attributes: 29 of them are tangibles, nine are related to the services offered, and nine regarding the friendliness of the staff of each service. Each attribute included in the study was deeply discussed and studied on a focus group meeting with the managers of the sample organizations. One organization did not offer restaurant service, so the attributes related to it were not considered.
One has interviewed international and domestic tourists over 18 lodged in one of the four tourist complex of apartments during the months of July and August, 2012. A total of 164 valid questionnaires were obtained. A self-completion questionnaire was distributed by each organization receptionist at the end of the stay, who informed them about the purpose of the survey before filling the questionnaire.
The questionnaire was structured into four different sections. The first section measured aspects of overall quality. In the second section, tourist’s socio-demographic and holiday-related data were obtained. The third and fourth sections constitute the main ones for our study. The third section, composed of 29 questions, was designed to determine tourist satisfaction and the degree of importance with facilities and tangibles of the establishments. Through nine-point Likert scales, the satisfaction level (ranging from ‘not satisfied’ to ‘very satisfied’) and the importance (ranging from ‘not very important’ to ‘very important’) were measured. A five-point Likert scale also measured the degree of agreement/disagreement
Table 1 | Service quality attributes.
Facilities and tangibles
Apartment decor and design Drinks Kitchenware
Apartment furniture Ease of access to the apartment Laundry service Apartment temperature (air conditioning) Food at à la carte restaurant Parking
Apartment security Food at breakfast Pools
Apartment size Food at dinner Pool temperature
Apartment views Front desk facilities Quietness in the apartment Bathroom facilities Furniture/decoration in common areas State of the garden area Cleaning of the apartment Furniture/decoration in restaurants and
bars TV
Closeness to beach (location) Hammocks Wireless/Internet Comfort of the mattress Kitchen furniture
Services
Bar service (day) Other front desk services Restaurant service (breakfast) Bar service (night) Repair and maintenance service Restaurant service (dinner) Front desk service (check-in) Restaurant service (à la carte) Room cleaning service
Friendliness of the staff
Bar service (day) Other front desk services Restaurant service (breakfast) Bar service (night) Repair and maintenance service Restaurant service (dinner) Front desk service (check-in) Restaurant service (à la carte) Room cleaning service Source: Own construction.
regarding the degree of how customers’ expectations were or not fulfilled for each of the 29 tangibles. It ranged from ‘much worse than expected’ to ‘much better than expected’. Finally, the last section analyzed the same items than tangibles did for services and friendliness of staff dimensions.
3. Results
3.1. Respondent’s profile
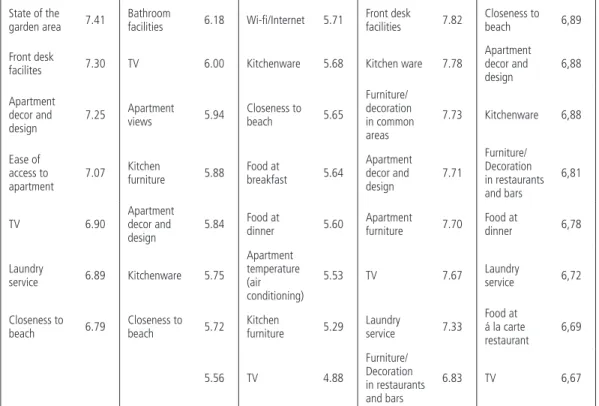
As table 2 shows, German citizens (36.3%) were the most represented nationality lodged in the complexes of tourist apartments studied. Are Germans, after the British, those who most visit Gran Canaria Island in recent years (Instituto Canario de Estadística (ISTAC), 2013). Managers stated that in summer months they receive a higher proportion of Spanish tourists than the other months of the year. This assumption is supported by our sample profile, with 23.29% of Spanish tourists staying at one of the four complexes analyzed. The sample of respondents was differentially divided in terms of gender, with 62.75% males and 37.25% females. Tourists aged between 45 and 54 were the most represented group (29.66%). Regarding the nights of stay, the most represented percentage (45.04%) stayed between seven and 13 nights. 60.63% respondents travelled in tourist class, and 36.22% chose charter/ travel package as plane ticket. Most of respondents (76.40%) had never previously visited the complex they had stayed at. However, 13.48% of tourists had visited it from one to three times, while the remaining percentage (10.11%) had visited more than five times. The great proportion of people who traveled for holidays (96.67%) supports the idea that the south of Gran Canaria Island is an attractive tourist holiday destination. Management staff, technicians and professionals and qualified workers came first in the list as the most frequently interviewed profession
groups. The couple is the most represented travel companion (45.10%). Regarding the net family income per month, the most represented group in the sample presented revenues between €3.001 and €5.000. Net family income per month greater than €10.000 came last in the list (2.30%).
Table 2 | Respondent’s profile (in percentages). Country of residence Previous visit to the complex
Germany 36.30 0 times 76.40
Spain 23.29 1-3 times 13.48
UK 14.38 5-8 times 6.74
Ireland 7.53 9 or more times 3.37 Holland 6.16 Reason for travel
Denmark 2.74 Holidays 96.67
Italy 2.74 Other 2.00
Switzerland 2.05 Business/Work 1.33
Sweden 1.37 Profession
Scotland 1.37 Management Staff 25.42 France 1.36 Technicians and
professionals 24.58 Lithuania 0.68 Qualified workers 19.49 Gender Office worker 11.86
Male 62.75 Others 9.32
Female 37.26 Operators of machines
or others 6.77
Age Unqualified workers 2.55 18-24 14.48 Travel companions
25-34 18.62 Couple 45.10
35-44 19.31 Children and couple 16.99
45-54 29.66 Friends 15.69
55-64 12.41 Children 10.46
65 or older 5.52 Alone 4.58
Nights of stay Children, couple and
friends 3.92
1-6 18.32 Children and friends 2.61 7-13 45.04 Couple and friends 0.65 14-20 27.48 Net family income per month (€)
21-28 9.16 < 1000 4.60
Type of plane ticket [1001,2000] 20.69 Tourist class 60.63 [2001,3000] 24.14 Charter/ Travel package 36.22 [3001,5000] 36.78 Others 3.15 [5001,8000] 6.90 [8001,10000] 4.60 >10000 2.30
3.2. Most and least important attributes
The knowledge of the degree of importance customers place on the individual components of the service experience is crucial to deliver higher levels of service quality as a means for firms to achieve competitive differentiation. Table 3 shows the ten most important attributes, those with the highest mean values, and the ten least important attributes, those with the lowest mean values. Mean scores for all 47 satisfaction attributes of the whole sample (last column in table 3) present an appreciate level of homogeneity, ranging from a value of 8.02 to 6.67. Service attributes regarding the friendliness of staff are considered as very important for respondents. It can be seen that friendliness of staff of different services appears among the ten most important attributes for each organization and for the whole set of apartments considered in the analysis. ‘Reception service’ is another attribute considered as important for respondents in organizations B, C and D and it is among the ten most important service attributes for the whole set. However, for the whole sample, the service attributes: ‘TV’, ‘Laundry service’, ‘Food at à la carte restaurant’, ‘Food at dinner’ and ‘Furniture/ decoration in restaurants and bars’, among others, are the least important for respondents. It is worth noting tourists have segmented themselves when choosing their accommodation. In fact, organization C is the only one with direct sea views in our sample, and this attribute appears at the top of the importance ranking in table 3.
3.3. Segmented service quality performance comparison
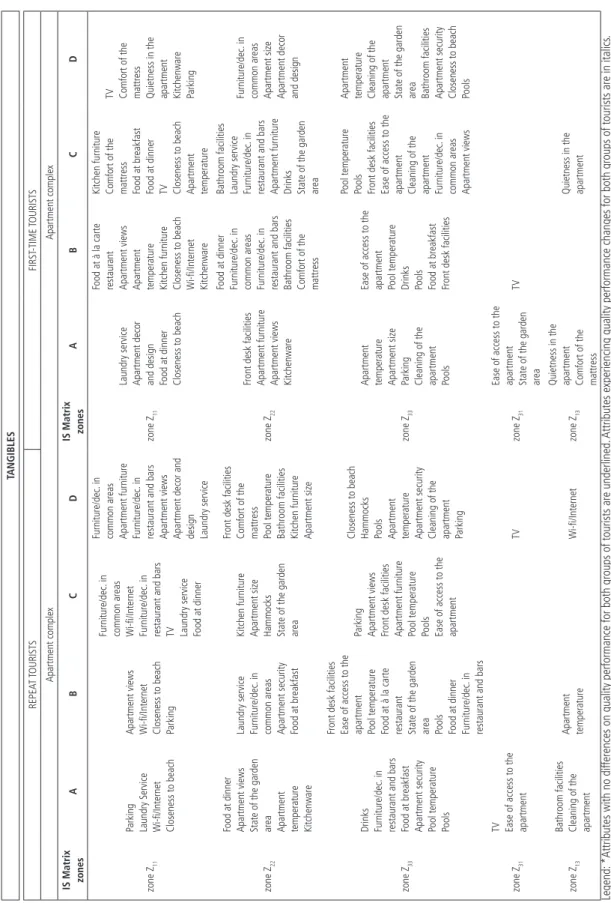
Tables 4, 5 and 6 show the attributes located in cells Z11, Z22, Z33, Z31 and Z13 in the importance-satisfaction matrix for each of the four organizations, according to segmentation criteria. The segmentation is done differentiating repeat tourists from first-time tourists, in order to check whether there are
differences on quality perceptions between both segments. Segmentation helps enhance the utility of the analysis and achieve more useful results by letting managers recognize more accurate improvement opportunities. Tables 4, 5 and 6 enable the identification of those attributes that need to be revised and those with an appropriate performance. Table 4 details the service attributes for the dimension of tangibles. It can be seen that in organizations A and D for repeat tourists and in organization B for first-time tourists, ‘TV’ is one of the attributes in which satisfaction exceeds importance. Managers could have acquired higher quality TVs beyond the own needs of consumers. ‘Ease of access to the apartment’ is another service attribute that appears in zone Z31. Both customer groups in apartment A are very satisfied with this attribute but consider it as unimportant in the overall quality. ‘State of the garden area’ is also well performed by organization A according to first-time tourists, but this attribute is considered as unimportant. Zone Z13 reflects attributes with the highest priority for action. For first-time tourists, these attributes are ‘Quietness in the apartment’ for organizations A and C and ‘Comfort of the mattress’ for organization A. However, a different pattern is observed for repeat tourists. ‘Bathroom facilities’ and ‘Cleaning of the apartment’ are the tangibles that are required for the highest priority improvement in organization A. ‘Apartment temperature’ presents the highest priority for action in organization B, and organization D needs to change its highest priority managerial strategies to ‘Wireless/Internet’. Customers consider these attributes as very important for overall quality, but they are not sufficiently satisfied with their performance. Managers should primarily concentrate on these attributes to enhance service quality by increasing the satisfaction level of customers.
Zones Z11, Z22 and Z33 represent service attributes with good performance. Both segmented groups show marked differences in quality perceptions. ‘Parking’ varies from zone Z11 for repeat tourists to zone Z33 for non-repeat tourists in organization
Table 3 | Most and least important attributes for each organization and globally.*
Organization A Organization B Organization C Organization D Total Service
attribute Mean Service attribute Mean Service attribute Mean attributeService Mean Service attribute Mean Room cleaning service 8.34 Friendliness of staff of reception service (check-in)
7.71 Apartment views 7.72 Ease of access to
apartment 9.44 Friendliness of the staff of the reception service (check-in) 8,02 Cleaning of the apartment 8.31 Friendliness of staff of restaurant service (à la carte) 7.64 Friendliness of staff of reception service (others) 7.57 Friendliness of staff of the maintenance service 8.64 Friendliness of the staff of the reception service (others) 7,97 Friendliness of staff of the bar service (night) 8.29 Reception service (others) 7.61 Front desk facilities 7.42 Friendliness of staff of the reception service (others)
8.56. Ease of access to the apartment 7,96 Restaurant service (breakfast) 8.24 Restaurant service (à la carte) 7.53 Reception service (others) 7.36 Reception service (others) 8.53 Reception service (others) 7,94 Friendliness of staff of the restaurant service (dinner) 8.21 Friendliness of staff of reception service (others) 7.50 Friendliness of staff of reception service (check-in) 7.35 Friendliness of staff of reception service (check-in) 8.53 Friendliness of the staff of the maintenance service 7,90 Swimming pools 8.17 Room cleaning service 7.41 Quietness in the apartment 7.28 Apartment temperature (air conditioning) 8.51 Room cleaning service 7,83 Apartment size 8.17 Friendliness of staff of restaurant service (breakfast) 7.36 Swimming pool temperature 7.28 Swimming
pools 8.44 Swimming pools 7,77 Friendliness of the staff of the reception service (check-in) 8.14 Restaurant service (breakfast) 7.31 Ease of access to the apartment 7.26 Cleaning of the apartment 8.44 Reception service (check-in) 7,70 Friendliness of staff of the restaurant service (breakfast) 8.14 Restaurant service (dinner) 7.26 Swimming
pools 7.26 Apartment security 8.44
Friendliness of staff of the room cleaning service 7,69 Friendliness of staff of the room cleaning service 8.11 Friendliness of staff of restaurant service (dinner) 7.25 Friendliness of staff of Bar service (night)
7.14 Closeness to beach 8.43 Maintenance service 7,65
Kitchenware 7.54 Hammocks 6.23 Comfort of the mattress 5.76 Apartment views 8.00 Kitchen furniture 6,93
Kitchen furniture 7.50 Parking 6.19 Friendliness of staff of restaurant service (breakfast)
A. This variable is more important in the overall quality for first-time tourists than for repeat tourists. However, in organization D the opposite occurs. ‘Parking’ moves from zone Z11 for first-time tourists to zone Z33 for repeat tourists. Repeat tourists consider this variable more important than first-time tourists. It can also be seen that repeat tourists in organization B give a higher degree of importance to attributes related to restaurant aspects (‘Food at à la carte restaurant’, ‘Food at dinner’ and ‘Furniture/ dec. in restaurant and bars’) than first-timers. However, first-time tourists value ‘Furniture/dec. in restaurants and bars’ more than repeat tourists in the complex of apartments C. In addition, repeat customers in organization D consider that ‘Comfort of the mattress’ is more important than first-time tourists. ‘Furniture/dec. in common areas’ and ‘Apartment decor and design’ are other variables that first-time customers give greater importance with respect to repeat tourists.
Differences in attributes in service dimension are illustrated in Table 5. Marked differences are presented between both tourist groups. Only ‘Restaurant (breakfast)’ and ‘Other front desk services’ have remained equal. It can be seen that organization A is performing better on the attribute ‘Restaurant (dinner)’ for repeat tourists. This kind of tourists is over satisfied with this attribute, while first-time tourists are under satisfied. ‘Room cleaning’ presents an adequate performance for first-time tourists lodged in the complex of apartments B. However, according to repeat tourists, this service variable requests a high priority for action. Repeat tourists in organizations C and D give higher importance to ‘Repair and maintenance’, compared to first-time customers.
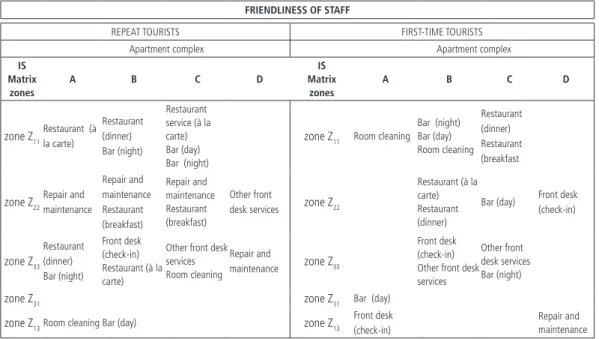
Finally, table 6 specifies the attributes for the dimension of friendliness of staff. Most marked differences are observed on attributes ‘Room cleaning’, ‘Bar (day)’ and ‘Repair and maintenance’. Table 3 | Most and least important attributes for each organization and globally.* (cont.)
State of the
garden area 7.41 Bathroom facilities 6.18 Wi-fi/Internet 5.71 Front desk facilities 7.82 Closeness to beach 6,89 Front desk
facilites 7.30 TV 6.00 Kitchenware 5.68 Kitchen ware 7.78
Apartment decor and design 6,88 Apartment decor and design 7.25 Apartment
views 5.94 Closeness to beach 5.65
Furniture/ decoration in common areas 7.73 Kitchenware 6,88 Ease of access to apartment 7.07 Kitchen
furniture 5.88 Food at breakfast 5.64
Apartment decor and design 7.71 Furniture/ Decoration in restaurants and bars 6,81
TV 6.90 Apartment decor and design 5.84
Food at
dinner 5.60 Apartment furniture 7.70 Food at dinner 6,78 Laundry service 6.89 Kitchenware 5.75 Apartment temperature (air conditioning) 5.53 TV 7.67 Laundry service 6,72 Closeness to
beach 6.79 Closeness to beach 5.72 Kitchen furniture 5.29 Laundry service 7.33
Food at á la carte restaurant 6,69 5.56 TV 4.88 Furniture/ Decoration in restaurants and bars 6.83 TV 6,67
Legend: *It is showed the ten most and least important attributes. The most important attributes are expressed in bold and the least important attributes are represented in italics. Source: Own construction.
Table 4
| Service quality performance comparison between repeat and first-time tourists:
Tangibles dimension.* TANGIBLES REPEA T T OURISTS FIRST -TIME T OURISTS Apartment complex Apartment complex IS Matrix zones A B C D IS Matrix zones A B C D zone Z 11
Parking Laundry Service Wi-fi/Internet Closeness to beach Apartment views Wi-fi/Internet Closeness to beach Parking
Furniture/dec.
in
common areas Wi-fi/Internet Furniture/dec.
in
restaur
ant and bars
TV Laundry service Food at dinner
Furniture/dec.
in
common areas Apartment furniture Furniture/dec.
in
restaur
ant and bars
Apartment views Apartment decor and design Laundry service
zone Z
11
Laundry service Apartment decor and design Food at dinner Closeness to beach Food at à la carte restaur
ant
Apartment views Apartment temper
ature
Kitchen furniture Closeness to beach Wi-fi/Internet Kitchenw
are
Kitchen furniture Comfort of the mattress Food at breakfast Food at dinner TV Closeness to beach Apartment temper
ature
TV Comfort of the mattress Quietness in the apartment Kitchenw
are
Parking
zone Z
22
Food at dinner Apartment views State of the garden area Apartment temper
ature
Kitchenw
are
Laundry service Furniture/dec.
in
common areas Apartment security Food at breakfast Kitchen furniture Apartment size Hammocks State of the garden area Front desk facilities Comfort of the mattress Pool temper
ature
Bathroom facilities Kitchen furniture Apartment size
zone Z
22
Front desk facilities Apartment furniture Apartment views Kitchenw
are
Food at dinner Furniture/dec.
in
common areas Furniture/dec.
in
restaur
ant and bars
Bathroom facilities Comfort of the mattress Bathroom facilities Laundry service Furniture/dec.
in
restaur
ant and bars
Apartment furniture Drinks State of the garden area
Furniture/dec.
in
common areas Apartment size Apartment decor and design
zone Z
33
Drinks Furniture/dec.
in
restaur
ant and bars
Food at breakfast Apartment security Pool temper
ature
Pools
Front desk facilities Ease of access to the apartment Pool temper
ature
Food at à la carte restaur
ant
State of the garden area Pools Food at dinner Furniture/dec.
in
restaur
ant and bars
Parking Apartment views Front desk facilities Apartment furniture Pool temper
ature
Pools Ease of access to the apartment Closeness to beach Hammocks Pools Apartment temper
ature
Apartment security Cleaning of the apartment Parking
zone Z
33
Apartment temper
ature
Apartment size Parking Cleaning of the apartment Pools Ease of access to the apartment Pool temper
ature
Drinks Pools Food at breakfast Front desk facilities
Pool temper
ature
Pools Front desk facilities Ease of access to the apartment Cleaning of the apartment Furniture/dec.
in
common areas Apartment views Apartment temper
ature
Cleaning of the apartment State of the garden area Bathroom facilities Apartment security Closeness to beach Pools
zone Z
31
TV Ease of access to the apartment
TV
zone Z
31
Ease of access to the apartment State of the garden area
TV
zone Z
13
Bathroom facilities Cleaning of the apartment Apartment temper
ature
Wi-fi/Internet
zone Z
13
Quietness in the apartment Comfort of the mattress Quietness in the apartment
Legend:
*Attributes with no differences on quality performance for both groups of tourists are underlined.
Attributes experiencing quality performance changes for both groups of tourists are in italics
.
Source:
Own construction.
‘Room cleaning’ and ‘Bar (day)’ are the attributes that organizations A and B, respectively, should primarily focus their efforts on to increase the level of satisfaction. Customers are under satisfied with the friendliness of the staff of these services. Nevertheless, both attributes are considered to have well performance according to first-time tourists. ‘Repair and maintenance’ for repeat tourists in organization D is another service attribute with a good performance (zone 33), but it is underperformed (zone Z13) for first-time tourists.
3.4. SQIabr results
Table 7 presents SQIs final values by dimension and globally for each organization. The results present differences in SQIabr final values between both segments. Regarding the dimension of tangibles and facilities, it can be seen that repeat tourists have greater quality perceptions in organization D (1.04), while organization C presents the best results in service quality performance by first-time tourists (0.75). Organization C is also the first positioned by repeat tourists in both service and friendliness of staff dimensions (0.94 and 0.94, respectively). However, first-time tourists consider organization B as that with the best quality performance in also both of service and friendliness of staff dimensions (1.33 and 0.94, respectively). According to both groups, firm A presents the worst results in all three dimensions.
Regarding Global SQIabr results, organization D is the one with the highest score for repeat tourists, but for first-time tourists this firm is the third positioned. Organization D is the first in the ranking for repeat tourists (see table 8). Complex of apartments B has achieved the highest score in global SQIabr for first-time tourists. Firm B is the one with the best service quality performance for first-time tourists (see table 8). Organization A comes up with the lowest values for both groups of tourists (-0.03 and -0.69). This firm is positioned as the last in the service quality performance ranking, being the one with the worst
scores in all three dimensions and globally for both groups of tourists. Organization A should take actions to enhance customer service by adapting its resources and efforts to achieve the appropriate customer satisfaction level according to the degree of importance.
As mentioned above, organization D is the first positioned in the ranking by repeat tourists. For first-time tourists ranking is organization B the first positioned. Firm A presents the lowest scores, being the last positioned for both user groups. It can be seen that organization C remains equal for both segmented groups.
4. Concluding remarks
The purpose of this paper was to develop a framework to empirically evaluate customer service in the tourist apartments industry in the south of Gran Canaria Island. A synthetic service quality indicator adjusted by resources (SQIabr) from a weighted importance-satisfaction matrix has been proposed in order to rank and make comparisons among the sample organizations. Service attributes performance relative to competitors must be considered in order to formulate effective strategies. By comparison, managers can know their relative position in the market and take appropriate strategies that enhance their quality performance.
Importance-satisfaction matrix is a relatively inexpensive and easily understood tool. The fact that the results are displayed graphically in a two-dimensional chart enables managers to identify the strengths and weakness of service quality attributes, facilitating the redirection of marketing strategies. This analysis helps managers the understanding of perceptions of their customers in relation to quality attributes. It is of practical use to prioritize their efforts at meeting the needs of their clients.
Tourists’ segmentation on repeat and first-time tourists allows managers the identification of the
Table 5 | Service quality performance comparison between repeat and first-time tourists: Dimension of services.*
SERVICES
REPEAT TOURISTS FIRST-TIME TOURISTS
Apartment complex Apartment complex
IS Matrix zones A B C D IS Matrix zones A B C D zone Z11 Restaurant (à la carte) Bar (day) Repair and maintenance Restaurant (à la carte) Bar (day) Bar (night)
zone Z11 Other front desk services Bar (night) Bar (day) Room cleaning Repair and maintenance Repair and maintenance
zone Z22Repair and maintenance Bar (day)
Repair and maintenance Restaurant (breakfast)
Other front
desk services zone Z22
Restaurant (à la carte) Restaurant (dinner) Room cleaning zone Z33 Restaurant (breakfast) Restaurant (à la carte) Other front desk services
Other front desk services Room cleaning Repair and maintenance zone Z33 Restaurant (breakfast) Front desk (check-in) Other front desk services
Bar (night) Front desk (check-in) zone Z31Restaurant (dinner) zone Z31
zone Z13 Room cleaning zone Z13 Restaurant (dinner) Source: Own construction.
Table 6 | Service quality performance comparison between repeat and first-time tourists: Dimension of friendliness of staff.*
FRIENDLINESS OF STAFF
REPEAT TOURISTS FIRST-TIME TOURISTS
Apartment complex Apartment complex
IS Matrix zones A B C D IS Matrix zones A B C D zone Z11Restaurant (à la carte) Restaurant (dinner) Bar (night) Restaurant service (à la carte) Bar (day) Bar (night)
zone Z11 Room cleaning Bar (night) Bar (day) Room cleaning Restaurant (dinner) Restaurant (breakfast
zone Z22Repair and maintenance
Repair and maintenance Restaurant (breakfast) Repair and maintenance Restaurant (breakfast) Other front
desk services zone Z22
Restaurant (à la carte) Restaurant (dinner)
Bar (day) Front desk
(check-in) zone Z33 Restaurant (dinner) Bar (night) Front desk (check-in) Restaurant (à la carte)
Other front desk services Room cleaning Repair and maintenance zone Z33 Front desk (check-in) Other front desk services
Other front desk services Bar (night)
zone Z31 zone Z31 Bar (day)
zone Z13Room cleaning Bar (day) zone Z13
Front desk (check-in)
Repair and maintenance Source: Own construction.
differences between both groups, disentangling different perceptions that can exist between loyal and non-loyal customers. By knowing the differences in segmented users, managers may implement differentiated strategies for each segment optimizing the level of service of each organization. The segmented analysis has showed that there are marked differences in quality perceptions of both groups. The value of segmentation is more apparent when looking at the cleaning of the apartment and parking and restaurant services in organization A; when looking at restaurant services, cleaning of the apartment and apartment temperature in organization B; and when looking at the parking and repair and maintenance in firm D. Firm C does not present very marked segmentation differences. Managers should consider these differences when planning quality strategies to enhance their performance.
Final synthetic service quality indicators adjusted by resources (SQIabr) ranked organizations D and B as the first positioned for repeat and first-time
tourists, respectively. Firm A was the one with the lowest scores in the final ranking for both segmented groups. This firm should take actions to enhance the quality of the services provided and proportionate the appropriate satisfaction level to their customers according to their needs and expectations.
It would be desirable to design a single model questionnaire in the region for further research and policy implications. By including more holiday apartment complexes, it will be possible to generate segment-specific data to compare results through the largest possible number of establishments. By this, comparisons of regional service quality performance could be made and future policy actions could be carried out to enhance service quality for this specific and important sector.
References
Aktas, A., Akin Aksu A., & Cizel, B. (2007). Destination choice: An important, satisfaction analysis. Quality & Quantity, 41, 265-273.
Anwar, S. A., & Sohail, M. S. (2004). Festival tourism in the United Arab Emirates: First-time versus repeat visitor perceptions. Journal of Vacation Marketing, 10(2), 161–170.
Den, W. (2007). Using a revised importance-performance analysis approach: The case of Taiwanese hot springs tourism. Tourism Management, 28(5), 1274-1284.
Fallon, P., & Schofield, P. (2004). First-time and repeat visitors to Orlando, Florida: A comparative analysis of destination satisfaction. In G. I. Crouch, R. R. Perdue, H. J. P. Timmermans & M. Uysal (Eds.), Consumer psychology of tourism, hospitality and leisure (pp. 203–214). Wallingford, UK: CABI Publishing. Garbarino, E., & Johnson, M. S. (1999). The different roles of satisfaction, trust, and commitment in customer relationships. Journal of Marketing, 63(2), 70–88.
Grönroos, C. (1984), A service quality model and its market implications. European Journal of Marketing, 18(4), 36-44.
Table 7 | Global and by dimension SQIabr values
Repeat tourists First-time tourists
Tourist apartment complex Tourist apartment complex
A B C D A B C D
SQIabr by dimension SQIabr by dimension
Tangibles and facilities 0.10 0.46 0.43 1.04 Tangibles and facilities -0.22 0.39 0.75 0.56
Services -0.5 0 0.94 0.5 Services -1.06 1.33 -0.39 -0.38
Staff friendliness 0 0.67 0.94 0.5 Staff friendliness -1.83 0.94 0.28 -1 Global SQIabr -0.03 0.41 0.63 0.91 Global SQIabr -0.69 0.68 0.47 0.26 Source: Own construction.
Table 8 | Final global SQIabr rankings.
Repeat tourists First-time tourists
Organization Position Global SQI score Organization Position Global SQI score D 1 0.91 B 1 0.68 C 2 0.63 C 2 0.47 B 3 0.41 D 3 0.26 A 4 -0.03 A 4 -0.69
Hughes, M., & Morrison-Saunders, A. (2002), Repeat and first time visitation in an experience specific context: The valley of the giants tree top walk, Journal of Tourism Studies, 13(1), 20-25. Hung, Y. H., Huan, M. L., & Chen, K. S. (2003). Service quality
evaluation by service quality performance matrix. Total Quality Management and Business Excellence, 14(1), 79-89. Instituto Canario de Estadística [ISTAC] (2013). Accessed on 24
October 2013 available at http://www.gobiernodecanarias. org/istac
Johnson, M. D., Nader, G., & C. Fornell (1996). Expectations, perceived performance, and customer satisfaction for a complex service: The case of bank loans. Journal of Economic Psychology, 17(2), 163-182.
Kemperman, A. D. A. M., Joh, C., & Timmermans, H. J. P. (2003). Comparing first-time and repeat visitors’ activity patterns. Tourism Analysis, 8(2), 159–164.
Lambert, D. M., & Sharma, A. (1990), A customer-based competitive analysis for logistics decisions. International Journal of Physical Distribution & Logistics Management, 20(1), 17–24.
Lehtinen, U., & Lehtinen, J. R. (1982). Service quality: A study of dimensions (pp. 439-60). Unpublished working paper. Helsinki: Service Management Instituted.
Lewis, R. C., & Booms, B.H. (1983). The marketing aspects of service quality. In L. L. Berry, G. Shostack & G. Upah (Eds), Emerging perspectives in service marketing (pp. 99-107). Chicago, IL: American Marketing Association.
Martilla, J. A., & James, J.C. (1977). Importance-performance analysis. Journal of Marketing, 41(1), 77-79.
Matzler, K., Sauerwein, E., & Heischmidt, K. A. (2002). Importance-performance analysis revisited: The role of the factor structure of customer satisfaction. Service Industries Journal, 23(2), 112-129.
Maztler, K., Bailon, F., Hinterhuber, H. H., Renzl, B., & Pichler, J. (2004). The asymmetric relationship between attribute-level performance and overall customer satisfaction: a reconsideration of the importance-performance analysis. Industrial Marketing Management, 33, 271-277.
Medina, D. R., Aguiar, J. T., Carreño, J. A., Celis, D. F., Medina, R. D., & Rodríguez, J. N. (2008). La competitividad turística de Gran Canaria: Análisis y recomendaciones. Servicio de Publicaciones de la Universidad de Las Palmas de Gran Canaria, La Caja de Canarias.
O’Neill, M. (2001). Service quality management in hospitality, tourism, and leisure: Measuring service quality and customer satisfaction. New York: The Haworth Hospitality Press. Opperman, M. (1998). Destination threshold potential and the
law of repeat visitation. Journal of Travel Research, 37(2), 131-137.
Opperman, M. (2000). Where psychology and geography interface in tourism research and theory. In A. Woodside, G. Grouch, J. Ma Mazanec, M. Oppermann & M. Sakai (Eds.), Consumer psychology of tourism, hospitality and leisure (pp. 19-38). Cambridge: CABI.
Parasuraman, A., Zeithaml V. A., & Berry, L. L. (1985). A conceptual model of service quality and its implications for future research. Journal of Marketing, 49(3), 41-50.
Rial, A., Rial, J., Varela, J., & Real, E. (2008). An application of importance-performance analysis (IPA) to the management of sport centres. Managing Leisure, 13, 179-188.
Shanka, T., & Taylor, R. (2004). Discriminating factors of first-time and repeat visitors to wine festivals. Current Issues in Tourism, 7(2), 134-145.
Tarrant, A., & Smith, E. K. (2002). The use of modified importance performance framework to examine visitor satisfaction with attributes of outdoor recreation settings. Managing Leisure, 7, 69-82.
Woodruff, R. B., Cadotte, E. R., & Jenkins, R. I. (1983). Modelling consumer satisfaction processes using experience-based norms. Journal of Marketing Research, 20, 296-304.