Assessment of the Hydrological Effect of Drought and Fire
Events on Evapotranspiration at a Regional Scale
Melanie Häusler
SCIENTIFIC ADVISORS: Prof. José Miguel Oliveira Cardoso Pereira
PhD João Manuel das Neves Silva
PhD Thorsten Warneke
THESIS PRESENTED TO OBTAIN THE DOCTOR DEGREE IN
FORESTRY ENGINEERING AND NATURAL RESOURCES
Assessment of the Hydrological Effect of Drought and Fire Events on
Evapotranspiration at a Regional Scale
Melanie Häusler
SCIENTIFIC ADVISORS: Prof. José Miguel Oliveira Cardoso Pereira PhD João Manuel das Neves Silva
PhD Thorsten Warneke
THESIS PRESENTED TO OBTAIN THE DOCTOR DEGREE IN FORESTRY ENGINEERING AND NATURAL RESOURCES JÚRI:
Presidente: Doutora Maria Teresa Marques Ferreira, Professora Catedrática Instituto Superior de Agronomia, Universidade de Lisboa.
Vogais: Doutor Jorge Manuel Martins Soares David, Professor Catedrático
Instituto Superior de Agronomia, Universidade de Lisboa;
Doutor Thorsten Warneke, Senior Researcher
Institute of Environmental Physics, Universität Bremen, Alemanha;
Doutor Jan Jacob Keizer, Investigador Principal
Centro de Estudos do Ambiente e do Mar, Universidade de Aveiro;
Doutora Maria Teresa Gomes Afonso do Paço, Professora Auxiliar
Instituto Superior de Agronomia, Universidade de Lisboa;
Doutora Ana Paula Soares Marques de Carvalho, Professora Auxiliar
Instituto Superior de Agronomia, Universidade de Lisboa;
Doutora Teresa Maria Santana Barreto Soares David, Investigadora Auxiliar
Instituto Nacional de Investigação Agrária e Veterinária.
Instituições Financiadoras e âmbito:
Programa de doutoramento FCT (Sustainable Forests and Products, SUSFOR) bolsa PD/BD/52698/2014
Contents
Contents i
Abstract iii
Resumo v
Resumo (estendido) viii
Dedication ix
Acknowledgements xii
Citation xiii
Contributions xvi
Abbreviations xvii
Symbols and variables xxi
1 Introduction 1
1.1 Background: determination of evapotranspiration . . . 1
1.2 Energy balance models and their concepts . . . 2
1.3 Wildfires and their effect on the water cycle . . . 4
1.4 Fire danger rating . . . 5
2 Objectives and structure 7
3 Estimation and partitioning of actual daily evapotranspiration at an intensive olive grove using a simplified two-source energy balance model, (Article I) 9 4 Assessment of the indirect impact of wildfire (severity) on actual evapotranspiration in
eucalyptus forest based on the surface energy balance estimated from remote sensing
techniques, (Article II) 21
5 A promising new approach to estimate drought indices for fire danger assessment using
remotely sensed data (Article III) 49
6 Conclusion 65
A Model assessment over grassland 73
B Influence of tree height 75
C Estimation of the water stress coefficient of E. globulus 77
Abstract
Abstract
Until today, there is only little knowledge about the behavior of actual evapotranspiration (ETa) before
and after wildfires in Portugal, which can be estimated from remote sensing techniques.
In this thesis, an existing Simplified Two-Source Energy Balance model (STSEB) was adapted, based on moderate resolution imagery to estimate ETaand its contributing parts of transpiration and evaporation.
The study served to test the model and its precision. A bias of about ±1 mm d−1for the estimated ETa
was observed, where evaporation was regularly overestimated and transpiration underestimated. This error is acceptable for two-layer models based on satellite imagery, but estimates cannot be used for irrigation management.
The evolution of the estimated ETa after wildfires (up to four years) was analyzed at eucalypt stands
at the Caramulo mountain range in Portugal. By investigating the recovery of ETa after wildfire, the
difference between burnt and unburnt stands was mainly related to fire severity and stand characteristics. Two to three years after the fire events, the difference between burnt and unburnt stands became non-significant for all severity classes.
At the same region, the prediction of soil moisture deficit from drought indices was tested. The drought indices empirically estimate the dryness of an area and are directly related to fire danger. They are based on a simple water balance equation where effective rainfall and ETaare the only input and output,
respectively. In this work the empirical equation of (ETa) was substituted by the estimated ETafrom
STSEB, which enhanced the spatial resolution of the drought indices, being regularly interpolated from point estimates. Spatial patterns of soil moisture deficit were predicted, which indicated a relationship to fire occurrences.
To conclude, the ETa estimated by the remote sensing based STSEB model, was used to make
observations of the water cycle on a regional scale. In contrast to other post-fire studies, eucalypt stands in Portugal were found to be subject to a smaller hydrological impact after wildfires. This implies a fast recovery and a smaller influence on streamflow and groundwater resources. Furthermore, the drought indices, using the ETafrom STSEB, identified areas with higher proneness to drought, by improving the
spatial resolution, using satellite imagery compared to traditional interpolation techniques. The results support fire danger rating and might help to improve fire regime and forest management.
Keywords: energy balance equation, evaporative fraction method, Normalized Burn Ratio, Keetch-Byram Drought Index, Drought Code
Resumo
Resumo
O conhecimento sobre o comportamento da evapotranspiração real (ETa), antes e depois dos incêndios
florestais, especialmente pelo uso da detecção remota, é limitado.
No presente trabalho foi adaptado um modelo simplificado de equilíbrio de energia de duas fontes (STSEB), usando imagens de resolução moderada para estimar a ETae as suas componentes:
transpi-ração e evapotranspi-ração. O enviesamento da ETafoi de ±1 mm d−1, onde a evaporação foi regularmente
sobrestimada e a transpiração subestimada.
Foi observado o comportamento da ETaestimada após incêndios florestais (até quatro anos depois),
em eucaliptais da Serra do Caramulo, em Portugal. Investigando a recuperação da ETaapós um incêndio,
a diferença observada entre áreas ardidas e não ardidas deveu-se principalmente a diferentes características da floresta e à severidade do fogo. Dois a três anos após o fogo, a diferença entre áreas ardidas e não ardidas tornou-se não significativa para todos as classes de severidade.
Além disso, foram testados índices de seca baseados num balanço hídrico simples, usando a ETa
estimada. Foram estimados padrões espaciais de défice de água no solo, que se relacionaram com a ocorrência de fogo.
Para concluir, o modelo STSEB permite estimar a ETaa uma escala regional, e acompanhar o ciclo
da água em áreas florestais usando técnicas da detecção remota. Em comparação com outros estudos dos efeitos do fogo, o impacto hidrológico após incêndios florestais em eucaliptal foi menor neste estudo. Isto revela uma recuperação rápida e um menor impacte nos recursos hídricos de superfície e subterrâneos. Além disso, o modelo STSEB, juntamente com os índices de seca, identificaram áreas com maior propen-são à seca. Os resultados apoiam a cartografia de perigosidade de incêndio e podem ajudar a melhorar a gestão florestal.
Palavras chave: equação de balanço de energia, método da fração evaporativa, Normalized Burn Ratio, Keetch-Byram Drought Index, Drought Code
Resumo (estendido)
Resumo (estendido)
O conhecimento sobre o comportamento da evapotranspiração real (ETa), antes e depois dos incêndios
florestais, especialmente pelo uso da detecção remota, é limitado. Com as alterações climáticas e uma ocorrência crescente de desastres ambientais, nomeadamente incêndios florestais, torna-se necessário estudar a relação entre o balanço hídrico e acorrência de secas e incêndios florestais, a uma escala regional.
Para atingir este objetivo, este estudo aplicou um modelo simplificado de balanço de energia de duas fontes (STSEB), usando imagens de resolução moderada (Landsat 5 e 8 com 30 m e MODerate-resolution Imaging Spectroradiometer, MODIS com 500 m de resolução espacial). Primeiramente, o modelo foi testado para estimar a ETae as suas componentes: transpiração e evaporação. Foram utilizados dados de
campo (medições de fluxo de seiva e da evaporação com lisímetros), e método das flutuações instantâneas (eddy covariance, EC) num olival. O enviesamento da ETafoi de ±1 mm d−1, onde a evaporação foi
regularmente sobrestimada e a transpiração subestimada. A introdução no modelo da correcção dos factores beta levou uma melhoria das estimativas da ETa.
Em segundo lugar, a recuperação da ETa estimada após incêndios florestais (até quatro anos) foi
observada, comparando povoamentos de eucalipto ardidos e não ardidos localizados na Serra do Caramulo, do centro-norte de Portugal. As áreas ardidas foram classificadas de acordo com a severidade do fogo, utilizando índice espectral Normalized Burn Ratio. A diferença absoluta de ETaentre áreas ardidas e
não ardidas foi usada para identificar mudanças provocadas pelo fogo e acompanhar a sua magnitude ao longo do tempo. Investigando a recuperação da ETaapós um incêndio, a diferença observada entre
áreas ardidas e não ardidas deveu-se principalmente a diferentes características da floresta e à severidade do fogo. Logo após os incêndios, o solo contribuiu com cerca de 70% da densidade de fluxo de calor latente (LE, W m−2) enquanto a vegetação apenas 30% de LE. Pelo contrário, em áreas não ardidas estes valores foram de 20% e 80% de LE, respectivamente. Dois a três anos após o fogo, a diferença entre florestas ardidas e não ardidas tornou-se não significativa para todas as classes de severidade do fogo (baixa, moderada, severa).
Em terceiro lugar, foi testada a previsão do défice de água no solo a partir de índices de seca na mesma área de estudo. De modo a estudar a influência da ETa antes dos incêndios florestais, foram
aplicados índices de seca usando a ETaestimada pelo STSEB. Índices como o Drought Code (DC) ou
o Índice de Seca Keetch-Byram (KBDI) baseiam-se numa versão simplificada da equação do balanço hídrico, em que a evapotranspiração é considerada como o único termo de perda. As equações empíricas incluem a evapotranspiração de referência (ETo, na maioria dos estudos recentes ainda denominada
evapotranspiração potencial, ETp), a partir da qual a evapotranspiração foi estimada. Essas abordagens
empíricas foram substituídas, no trabalho presente, pela ETa estimada a partir do STSEB, produzindo
também informação espacial sobre o conteúdo de água do solo e resultando em uma resolução espacial mais alta da cartografia de perigosidade de incêndio em comparação com as abordagens tradicionais
de interpolação. Foram estimados padrões espaciais de défice de água no solo, que se relacionaram com a ocorrência de fogo. Foi encontrado um valor-limite, classificando as áreas como tendo menor ou maior propensão à seca, e relacionando-as com a ocorrência de incêndios florestais. Com o aumento das condições de seca, por ex. em julho, a classificação, usando o KBDI, permitiu identificar cerca de 75% dos incêndios que ocorreram na área de estudo numa área pré-definida. Desta área predefinida, 57% da área foi classificada como propensa ao fogo e incluiu 75% da área ardida.
Além disso, foram testadas e utilizadas duas abordagens diferentes de coeficientes para estimar a ETaem dias em que as imagens de satélite não estão disponíveis: o coeficiente cultural ajustado (Kc,adj),
que combina o efeito da transpiração da cultura, a evaporação do solo e o stresse hídrico; e o coeficiente cultural basal (Kcb), que representa apenas o efeito da transpiração da cultura. O valor do Kcbé igual ao
da ETaquando não há stresse hídrico e o efeito da evaporação do solo é nulo. Estes coeficientes foram
usados para estimar continuamente o teor de água no solo através de índices de seca (por exemplo, KBDI e DC), para estimar a ETacomo producto da ETodo dia com o coeficiente retirado da última imagem
de satélite disponível, que entram seguidamente nas equações simplificadas de balanço hídrico. Este processo é repetido até à data em que estão disponíveis observações de satélite, que permitiam obter uma nova estimativa da ETaa partir do STSEB e consequentemente novos coeficientes.
Esta investigação fornece uma compreensão das mudanças no balanço de energia e na ETa, e das
suas componentes numa região extensa de floresta no centro-norte de Portugal. Através da aplicação do modelo STSEB sobre as áreas afectadas pelo fogo, foi obtida uma boa concordância entre estimativas do modelo e os fluxos de balanço de energia medidos (densidade de fluxo de radiação líquida, Rn; densidade
de fluxo de calor sensível para o solo, G; densidade de fluxo de calor sensível para a atmosfera, H; e LE) e, consequentemente, da ETa diária. Em comparação com outros estudos dos efeitos do fogo, o
impacto hidrológico após incêndios florestais em eucaliptal foi menor neste estudo, e isso deveu-se à fraca severidade do fogo, já que a maioria deles foi classificada como fogo de gravidade baixa a moderada. Isto revela uma recuperação rápida e um menor impacto nos recursos hídricos de superfície e subterrâneos. Além disso, substituindo as estimativas da evapotranspiração nos índices de seca (KBDI e DC) pela estimativa de ETa pelo modelo STSEB, áreas com maior propensão à seca foram identificadas, sendo
fortemente relacionadas com a ocorrência de incêndios florestais. A melhor distinção destas áreas foi alcançada através da maior resolução espacial devida ao uso de imagens de satélite, pois os métodos convencionais ainda dependem da interpolação entre as estações meteorológicas. Além do mais, o modelo STSEB, juntamente com os índices de seca, permitiram a identificação de áreas com maior propensão à seca. Os resultados apoiam a cartografia de perigosidade de incêndio e podem ajudar a melhorar a gestão florestal. Num trabalho futuro, a aplicação dos índices de seca, KBDI e DC, em combinação com a ETa
do modelo STSEB, será testada para outras regiões, por ex. Indonésia, usando diferentes observações por satélite (por ex., Landsat, Sentinel). A este respeito a identificação de áreas com maior propensão ao fogo será melhorada usando abordagens de classificação mais sofisticadas.
Palavras chave: equação de balanço de energia, método da fração evaporativa, Normalized Burn Ratio, Keetch-Byram Drought Index, Drought Code
Dedication
This work is dedicated to my creator, life saver, supporter and faithful friend who should get all the credit of this work. Without him I would not have been able to become who I am today.
But blessed is the one who trusts in the LORD, whose confidence is in him. They will be like a tree planted by the water that sends out its roots by the stream. It does not fear when heat comes; its leaves are always green. It has no worries in a year of drought and never fails to bear fruit.
Acknowledgements
My gratitude goes to:
Prof. José Miguel Cardoso Pereira, who despite his tight work schedule, always found a time slot to communicate or send data. I would also like to thank him for helping me with bureaucratic matters in addition to supervising my scientific work.
Dr. João N. Silvawhom I am forever indebted for believing in me becoming a researcher and that all this can be done with a calm attitude. Thank you for being my adviser, my teacher, my colleague and also my friend. “Hakuna matata!”
Dr. Juan Sanchnéz, whom I will not be able to repay someday soon for the time, effort and patience he put in me to understand and use his “simplified two-source energy balance model”. He is the cornerstone of this work and I appreciate him as my role model being a professional, well-organized, and successful researcher, but also a kind and humbled human being to the ones who get to know him.
Prof. Dr. Isabel Ferreirawho started guiding me from my master studies on and hopefully continues to be in my life till the end! I am in her debt in so many ways and thankful for always being there for me – professionally and personally – that it would be hard to start a list here. Let me tell you that Portugal and my memories connected to this country could not be so bright, sunny and lovely without her!
Dr. Thorsten Warnekewho found me at the secretary’s office and really wanted to have me on board! Thank you for your support and the valuable time we spent talking about my research. I do hope that we will continue working together.
Dr. Nuno Conceiçãowho taught me how hard a researchers life can be in the field. He is one of the hardest working and most dedicated persons I have ever met.
Dr. Gunnar Spreen, Prof. Dr. Georg Heygster and Prof. Dr. Justus Notholtwho integrated me into their research group (PHAROS) during my stay at the Institute of Environmental Physics in Bremen. I am especially thankful to the regular group meetings where I could practice to talk and partly defend my research in front of other researchers.
Dr. Christian Melsheimerwho read and corrected my work, discussed certain matters of my research and always contributed by either explaining certain issues or asking questions at the group meetings.
Dr. Jacob Keizer and Dr. João Nuneswho provided valuable data sets, established professional connections, and offered personal guidance without this work could have never been originated.
André Garciawho started with me the Master programme and will finish with me the SUSFOR PhD programme. He was always there for me answering all my bureaucratic questions, when my Portuguese was not sufficient to understand certain procedures.
Dr. Paula Soareswho also provided to me data sets and helped me getting connected to the people I needed for my research. She lectured me in forest fire management, but also was always there for a private chat.
Dr. Teresa Scholzmy friend, who supported me at the end of the thesis to keep a good spirit and who gave me some valuable advice to put the finishing touch to the manuscript.
Dr. Andreas Häuslermy dear husband without whom I could not have finished my thesis. He did not only spend time with the kids when I had to work, or bring them to school so I could start earlier working at the university, he also pushed me to learn new technologies. Without his help I would have never learnt how to use Latex or (even less likely) a program language such as Python. Thanks for bringing out the best of me!
My parents, Lorenz and Karin, who have never liked much my path but always supported me a 100% of their power. Even though they cannot follow why this was important to me, I thank them for their constant prayers and taking care of my financial welfare.
My children, Anna and Maryam, who always believe in me and see the best of me as a mother. Their simple view of life took me always back to reality and to the important things of our being. It makes me wonder what my children will remember as grown-ups, when I see Maryam playing the mother role and leaving me as “the grandmother” at home to stay with her kid (baby doll), so she can go to work. Love you babes!
Citation
Hermes, certamente, deixou escapar o ento da mão. Porque, agora, parece o Diabo à solta, qual tufão, E todos os presentes, com baldes de água, como loucos,
Acorríamos, desesperadamente, aos focos de incêndio, Que punham em risco a aldeia e a população.
Estávamos nesta aflição, sem tempo para pensar na morte, Quando se forma um remoinho de fogo puxado a vento norte, Que atirou uns contra as paredes, e outros pela ar. E aí, todos pensámos que era chegada a hora do Juízo Final!
Mas graças a São Pedro, o padroeiro, tal não aconteceu. Porque esse remoinho gigante de fogo que se formou, Não durou mais que meio minuto a passar por cima da aldeia, E a atravessar a Ribeira e seguir a rota de destruição e morte. E essa, não haja dúvida, foi na verdade, a nossa sorte!
Porque se durava dois minutos, ficávamos ali, todos assados, E havia mais mortes a lamentar, do incêndio de Pedrógão Grande, como aconteceu, infelizmente, pouco tempo depois, Quando essa frente do fogo apanhou os fugitivos do Incêndio, Quatro quilómetros à frente, na fatídica "estrada da morte!" Na má hora em que, possivelmente, fugiam do incêndio Que se aproximava, sem terem tempo de se refugiar Na Praia da Roca, na vila de Castanheira de Pêra, O mais próximo e seguro lugar, para a população se refugiar.
João de Deus Rodrigues, Mosteiro (Pedrogão Grande) As Cinzas e a Esperança
Contributions
Journal papers
1. M. Häusler, N. Conceição, L. Tezza, J. M. Sánchez, M. L. Campagnolo, A. J. Häusler, J. M. N. Silva, T. Warneke, G. Heygster, M. I. Ferreira. 2018. Estimation and partitioning of actual daily evapotranspiration at an intensive olive grove using the STSEB model based on remote sensing, Agr. Wat. Managm.. 201:188 - 198. DOI: 10.1016/j.agwat.2018.01.027
(2018 impact factor: 2.848, 5-year impact factor: 3.366)
2. M. Häusler, J. P. Nunes, P. Soares, J. M. Sánchez, J. M. N. Silva, T. Warneke, J. J. Keizer, J. M. C. Pereira. 2018. Assessment of the indirect impact of wildfire (severity) on actual evapotranspiration in eucalyptus forest based on the surface energy balance estimated from remote sensing techniques, Int. J. Rem. Sen.
(2016 impact factor: 1.724)
3. M. Häusler, J. P. Nunes, J. M. N. Silva, J. J. Keizer T. Warneke, J. M. C. Pereira. 2018. A promising new approach to estimate drought indices for fire danger assessment using remotely sensed data, Agr. For. Meteorol.
(2018 impact factor: 3.887, 5-year impact factor: 4.753)
Other articles were published that are not included in the work, but for which significant contribu-tions were made, during the time as PhD student.
4. N. Conceição, M. Häusler, S. Lourenço, C. Pacheco, L. Tezza, M. I. Ferreira. 2017. Three year of monitoring evapotranspiration components and crop and stress coefficients in a deficit irrigated intensive olive orchard, Agr. Wat. Managm.. 191:138 - 152. DOI: 10.1016/j.agwat.2017.05.011
5. M. Häusler, J. M. N. Silva, S. Cerasoli, G. L. Saldaña, and J. M. C Pereira. 2016. Modelling spectral Reflectance of open Cork Oak Woodlands: A Simulation Analysis of the Effects of Vegetation Struc-ture and Background, Int. J. Rem. Sen.. 37(03):492 - 515. DOI: 10.1080/01431161.2015.1134847
Conference Proceedings
The professional exchange and presentation of ongoing research was regularly conducted on various occasions.
1. M. Häusler, J. M. N. Silva, P. Soares, J. Keizer, T. Warneke, J. M. C. Pereira. Using actual evapo-transpiration to estimate fire danger from MODIS satellite imagery: a case study in a Eucalyptus standEGU, 08.-13. Apr. 2018, Vienna, Austria.
2. M. Häusler, J. M. N. Silva, P. Soaresa, J. M. Sánchez, J. P. Nunes, J. J. Keizer, M. A. Cerqueira, F. Goes, T. Warneke, and J. M. C. Pereira. Impact on the energy balance fluxes and the surface variables after wildfires: A case study in Eucalyptus stands in Portugal, based on remote sensing AGU Virtual Poster Showcase. October 2017, DOI 10.13140/RG.2.2.17189.81128
3. M. Häusler, J. M. N. Silva, P. Soaresa, J. M. Sánchez, J. P. Nunes, J. J. Keizer, M. A. Cerqueira, F. Goes, T. Warneke, and J. M. C. Pereira. Changes of daily evapotranspiration after wildfires using a simplified two-source energy balance (STSEB) model based on remote sensingCiência 2017, Lisbon, Portugal. 3-5 Jul. 2017.
4. M. Häusler, N. Conceição, L. Tezza, J. M. Sánchez, J. M. N. Silva, J. M. C. Pereira, M. I. Ferreira. Application of a two-source energy balance (TSEB) model from remote sensing to estimate daily actual evapotranspiration at an intensive olive groveCiência 2016, Lisbon, Portugal. 4-6 Jun. 2016.
5. M. Häusler, J. M. N. Silva, J. P. Nunes, P. Soares, J. M. Sánchez, T. Warneke, J. J. Keizer, J. M. C. Pereira. Assessment of the hydrological effect of fire-induced vegetation changes on evapotranspira-tion at a regional scaleDPG Tagung, Mar. 2017, Bremen, Germany.
Abbreviations
API Antecedent Precipitation Index CFFWI Canadian Forest Fire Weather Index CWSI Crop Water Stress Index
DC Drought Code EC Eddy Covariance
EVI Enhanced Vegetation Index FC Field Capacity
FWI Canadian Forest Fire Weather Index IC Internal Calibration
iTDVI Temperature Dryness Vegetation Index KBDI Keetch-Byram Drought Index
LAI Leaf Area Index
METRIC Mapping EvapoTranspiration at high Resolution using Internalized Calibration MODIS MODerate-resolution Imaging Spectroradiometer
NDTI Normalized Difference Temperature Index NBR Normalized Burn Ratio
PE Percentage Error
PWP Permanent Wilting Point
REBM Resistance Energy Balance Model RMSE Root Means Square Error
SMAP Soil Moisture Active Passive radiometer SMOS Soil Moisture Ocean Salinity product SMD Soil Moisture Deficit
STSEB Simplified Two-Source Energy Balance model TSEB Two-Source Energy Balance model
UAV Unmanned Aerial Vehicle WDI Water Deficit Index
Symbols and variables
α Albedo, adim.
αv Albedo from canopy, adim.
αs Albedo from pure soil, adim.
γ Psychrometric constant, kPa,◦C ∆ Vapour pressure curve slope, kPa,◦C
∆SM Change of soil water content with time, mm d−1 ε Surface emissivity, adim.
εs Emissivity of the pure soil, adim.
εv Emissivity of the vegetation, adim.
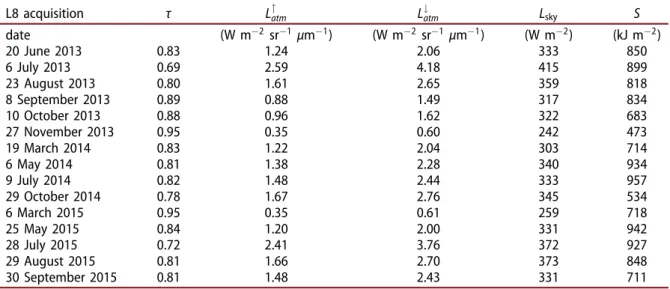
L↑atm Up-welling sky irradiance, W m−2sr−1µm−1 L↓atm Down-welling sky irradiance, W m−2sr−1µm−1
δQ Change of soil water (soil water depletion in mm) during a certain time ρ Air density kg m−3
θFC Water content at field capacity, m3m−3
θWP Water content at wilting point, m3m−3
τ Transmissivity, adim.
CG Coefficient between 0.15–0.4 to obtain G from Rn
Cp Volumetric heat capacity of air at constant pressure, J K−1m−3
DP Deep percolation, mm d−1 ea Actual vapour pressure, kPa
es Saturation vapour pressure, kPa
ETa Actual evapotranspiration for individual crops, mm d−1
ETc Crop evapotranspiration under standard conditions, mm d−1
ETp Daily potential evapotranspiration, mm d−1
ETo Daily reference evapotranspiration, mm d−1
ER Effective rainfall that is the actual water reaching and
infiltrating the soil depths without interception for drought code, mm d−1 G soil heat flux density, W m−2
Gd daily soil heat flux density, W m−2d−1
gs daily stomata resistance, cm s−1
H Sensible heat flux density, W m−2
Hd Daily value of sensible heat flux density, W m−2d−1
Hi Instantaneous value of sensible heat flux density, W m−2
Hs Sensible heat flux density of the soil, W m−2
I Irrigation, mm d−1 Kc Crop coefficient, adim.
Kc,adj Adjusted crop coefficient, adim. Kcb Basal crop coefficient, adim.
Ke Soil evaporation coefficient, adim. Ks Water stress coefficient, adim. LE Latent heat flux density, W m−2
LEv Latent heat flux density of the vegetation, W m−2
LEs Latent heat flux density of the soil, W m−2
LEd Daily value of latent heat flux density, W m−2d−1
LEi Instantanous value of latent heat flux density, W m−2
Lf Seasonal correction factor for day length, adim.
Lsen Top of atmospheric radiance, i.e. the radiance measured by the sensor
Lsky Incident long-wave radiation, W m−2sr−1µm−1
M AR Mean annual rainfall, mm y−1
N DV I Normalized Difference Vegetation Index, adim.
N DV Is Normalized Difference Vegetation Index of the soil, adim.
N DV Iv Normalized Difference Vegetation Index of the vegetation, adim.
N IR Near infrared reflectance, nm
N IRs Surface reflectance from the near infrared band coming from the soil, nm
N IRv Surface reflectance from the near infrared band coming from the vegetation, nm
Pv Partial vegetation, adim.
p Average fraction of the total available water in the root zone, adim. Peff Effective rainfall that is the actual water reaching and infiltrating
the soil depths without interception, mm d−1 Pdaily The daily measured rainfall in the open, mm d−1
RAW Readily available soil water in the root zone, mm RED Surface reflectance from the red band, nm Rn Net radiation, W m−2
Rnv Net radiation of the vegetation, W m−2
Rns Net radiation of the soil, W m−2
Rnd Daily value of of net radiation, W m−2d−1
Rni Instantaneous value of net radiation, W m−2
ra Aerodynamic resistance, m s−1
raa Aerodynamic resistance to heat transfer between level of apparent sink of momentum and the reference height, m s−1
rh
a Aerodynamic resistance to heat transfer between the canopy
and the reference height, m s−1
rsa Aerodynamic resistance to heat flow in the boundary layer immediately above the soil surface, m s−1
REDs Surface reflectance from the red band originating from the soil, nm
REDv Surface reflectance from the red band originating from the vegetation, nm
RP Moisture equivalent after rain, % of dry soil RO Runoff, mm d−1
S Gobal solar radiation, kJ m−2or MJ m−2d−1 SF subsurface flow, mm d−1
Si Initial threshold separating a value range into two groups
SW IR Shortwave infrared reflectance, nm Ta Temperature of the air,◦C, or K
T AW Total available soil water in the root zone, mm Tmax Maximum daily air temperature,◦C, or K
Tmean Mean daily air temperature,◦C, or K
Tmin Minimum daily air temperature,◦C, or K
T r Transpiration, mm d−1
Trad Radiometric surface temperature, K
T rmax Maximum relative transpiration, mm d−1
T rrel Relative transpiration, mm d−1
Ts Temperature of the soil,◦C, or K
Tv Temperature of the vegetation,◦C, or K
CHAPTER
1
Introduction
This work is the interface between forest hydrology and forest management, where a Two-Source Energy Balance (TSEB) model from hydrological science is applied to forestry. The thesis is organized in three parts presenting three different specific study purposes.
First, the simplified TSEB (STSEB, Sánchez et al., 2008b) was intensively tested for partitioning ETa
into its components (i.e. transpiration and evaporation), which until then had not been done in detail. For this purpose data from a long-term water use study at an olive grove were used. Then, the new found results, concerning the partitioning of ETawere transferred to burnt eucalypt forests to investigate the
changes in ETa, transpiration and evaporation after fire events. Finally, the remotely estimated ETafrom
STSEB was incorporated into fire danger indices to improve fire danger rating in forest stands, using a novel methodology developed for this work.
1.1
Background: determination of evapotranspiration
The estimation of actual evapotranspiration (ETa, evaporated amount of water under non-standard
conditions, Allen et al., 1998) is highly important to water managers and land users as it is directly related to crop productivity, and allows to optimize for irrigation strategies. There are many studies on water use in agriculture (Green et al., 1989; Ferreira et al., 1996; Hugalde and Vila, 2014; Conceição et al., 2017). Also the hydrological cycle of forest areas has been extensively studied, (e.g. David et al., 1994; Wilson et al., 2001; Testi and Villalobos, 2009), where the evapotranspiration is often determined as a residual term of the water balance (e.g. Pereira de Almeida and Riekerk, 1990; Baldocchi and Ryu, 2011). These and studies about the variation of forest evapotranspiration with weather conditions and disturbances (Kang et al., 2006; Bond-Lamberty et al., 2009; Whelan et al., 2015), were typically done at the catchment scale in different ecosystems. As part of this work was done in eucalypt plantations, there was a particular interest in finding studies about this tree species. However, studies focusing on the water cycle in eucalypt forests have been mainly conducted in Australia (Langford, 1976; Watson et al., 1999; Nolan et al., 2014, 2015), that differed to Portugal in their soil properties and climatic conditions. Generally, water balance studies give estimates over long periods and are reliable in determining the main input (precipitation) and outputs (evapotranspiration, drainage and runoff, Monteith, 1994).
Another method to obtain evapotranspiration is the eddy covariance (EC) method, by measuring exchanges of heat, mass, and momentum. It emerged in the late 1950s (Schotland, 1955; Suomi, 1957), but only with the development of the current generation of sonic anemometers, the EC method became more widely spread, not just by micrometeorologists but also by ecologists (Foken et al., 2012). Meanwhile, it is often considered as the reference method in water use studies. However, the EC method, which operates well on a field-scale, cannot be easily applied over areas with rugged and/or mountainous surfaces. The processing and interpretation of the data requires extensively-trained personnel and is still very costly.
ETacomponents i.e. transpiration and evaporation. Transpiration, which is the liquid water vaporization
from plant tissues and its removal to the atmosphere (Allen et al., 1998), can be estimated from sap flow measurements, which require additional on-site measurements to obtain transpiration (David et al., 1997; Wilson et al., 2001, e.g. stand sapwood cross-sectional area). Evaporation is the process of converting liquid water to water vapour (vaporization) and removing it from the soil surface (Allen et al., 1998). It can be obtained by using weighing lysimeters (Conceição et al., 2017; Ferreira et al., 1996). Both on-site measurements have the disadvantage that they are intensive in highly-qualified labour and, therefore, costly and unfeasible over long time spans. With the emergence of remote sensing methods, it is possible to obtain information on heterogeneous vegetation surfaces at different spatial and temporal resolutions.
1.2
Energy balance models and their concepts
The idea of dividing the evapotranspiration from vegetated surface into its contributing parts of soil and canopy, considers partial vegetation cover conditions and is suitable to operate with Earth observation systems to work over extended areas. In comparison, many ground based methods exist that accurately measure the components of the water or energy balance at field-scale. The output of on-site measurements are indispensable for model adjustments. However, it is not practicable to simply interpolate between those field-scale measurements, as a high spatial variability of the different vegetation types and soil properties exist (Scott et al., 2000; Sánchez et al., 2008a). In fact, over extended areas, local measurements are only meaningful when the area is homogeneous. This is also applicable for the use of one-source models that simplify the surface layer to a homogeneous vegetation layer of a certain height. A more detailed description of point location measurements, their development, and the distinction from one-source to two-source models is given in the introduction of Chapter 3.
All models based on flux gradient relationships (single or multi-layer models), consider the soil-plant-atmosphere continuum as an electric circuit, where at least two resistances (i.e. stomata and boundary layer resistance) must be overcome. Two-source energy balance models originated in the 1980s (Shuttleworth and Wallace, 1985; Choudhury et al., 1987). These models consider the soil and the vegetation layer as separate sources. Shuttleworth and Wallace (1985) used the concept of bulk stomata resistance and aerodynamic resistance of the vegetation for the vertical transport (see Monteith, 1965). To that, they added the concept of surface resistance of the substrates surface (rsa, upper soil surface, Monteith, 1981) and the resistances in the canopy (rha, mean canopy flow).
Norman et al. (1995) proposed a two-source energy balance model that includes brightness temperature from remote sensing, assuming that the sensible heat flux density can be estimated from the surface temperature (Trad). The authors suggested to estimate the energy fluxes by the contribution of the soil and
the vegetation separately. It is difficult to estimate the different temperatures for the components of soil and vegetation, when only one surface temperature is available. Several authors extract these temperatures by establishing a relationship between the surface temperature (e.g. from satellite brightness temperature) and vegetation indices and/or partial vegetation cover (Carlson et al., 2007; Yang et al., 2015; Kasim and Usman, 2016).
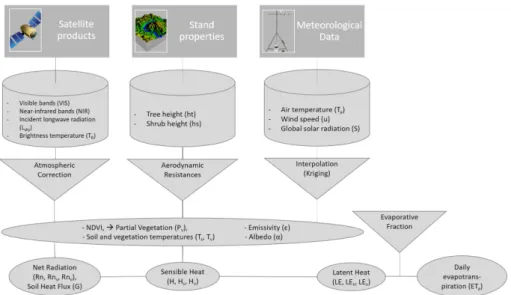
This study is based on a model by Sánchez et al. (2008b) who further developed the model of Norman et al. (1995) which has previously been validated (Zhan et al., 1996; Kustas and Norman, 1999). A general scheme of the model, describing its input variables, processes, intermediate results and output is shown in Fig. 1.1.
transpiration and evaporation. Colaizzi et al. (2014) only recently tested a TSEB model to calculate ETa
and its components at cotton fields. They requested researchers to conduct similar studies for different crops and different water supply conditions, suggesting remote sensing platforms, from ground-based to satellite scales (Colaizzi et al., 2016).
In Ortega-Farías et al. (2016) another TSEB model was tested for partitioning ETainto its components.
They obtained surface temperature at very high spatial resolution of 6×6 cm, using multispectral and infrared thermal cameras mounted to a helicopter-based unmanned aerial vehicle (UAV). Their results encouraged to estimate transpiration and evaporation from lower spatial resolution (e.g. brightness temperature from satellite product), applying TSEB models.
In this study the STSEB model that is designed to operate with remote sensing data to estimate ETa
over different crops, was applied to benefit from these advantages.
Figure 1.1: General overview of the input data (cylinders), processes (triangles) and generated output (ovals) by the two-source energy balance model inspired by Sánchez et al. (2008b)
The model was newly implemented in Python code and had first to be tested, even though the model’s performance has already been studied over a variety of crops and forested areas (Sánchez et al., 2008b; Sanchez, 2008; Sánchez et al., 2009).
For testing the STSEB model, data from a long-term study at an olive orchard (WUSSIAAME – Water Use, Survival Strategies and Impact of Agrochemicals in Agricultural Mediterranean Ecosystems) were actively collected and further processed. This study provided high-quality data of ETaand its components,
by the means of different field measurement techniques (EC, lysimeter and sap flow measurements) over a period of three years. Long-term studies that provide own data for evaporation and transpiration from diverse on-site measurements are rare. The only ground-based technique for transpiration is to measure the sap flow, in which this research team has – as well as in other water use quantifications – several decades of experience.
Since the STSEB model can be adopted to any vegetation type, it has benefited from the existing datasets and the accumulated knowledge of the WUSSIAAME research team to explore the model for partitioning ETainto its contributing parts, using remote sensing techniques. With this done, the model
was applied to the olive grove with the aim of testing the agreement between measured and estimated ETa, transpiration and evaporation as later described.
1.3
Wildfires and their effect on the water cycle
Wildfires disturb the terrestrial environment, the ecological aquatic processes and influence the water cycle in terms of the water quantity (e.g. stream flow) and water quality of streams (e.g. water pollution with nitrate inputs; increased water temperature by reduced tree shading, Hitt, 2003). They change the soils composition (e.g. pH, minerals) and porosity (e.g. soil texture), and thereby reduce the infiltration of the water into the soil. Hydrophobic substances lead to a higher water repellency (Nunes et al., 2016) that causes increased runoff, mudflows and soil erosion (Shakesby et al., 1993; Montes-Helu et al., 2009; Staley et al., 2017) especially in regions with steep slopes (e.g. Portugal, Prats et al., 2013). Wildfires, in particular crown fires, lead to a decrease of leaf area index (LAI) that is related to rainfall interception and vegetation transpiration (Mitchell et al., 2009). (Spracklen et al., 2012) observed a direct relationship between the change of vegetation cover and the local micro-climate (i.e. rainfall). In the case of Portugal, changes in ETaare not related to changes of precipitation because the continental precipitation recycling
ratio is extremely low, meaning there is no connection between these variables (Van der Ent et al., 2010). Knowing the effects of fires on the water cycle, one becomes aware of the importance of determining its components such as the ETa. No study was found local to Portugal, that deals with changes in
ETaafter wildfires and its long-term recovery in eucalypt stands. This is important as recent literature
investigated changes of ETa that was up to double as high compared to ETafrom long unburnt forests.
The differences lasted between 7 to 30 years (Nolan et al., 2014), affecting streamflow and consequently water supply in Australia. The increase of ETa may be explained by fire induced epicormic resprouting,
and together with an only partial defoliation, the overall leaf area might be temporarily higher than compared to unburnt stands.
Sánchez et al. (2015) studied changes in the energy flux patterns after wildfires that affected a pine and shrub area. For this purpose the STSEB model was applied using Landsat 5-TM and Landsat 7-EMT+ images, and meteorological data from the study site. The pine area mitigated differences in evapotranspiration between nine to eleven years, and the shrub area six to seven years after the fire.
In Portugal, only studies that investigated the effect of clear-cutting on the water cycle were found. Hawtree et al. (2015) analyzed time series of long-term hydrologic impacts of afforestation in the Águeda watershed that gave no implication of significant reductions in stream-flow. David et al. (1994) also studied streamflow after clear-cutting of Eucalyptus globulus in two watersheds 60 km north of Lisbon, Portugal. Only short-lived increases of streamflow were observed (about one to two years after clear-cutting).
The recovery time of ETato conditions before the fire breakout over a regional scale were investigated.
Using the STSEB model provided the opportunity to do this also for the components of ETa(transpiration
and evaporation). In the literature, little is reported about the changes in transpiration and evaporation after wildfires. Nolan et al. (2014) observed tree and shrub transpiration and forest floor evaporation after wildfires at a re-sprouting mixed eucalypt forest. They showed that the contribution of the components to the total evapotranspiration was still different three years after the fire compared to unburned areas. The Australian study reported that the change in ETaand its components was mainly influenced by the
topography, through its effects on forest structure, the evaporative demand, and the fire severity.
However, in literature there are unburned forest studies that measured the transpiration of different tree species. Roberts (1983) compared several studies from northern European tree species. The listed studies lacked partly in description of the understory, but the forests covered a range of full canopy cover to open stands. They found no significant differences for annual transpiration. Benyon and Doody (2015) confirmed this finding for Eucalyptus globulus Labill. and Pinus radiata. As the ground-based data collection of transpiration is rather work intensive (Benyon and Doody, 2015; Sun et al., 2017),
only few studies exist, measuring the sap flow at forest stands. In Portugal David et al. (1997) measured transpiration with the Granier sap flow method (Granier, 1985) to understand the evolution of transpiration from Eucalyptus globulus canopies during drying periods, by assessing the role of the main controlling factors. They concluded that the long-term trend of transpiration during the dry spring-summer period was mainly controlled by the soil moisture deficit (SMD). The data of David et al. (1997) were also used to obtain a possible stress coefficient (Ks) for eucalypt stands. By knowing the soil water content, rainfall
(input) and the estimated daily ETa, it was possible to estimate when the soil water might be depleted
(permanent wilting point, PWP).
1.4
Fire danger rating
For fire danger assessment, the fuel moisture content plays an important role of the potential of fire ignition and fire spread. According to Torres et al. (2018), only few studies link the soil moisture to fire danger. Possible reasons might be that the retrieval of on-site soil moisture measurements are rather work intensive and that they will only be valid on a field-scale (Brocca et al., 2007).
The estimation of SMD from space deal with other limitations. Many studies attempted to relate vegetation indices from remote sensing data to wildfire occurrences (Chuvieco et al., 2004; Bisquert et al., 2014). However, according to Qi et al. (2012) the soil moisture content has a much stronger correlation with live fuel moisture than with measures of photosynthetic activity e.g. Normalized Difference Vegetation Index (N DV I).
Another satellite data application is to retrieve soil moisture from microwave data, but the current satellite products have spatial and temporal restrictions. For example, the Soil Moisture Ocean Salinity product (SMOS; Level 3) is provided in 2-3 days interval with a pixel size of about 40 km, which in many cases is too coarse for the end-user. Lately, Sentinel-1 microwave data is used to retrieve soil moisture and is combined with other satellite products such as Landsat-7/8 for high spatio-temporal resolution (Amazirh et al., 2018). An overview of remotely sensed soil moisture data is given by Mohanty et al. (2017), listing the instruments and satellite platforms with their corresponding resolutions in time and space.
For the reasons just mentioned, the regional fire danger rating systems are still mainly based on local meteorological measurements. These measurements are used to estimate the moisture content of living and dead fuels and the water content of the soil, being reliable for the assessment of fire danger. The Drought Code (DC) is an index of the moisture content of deep, compact soil organic layers, closely correlated with seasonal drought effects on plant fuels It belongs to the Canadian Forest Fire Weather Index (FWI), which is a fire danger rating system released in Canada in 1970. The FWI consists of six different subindices, where all are determined by daily meteorological recordings (e.g. temperature, wind speed, relative humidity and rain). Three of the indices represent the fuel moisture of soil, dead and living fuels. Another two subindices obtain the fuel consumption and the rate of spread, and a final index represents the fire intensity as energy output rate per unit length of fire front (Van Wagner, 1974).
The DC is based on a very simple water balance equation, where the only input is the effective rainfall (Peff) and the output is the estimated ETaby dividing the reference evapotranspiration EToby two (in
the literature ETois often referred to as potential evapotranspiration, ETp). The EToequation is based
on the approach of Thornthwaite (1948), who suggested to estimate water requirements of plants by using air temperature (Ta) and day length. The equation estimates he obtained were very imprecise and only
criticized his own equation by saying: "This mathematical development is far from satisfactory...it is completely lacking in mathematical elegance. It is very complicated and without nomograms and tables as computing aids would be quite unworkable. The chief obstacle at present to the development of a rational equation is the lack of understanding of why potential evapotranspiration corresponding to a given temperature is not the same everywhere." (Thornthwaite, 1948). Nevertheless, since decades in practice, but also for many research purposes the equation to retrieve ETofrom the DC stays unmodified.
The Keetch-Byram Drought Index (KBDI) is another fire danger index based on the water balance equation and often used to estimate SMD. The equation suggested by Keetch and Byram (1968) uses the mean annual rainfall and the maximum daily temperature (Tmax) to compute the drought factor. It
depends on several assumptions (i.e. arbitrary soil depth of 8 inches, evapotranspiration rate is a function of weather variables and vegetation density).
Once again, the actual removal of water vapor is based on an empirical equation of ETo. For that
reason, the research presented in this thesis uses the estimated ETafrom the STSEB model to improve
the actual water balance and to obtain a better spatial resolution (500 m, MODerate-resolution Imaging Spectroradiometer, MODIS) for SMD estimation. This approach, its application, and the obtained results are given in Chapter 5.
CHAPTER
2
Objectives and structure
This work is at the interface between water use and forest fire management, where traditional methods from hydrology science are applied to the science of forestry to studying the impact of wildfires on the hydrological water balance. Water relationships before and after fire outbreaks were investigated, concentrating on the ETaestimated from remote sensing.
The research topic was divided into three main objectives:
i testing the agreement between measured and estimated ETaand its contributing parts of
transpira-tion and evaporatranspira-tion from the STSEB model;
ii analyzing the quantitative changes of the energy balance fluxes, and therefore daily ETa after
wild-fires; and
iii identifying areas with higher proneness to fire, by the incorporation of estimated ETainto drought
indices.
Each objective of this list was dealt with in a research paper and published (or submitted) to Scopus indexed international journals, and are covered in chapters 3–5.
Chapter 3 describes the first study, where the STSEB model was tested for partitioning ETa into
transpiration and evaporation. For this work, the model was implemented in Python code (according to Sánchez et al., 2008b) and extended by the evaporative fraction method described by Gentine et al. (2007) to obtain daily values. The model’s outputs were compared to field measurements of ETa, transpiration
and evaporation, respectively. To improve daily estimates the β-factor correction by Van Niel et al. (2011) was implemented.
In Chapter 4, the STSEB model was applied to burnt eucalypt forests at the Caramulo mountain range between Aveiro and Viseu. Fire-driven changes of the surface energy fluxes were investigated by comparing burnt areas with close-by unburnt tree stands. Hereby, the burnt areas were classified into their burn severity, resulting in information about changes in ETa and the partitioning of transpiration and
evaporation after fire events.
Chapter 5 explores the use of the estimated ETa from STSEB for fire danger rating. For this reason
drought indices based on the water balance equation were modified by substituting the empirical equations for evapotranspiration with ETafrom STSEB. A classifier was introduced to identify the minimum area
prone to fire by including the maximum fire-affected regions. The basal crop coefficient (Kcb) and the
adjusted crop coefficient (Kc,adj) approach to estimate ETafor days with no satellite observations were
applied.
Chapter 6 gives a general conclusion of the results and illustrates perspectives for follow-up projects. Further methods and results, which have not been described or published yet, are included as supple-mental material.
CHAPTER
3
Estimation and partitioning of actual daily evapotranspiration at an intensive olive grove using a simplified two-source energy balance model, (Article I)
This paper describes the testing of the STSEB model in terms of estimating the components of ETa,
(i.e. transpiration and evaporation). For this reason, data from a long-term study at an olive grove was exploited, due to familiarity with the study site, and the associated data collection. Beta-factor corrections according to Van Niel et al. (2011) improved the model for ETa estimations.
This chapter was originally published in Agricultural Water Management, 31 March 2018, c Elsevier B.V., available online:
https://doi.org/10.1016/j.agwat.2018.01.027. The journal was rated with an impact factor of 3.182 and a 5-year impact factor of 3.565 in September 2018.
Melanie Häusler, Nuno Conceição, Luca Tezza, Juan M. Sánchez, Manuel L. Campagnolo, Andreas J. Häusler, João M. N. Silva, Thorsten Warneke, Georg Heygster, and
Contents lists available atScienceDirect
Agricultural Water Management
journal homepage:www.elsevier.com/locate/agwatEstimation and partitioning of actual daily evapotranspiration at an
intensive olive grove using the STSEB model based on remote sensing
Melanie Häuslera,⁎, Nuno Conceiçãoc, Luca Tezzad, Juan M. Sáncheze, Manuel L. Campagnoloa,b, Andreas J. Häuslerf, João M.N. Silvaa, Thorsten Warnekeg, Georg Heygsterg, M. Isabel Ferreirab,c
aForest Research Centre, School of Agriculture, University of Lisbon, Tapada da Ajuda, 1349-017 Lisbon, Portugal
bDCEB, Departamento de Ciências e Engenharia de Biossistemas, Instituto Superior de Agronomia, Universidade de Lisboa, Tapada da Ajuda, 1349-017 Lisboa, Portugal cLEAF, Linking Landscape, Environment, Agriculture and Food, Instituto Superior de Agronomia, Universidade de Lisboa, Tapada da Ajuda, 1349-017 Lisboa, Portugal dCIRVE, Interdepartmental Centre for Research in Viticulture and Enology, University of Padova, 31015 Conegliano, TV, Italy
eIDR, Regional Development Institute, Applied Physics Department, University of Castilla-La Mancha, 02071 Albacete, Spain fSalt and Pepper Technology GmbH & Co. KG, Bremen, Germany
gInstitute of Environmental Physics, University of Bremen, 28359 Bremen, Germany
A R T I C L E I N F O Keywords:
Landsat Evaporation Transpiration
Evaporative fraction method
A B S T R A C T
This study is based on the application of an existing simplified two-source energy balance (STSEB) model, using medium-resolution satellite imagery (Landsat) to estimate instantaneous (at the satellite overpass time) and daily actual crop evapotranspiration (ETa) over an intensive olive grove. Daily values were obtained by the use of
the evaporative fraction method and corrected for latent heat, available energy, and evaporative fraction biases (beta-factor correction). Model estimates were compared to ground-based measurements. Heatflux densities (eddy covariance method) were recorded, andfive Landsat images at approximately monthly intervals were used, covering our study site in 2011. Comparison with ground measurements showed a maximum difference of −0.6 mm day−1before, and 0.2 mm day−1after beta-factor correction for the main plot.
The experimental site consisted of a main plot exposed to deficit irrigation, and two small subplots where—during a limited period of time (six weeks)—one was temporarily not irrigated, and the other well-irrigated for reference. One Landsat image was available for this limited period of time.
Additionally, the STSEB algorithm was tested for partitioning evapotranspiration into its evaporation and transpiration components. Evaporation estimated from the STSEB model was compared with evaporation esti-mated from a model adjusted from local lysimeter measurements. Transpiration data obtained from calibrated sapflow measurements were, after local calibration, also compared to model estimates. Model results agreed with the measured data, showing) under- and overestimation for transpiration and evaporation, respectively.
1. Introduction
Over the last decade, more and more traditional olive orchards (< 100 trees ha−1) have been replaced by intensive to super-intensive ones (> 2000 trees ha−1), especially in the South of Portugal with Mediterranean climate conditions. This development demands im-proved water management and optimised irrigation practices in terms of quantifying olive water requirements. This study aims to estimate actual evapotranspiration (ETa) and its contributing parts of canopy transpiration (LEv) and soil water evaporation (LEs), as the latter is often seen as water loss for irrigated crops. An existing simplified two-source energy balance model (STSEB) based onNorman et al. (1995) and further simplified by Sánchez et al. (2008b) has been, in
combination with satellite imagery, tested for separately estimating LEs and LEvon a daily basis.
To estimate the amount of water transferred to the atmosphere from different crops, various estimation approaches have been developed, in general using implicitly (or explicitly) the leaf surface conductance (bulk stomatal and leaf boundary layer). Due to the difficulty in ob-taining this variable for every crop in any water status condition, simple semi-empirical models have been used to calculate ETafor decades. The principle is based on the reference evapotranspiration (ET0) estimated from on-site collected meteorological data, which then is multiplied by a crop coefficient, obtaining ETm(kc= ETm/ET0) andfinally by a stress coefficient (ks=ETa/ETm). In a well-known group of guidelines (FAO Irrigation and Drainage Paper 56), Allen et al. (1998) proposed
https://doi.org/10.1016/j.agwat.2018.01.027
Received 24 March 2017; Received in revised form 24 January 2018; Accepted 29 January 2018
⁎Corresponding author.
E-mail address:[email protected](M. Häusler).
Agricultural Water Management 201 (2018) 188–198
0378-3774/ © 2018 Elsevier B.V. All rights reserved.
estimating ET0based on the Penman-Montheith equation, which in-corporates aerodynamic and physiological parameters of a previously defined reference grass to retrieve kcand kscoefficients.
An alternative approach to obtain ETaand its contributing parts, LEv and LEs, was adopted from the energy balance equation (Eq.(A.1)). A distinction is drawn between one- and two-source models, to account for the different heat transfers from the soil surface and the plant ca-nopy. One-source models assume one surface temperature and aero-dynamic resistance for the zone of soil and vegetation cover while the two-source models identify soil and vegetation layers as separate sources of heatflux.
To date, many studies have been carried out over annual crops or uniform land covers (Tasumi et al., 2005; Agam et al., 2010; Hoffmann et al., 2016; Timmermans et al., 2007), and many studies have dealt with heterogeneous ground cover (Bastiaanssen et al., 1998; Colaizzi et al., 2016; Roerink et al., 2000), and only recently with tree crops (e.g. olive orchards;Cammalleri et al., 2012; Pôças et al., 2014; Ortega-Farías and López-Olivari, 2012).
Due to the accessibility of satellite data, remote sensing based es-timations of ETa(Sun et al., 2012; Peng et al., 2012; Minacapilli et al., 2016), combined with energy balance models (Du et al., 2013; Ruhoff et al., 2013), became more and more attractive, especially because only a few additional meteorological variables (e.g., air temperature, wind speed, global solar radiation) are needed, being regularly measured at meteorological stations. Yang et al. (2015a) made a comparison be-tween three two-source remote sensing evapotranspiration models, where two of them were two-source energy balance models (TSEB) and the third was the MOD16 ETa algorithm (algorithm according to Norman et al., 1995andNishida et al., 2003b,a). Results showed that MOD16 failed to reproduce spatial ETapatterns over particularly dry environments, while the TSEB model was in agreement with the ETa measurements.
Generally, TSEB models give reasonable results for ETa, and are used for separately estimating LEvand LEs, which, based on remote sensing has not been tested yet, to its full extent. One reason might be that TSEB models tend to overestimate LEsand underestimate LEv(Colaizzi et al., 2014, 2016). Here, the STSEB model gives the opportunity to operate on a larger scale (e.g.field-scale), due to relatively few input variables, the use of standard meteorological data, and satellite imagery. Daily values of ETa, LEv, and LEs were estimated using the Evaporative Fraction (EF) constant method. Correction factors (beta-factors), ac-cording toVan Niel et al. (2011), were tested to improve model esti-mations.
On this background, the objectives of this study were to:
i estimate instantaneous ETain discontinuous vegetation e.g., for an olive grove;
ii detect significant reductions in evapotranspiration due to the water status of the trees;
iii test the performance of the model for partitioning evapotranspira-tion into its contributing parts (transpiraevapotranspira-tion and evaporaevapotranspira-tion); and iv evaluate the overall ground cover dynamics (effect of canopies and
inter-row soil cover) affecting the use of satellite imagery. On-site measurements of total ETa, obtained with the eddy covar-iance (EC) method, and its contributing parts (LEs and LEv) were compared to the model estimates. Consequently, the sections high-lighting the results of the research at hand, as well as the discussion of these results, are split in accordance with the aforementioned objec-tives.
2. Materials and methods
A detailed description of the experimental set-up, instrumentation and their specifications are given inConceição et al. (2017).
2.1. Study site
This work is based on data obtained in an intensive olive grove in the southeast of Portugal, located in the region of Alentejo in 2011 (latitude: 38°1′15.90″ N, longitude: 8°10′44.50″ W, Datum WGS84, 97 m above sea level). In September 2004, a 10-ha olive grove (cv. Arbequina) with a tree spacing of 4.8 m, and a row spacing of 7 m was installed, where a continuous area of 434-ha was selected for taking measurements.
In 2010, the average height of the trees was 3.2 m, the average canopy projected area was 5.7 m2, and the average leaf area index on a total area basis was 1.01 m2 m−2. Further biometric measurements were taken and are described inHäusler et al. (2014).
The climate in the region of Alentejo is temperate and is one of the Mediterranean types, Csa, characterized by mild and wet winters and very hot and dry summers (Köppen Geiger Classification Rubel and Kottek, 2010). The average annual rainfall is about 580 mm, with around 5% falling during summer time (http://www.ipma.pt/). The soil was classified as Luvisol (Food and Agriculture Organization of the United Nations (FAO), 2006) with a ApBtC profile.
The total olive orchard, with the exception of two subplots, during a limited stress period, was deficit-irrigated. Each tree row had a line of drippers spaced 0.75 m apart. The nominalflow for the deficit irrigation was 1.6 L h−1, which corresponds to an irrigationflux density of 0.31 mm h−1. During 2011 the deficit irrigation operated from 15 June to 26 September (103 days) with an average irrigation depth of 1.4 mm day−1.
During six weeks, two subplots received different treatments. One received no water at all (Subplot 2) and the other was well-irrigated (Subplot 3; see also Section2.2.3andConceição et al., 2017). Pre-dawn leaf water potential served to monitor and define the plant water status. According to Fernandes-Silva (2008) plants are in comfort between −0.4 MPa and −0.7 MPa. The observed values for the well-irrigated Subplot 3 were never below−0.5 MPa (Conceição et al., 2017). Trees with a pre-dawn leaf water potential of down to −0.5 MPa were therefore defined as being in comfort. Values below this point indicated water-stressed olive trees.
2.2. On-site measurements
2.2.1. Measurement of energy heatfluxes at the main plot
The installation of EC sensors allowed the measurement of theflux densities of latent heatflux density LE and sensible heat flux density H with a three-dimensional sonic anemometer and a krypton hygrometer (CSAT3-D and KH20, respectively, Campbell Scientific, USA), which were mounted on a metallic tower at the height of 4.5 m above ground and oriented into the dominant wind direction (Fig. 1). Rawfluxes (H and LE) were recorded by a data logger (CR10X, Campbell Scientific, USA), and 30 min averages were stored. Corrections for air density variations (WPL-correction,Webb et al., 1980), and oxygen cross sen-sitivity for krypton hygrometers (because of oxygen absorption,Tanner et al., 1993) were performed.
The net radiation Rnwas measured with net radiometers (NR2 and NRlite, Kipp & Zonen, Netherlands) and the soil heatflux density G was recorded, using six heatflux plates (heat flux sensors HFP01 and HFT-3.1 manufactured by Hukseflux and Radiation and Energy Balance Systems, respectively) with known thermal conductivity. The heatflux plates were buried in the ground at a depth of 0.05 m, perpendicular to theflow direction. To quantify the heat stored in the soil layer between 0 and 0.05 m, copper-constantan thermocouples were used at 0.025 m soil depth (1/30 Hz, 10 min average). Further information about equipment and data processing, are described in Conceição et al. (2017).
A simplified footprint analysis (Schuepp et al., 1990) allowed the evaluation of the relative contribution offluxes coming from different areas within the plot to the total measuredflux. More than 85% of the
M. Häusler et al. Agricultural Water Management 201 (2018) 188–198
measured LE came from an upwind area less than 140 m away from the measurements’ point. LE and H fluxes were selected according to the wind direction, taking into consideration the outputs from the footprint analysis (Conceição et al., 2017) in relation to the fetch for each di-rection.
2.2.2. Transpiration and soil evaporation at the main plot
Using the thermal dissipation method (Granier, 1985), the sapflow was recorded for seven trees in the main plot. Measurements were taken every 60 s and averaged every 30 min by a data logger (CR3000, Campbell Scientific, USA; for details see alsoConceição et al., 2017).
Measurements of LEswith micro-lysimeters were taken. In total, ten lysimeters were installed. Here, six of them were along the tree line with a spacing of 0.75 m and another four near the line, where two of which were in the shade of the crown and two exposed to the sun (Tezza, 2014). The lysimeter measurements were used to model LEsfor the days were no measurements were taken, using locally adjusted model parameters, as described inTezza (2014)andConceição et al. (2017). By subtracting LEs (micro-lysimeters or model) from ETa, measured at the EC tower, LEvwas obtained. Subsequently, LEvwas compared with average sapflow data in order to correct it, obtaining a time-series for LEvof the main plot under deficit irrigation where also total LE was measured. Afterwards, it was possible to infer LEvfor the small Subplots 2 and 3, in the way explained in the following section. 2.2.3. Transpiration of the two subplots
For the duration of a stress period (3 August to 15 September, 2011) the experimental site had additionally two small subplots outside the footprint area of the main plot (Fig. 1). In each of the two subplots, sap flow measurements for six trees were taken, also using the thermal dissipation method as described by Granier (1985). Subplots 2 (38°1′13.99″ N, 8°10′42.68″ W) and 3 (38°1′11.81″ N, 8°10′41.12″ W) were equipped with independent irrigation systems, and a stress period was temporarily induced from 3 August (Day of the Year = DoY, 215) until 15 September (258), 2011 in Subplot 2.
Only during the stress period of six weeks, Subplot 2 remained non-irrigated, while Subplot 3 was kept well-irrigated for reference, (pre-dawn leaf water potential above−0.5 MPa). This experimental lay-out was used to analyse the impact of water shortage on water stress in-dicators and waterfluxes (Ferreira et al., 2012a). Before the beginning of the stress period, all plots had reached maximum water status
(comfort, >−0.5 MPa of pre-dawn leaf water potential). The main plot (1) continued to be deficit-irrigated (approximately 1.4 mm day−1).
The value of LEvfor the well-irrigated Subplot 3 was obtained by dividing LEvof the main plot by the stress coefficient of the main plot (LEv,3= LEv,1÷ ks,1), which takes into account the LEvreduction in the main plot, being deficit-irrigated. This factor (ks= 0.88) was retrieved from the relationship between pre-dawn leaf water potential and ksor relative LEvobtained during the stress period, (Ferreira et al., 2012b; Conceição et al., 2017), by using the values measured in all subplots for the day of satellite overpass during this stress cycle. The same principle was applied to LEvfor the highly stressed Subplot 2 (day of satellite of overpass on DoY 255, 2011) by using the measured relative LEvof this plot (i.e., ks= 0.77, being LEvof stressed Subplot 2 = LEvof the well irrigated Subplot 3 multiplied by 0.77, because LEv,2= LEv,3× ks,2).
Five cloud-free Landsat 5 Thematic Mapper (L5-TM) images were selected in approximately monthly intervals from May until October 2011, including one image during the stress period. The sensor aboard Landsat 5 has a medium spatial resolution (30 m in visible and near-infrared bands, and 120 m in the thermal band), and offers a detailed observation of the Earth's surface. The Level 1 product of surface re-flectance data (Level 1 product, Bands 1-5 and 7, atmospherically corrected by Landsat Ecosystem Disturbance Adaptive Processing System, LEDAPS), and the brightness temperature (Band 6), provided by the U.S. Geological Survey Earth Resources Observation and Science (EROS) Data Center (http://earthexplorer.usgs.gov/) were down-loaded, and further processed.
For the estimates of the main plot a square of 3 × 3 pixels within the footprint area was extracted and averaged, while for the Subplots 2 and 3 central coordinates were used to extract the corresponding pixels in the images to compare with ground observations. The subplots them-selves covered only around 941 m2(28 trees), corresponding to the 30 × 30 m pixel size of the visible band of Landsat. We have tested two approaches– averaging over the overlapping pixels or using just the closest pixel to the center of each subplot– and since the latter lead to better estimates we have used it in our calculations, knowing that the tree-lines were rather uniform.
Landsat-derived albedo (α), land surface temperature (Trad) and Normalized Difference Vegetation Index (NDVI, see Section3.4) were plotted against ETafor 15 observation days along the year 2011. The time pattern of those variables was compared to verify that the input data for the STSEB model were in line with the annual distribution of
Fig. 1. Image (a) shows a seven-year old intensive olive grove (cv. Arbequina) with a tree spacing of 7 × 4.8 m. The location of the experimental site is marked by a red square in the map of Portugal (left corner, Köppen-Geiger Classification) Web references [1]. Image (b) gives an overview of the total test site with its numbered subplots (extracted pixels, 30 m, white squares) and the location of the eddy covariance tower (main plot). The main wind direction is illustrated by white dashed arrows. Web references [2]. (For interpretation of the references to color in thisfigure legend, the reader is referred to the web version of this article.)
M. Häusler et al. Agricultural Water Management 201 (2018) 188–198