Contents lists available atScienceDirect
Toxicology and Applied Pharmacology
journal homepage:www.elsevier.com/locate/taapMetabolic dynamics of human Sertoli cells are di
fferentially modulated by
physiological and pharmacological concentrations of GLP-1
Ana D. Martins
a,b, Mariana P. Monteiro
b,c, Branca M. Silva
d, Alberto Barros
e,f,g, Mário Sousa
a,b,e,
Rui A. Carvalho
h, Pedro F. Oliveira
a,b,g, Marco G. Alves
a,b,⁎aDepartment of Microscopy, Laboratory of Cell Biology, Abel Salazar Institute of Biomedical Sciences (ICBAS), University of Porto, Porto, Portugal bUnit for Multidisciplinary Research in Biomedicine, Abel Salazar Institute of Biomedical Sciences (UMIB-ICBAS), University of Porto, Porto, Portugal cDepartment of Anatomy, Abel Salazar Institute of Biomedical Sciences, ICBAS, University of Porto, Porto, Portugal
dFaculty of Health Sciences, University of Beira Interior, Covilhã, Portugal eCentre for Reproductive Genetics Professor Alberto Barros, Porto, Portugal fDepartment of Genetics, Faculty of Medicine, University of Porto, Porto, Portugal gi3S - Instituto de Investigação e Inovação em Saúde, Universidade do Porto, Porto, Portugal
hDepartment of Life Sciences, Faculty of Sciences and Technology and Centre for Functional Ecology, University of Coimbra, Coimbra, Portugal
A R T I C L E I N F O
Keywords:
Glucagon like peptide-1 (GLP-1) Mammalian target of rapamycin (mTOR) Metabolism
Obesity Sertoli Cells Spermatogenesis
A B S T R A C T
Obesity incidence has pandemic proportions and is expected to increase even further. Glucagon-like peptide-1 (GLP-1) based therapies are well-established pharmacological resources for obesity treatment. GLP-1 regulates energy and glucose homeostasis, which are also crucial for spermatogenesis. Herein, we studied the GLP-1 effects in human Sertoli cells (hSCs) metabolism and mitochondrial function. hSCs were cultured in absence or exposed to increasing doses of GLP-1 mimicking physiological post-prandial (0.01 nM) levels or equivalent to pharma-cological levels (1 and 100 nM) used for obesity treatment. We identified GLP-1 receptor in hSCs. Consumption/ production of extracellular metabolites were assessed, as well as protein levels or activities of glycolysis-related enzymes and transporters. Mitochondrial membrane potential and oxidative damage were evaluated. Glucose consumption decreased, while lactate production increased in hSCs exposed to 0.01 and 1 nM GLP-1. Though lactate dehydrogenase (LDH) protein decreased after exposure to 100 nM GLP-1 its activity increased in hSCs exposed to the same concentration of GLP-1. Mitochondrial membrane potential decreased in hSCs exposed to 100 nM of GLP-1, while formation of carbonyl groups was decreased in those cells. Those effects were followed by an increase in p-mammalian target of rapamycin (mTOR) Ser(2448). Overall, the lowest concentrations of GLP-1 increased the efficiency of glucose conversion to lactate, while GLP-1 concentration of 100 nM induces mTOR phosphorylation, decreases mitochondrial membrane potential and oxidative damage. GLP-1 regulates testicular energy homeostasis and pharmacological use of GLP-1 analogues could be valuable to counteract the negative impact of obesity in male reproductive function.
1. Introduction
Obesity has emerged as a major healthcare problem increasing the risk of cardiovascular diseases and decreases lifespan (Fontaine et al., 2003). Reduced fertility is a silent obesity-related complication, which among other co-morbidities is becoming a matter of concern (Alves
et al., 2016). Dysregulation in the hormonal control of energy home-ostasis promoted by the balance between food intake and energy ex-penditure has been hypothesized to interfere not only in body meta-bolism, but also with fertility though the underlying mechanisms remain unknown.
Glucagon like peptide-1 (GLP-1) is a 29-amino acid amidated
https://doi.org/10.1016/j.taap.2018.10.009
Received 9 March 2018; Received in revised form 1 October 2018; Accepted 5 October 2018
Abbreviations: 4-HNE, 4-Hydroxynonenal;β2M, β-2-Microglobulin; β2Mnc, nuclear encodedβ-2-Microglobulin; DNP1, Dinitrophenol; DPP4, Dipeptidyl peptidase; GLP-1, Glucagon like peptide-1; GLP-1R, Glucagon like peptide-1 receptor; GLUT, Glucose transporter; hSCs, Human Sertoli cells; LDH, Lactate dehydrogenase; MCTs, Monocarboxylate transporters; mTOR, Mammalian target of rapamycin; mTORC1, Mammalian target of rapamycin complex 1; NMR, Nuclear Magnetic Resonance; NT, Nitro-tyrosine; RNAt, Total RNA; RT-PCR, Reverse Transcriptase Polymerase Chain Reaction; SCs, Sertoli cells; SRB, Sulforhodamine B
⁎Corresponding author at: Abel Salazar Institute of Biomedical Sciences (ICBAS) - University of Porto, Rua de Jorge Viterbo Ferreira n° 228, 4050-313 Porto, Portugal.
E-mail address:[email protected](M.G. Alves).
Available online 06 October 2018
0041-008X/ © 2018 Elsevier Inc. All rights reserved.
peptide hormone, produced by posttranslational cleavage of the pro-glucagon precursor protein (Bell et al., 1983). This peptide is mainly produced by intestinal L-cells and secreted post-prandially (Guedes et al., 2015). GLP-1 is known for its role in glucose homeostasis pre-dominantly mediated by the incretin effect. It potentiates insulin se-cretion after oral glucose ingestion, as compared to intra-venous glu-cose administration. GLP-1 also acts in the central nervous system to reduce the appetite and delays gastric emptying. Glucose equilibrium is crucial for energy homeostasis and the proper functioning of physio-logical functions, including male fertility. However, due to in vivo fast-proteolytic digestion mainly by dipeptidyl peptidase 4 (DPP4) and renal clearance, GLP-1 has a short half-life (Ruiz-Grande et al., 1993) that limits the use of the native peptide for pharmacological purposes. Thus, several GLP-1 analogues are available, being options for treatment of diabetes and obesity, as these promote weight loss, while having a low risk of causing hypoglycaemia (Crane and McGowan, 2016).
GLP-1 exerts its activity via GLP-1 receptor (GLP-1R), which belongs to a G-protein coupled receptor family (Bullock et al., 1996). GLP-1R expression within the male reproductive system has been detected in mice Sertoli cells (SCs) (Zhang et al., 2015), evidencing that GLP-1 should have an impact on male fertility. In fact, GLP-1R knockout mice have reduced seminal vesicle and gonadal weighs, despite depicting normal testicular sex steroids levels and retaining fertility (MacLusky et al., 2000).
While it is known that GLP-1 and its analogues are key regulators of metabolism, the molecular means which by they impact cell metabo-lism, remain unknown. It has been postulated that mitochondria are the main metabolic targets for this hormone (for reviewAlves et al., 2016). For instance, GLP-1 improves mitochondrial membrane potential (Ogata et al., 2014) and also mitochondrial mass in a pancreatic cell line (Kang et al., 2015). Indeed, both GLP-1 analogues and DPP4 in-hibitors, which increase endogenous GLP-1 levels by preventing its degradation, modulate mitochondrial structure and functioning (for review Ranganath, 2008). These metabolic processes depend on sig-nalling pathways network. The mammalian target of rapamycin (mTOR) kinase emerged as pivotal for these processes (for review Oliveira et al., 2017), controlling mitochondrial bioenergetics and glucose metabolism. GLP-1 interferes with mTOR pathway (Park et al., 2015) and recently it was suggested that mTOR has an essential role in male reproduction (Jesus et al., 2017). In addition, mTOR controls glucose consumption and redox balance of human SCs (hSCs) (Jesus et al., 2016). The SCs are responsible for the nutritional support of spermatogenesis and the major hormonal target inside the testis (Martins et al., 2015;Martins et al., 2016). Herein, we studied the GLP-1 effects on hSCs metabolism and mitochondrial function. We hy-pothesized that GLP-1 could interfere in hSC function with potential implications for the nutritional support of spermatogenesis.
2. Methods 2.1. Chemicals
All chemicals were obtained from Sigma-Aldrich (St. Louis, MO, USA) unless specified otherwise.
2.2. Patient's selection and testicular tissue preparation
Testicular tissue was obtained from testicular biopsies (n = 6) per-formed to men with conserved spermatogenesis, suffering from aneja-culation due to previous vasectomy or traumatic section of the vas deferens, with the ultimate aim of recovering gametes for medically assisted procreation. After informed written consent, hSCs were isolated from the testicular tissue left in culture plate once gamete retrieval was completed. Testicular biopsies and handling of testicular tissue was done at the Centre for Reproductive Genetics Professor Alberto Barros (Porto, Portugal) in accordance with the Guidelines of Local, National
and European Ethical Committees and performed in agreement with the Declaration of Helsinki.
2.3. Sertoli cells culture
Human SCs were isolated following the protocol optimized by Oliveira and collaborators (Oliveira et al., 2009). Anti-Mullerian hor-mone and vimentin, were used, as specific protein markers, to assess the purity of the hSCs cultures (Steger et al., 1996). Only cultures with a purity above 95% were used, SC cultures purity was determined by phase contrast microscopy using an ExtrAvidin Peroxidase Staining Kit. To establish the various experimental groups, cells were washed with PBS, and placed in culture serum-free medium (DMEM: Ham's F12, pH 7.4) with insulin-transferrin‑sodium selenite medium (final con-centration of 10 mg/L; 5.5 mg/L; 6.7μg/L, respectively) to which GLP-1 (Bachem AG, Bubendorf, Switzerland) was added (or not). One group of cells was not exposed to GLP-1 (0 nM) (no GLP-1) and three other groups were treated with increasing concentrations of GLP-1 (0.01, 1 and 100 nM). The concentration of 0.01 nM was chosen taking into consideration the postprandial GLP-1 levels found in healthy in-dividuals (Vilsboll et al., 2001;Balestrieri et al., 2015). The other GLP-1 concentrations were chosen to mimic the highest plasmatic con-centrations attained after administration of a GLP-1 analogue at the maximum therapeutic dosage recommended for obese individuals (3 mg/daily for liraglutide) either after a single administration (1 nM) or at steady state after a daily administration for 5 weeks (100 nM) (Elbrond et al., 2002;Jiang et al., 2011;Danne et al., 2017).
After 6 h of treatment, cell culture medium was also collected. Afterwards, the cells were washed and exposed to GLP-1 for 6 h. We chose this time period for the exposure of cells to GLP-1 based on GLP-1 half-life (Ruiz-Grande et al., 1993). The cells were then washed with PBS and detached using a Trypsin-EDTA solution (0.05% / 0.02% (w/ v)), counted using a Neubauer chamber and collected for protein, DNA and RNA extraction. Only groups with viability averaging 85–90%, evaluated by Trypan Blue Exclusion test, were considered for analysis. 2.4. RNA and DNA extraction
Total RNA (RNAt) was extracted using the E.Z.N.A.® RNAt com-mercial Kit (Omega Bio-Tek, Norcross, USA) and DNA was extracted using the E.Z.N.A.® Tissue DNA Kit Commercial Kit (Omega Bio-Tek, Norcross, USA), as indicated by the manufacturer. The amount of DNA and RNA was determinated using a NanoDrop 1000 Spectrophotometer (Thermo Fisher Scientific, Wilmington, USA). The 260/280 nm of the samples were used to assess the purity of DNA and RNA. DNA presented a ratio of ≈1.8 and RNA presented a ratio of ≈2 in the extracted samples. To assess the integrity of RNA and DNA, an aliquot of each sample was run on a denaturing agarose gel stained with GreenSafe (NZYTech, Lisboa, Portugal).
2.5. cDNA synthesis and Reverse Transcriptase Polymerase Chain Reaction (RT-PCR)
RNAt was reversely transcribed as previously described (Martins et al., 2015). The resultant cDNA was used with exon-exon spanning primer sets designed to amplify specific cDNA fragments (Table 1). PCR was performed with a primer's optimal annealing temperature, using standard methods (Martins et al., 2015) (Table 1). The samples were visualized using the software Image Lab (BioRad, Hercules, CA, USA) coupled to an image acquisition system BioRad FX-Pro-plus (BioRad, Hemel Hempstead, UK). The product size was compared to a DNA ladder (NZYTech, Lisboa, Portugal). Human heart and human liver RNAt (AMS Biotechnology, Abingdon, UK) were used as positive con-trol and cDNA-free sample was used as negative concon-trol.
The mRNA expression levels of GLP-1R were evaluated in the dif-ferent experimental groups. qPCR experiments were carried out in
triplicate, in a CFX 96 qPCR setup (BioRad, Hercules, CA, USA). The efficiency of the amplification for all primers sets was determined by using serial dilutions of cDNA (Martins et al., 2015). Amplification conditions were followed as previously described (Martins et al., 2016). β-2-microglobulin (β2M) transcript levels were used to normalize the mRNA expression of the target genes. The target genes, sequences and annealing temperatures of the primers are described inTable 1. Fol-lowing the mathematical model proposed by Pfaffl in the formula: 2−ΔCt, the fold variation the target gene expression was calculated. 2.6. Determination of mtDNA copy number
A qPCR analysis was performed to study the mtDNA copy number as described (Fuke et al., 2011) with small modifications. The efficiency of the amplification was determined by serial dilutions of DNA, and the amplification conditions used were as previously described (Alves et al., 2014). The reaction mixture consisted in NZY qPCR Mix (NZYTech, Lisboa, Portugal), primers (Table 1) and 20 ng of mtDNA. Each reaction was carried out in an CFX 96 (Biorad, Hercules, USA). Ctvalue differ-ences between NADH dehydrogenase subunit 1 (ND1) gene and nuclear encoded beta-2-microglobulin (β2Mnc) gene were used to quantify mtDNA copy number relative with the following model proposed by Pfaffl: 2-ΔCt
.
2.7. Cytotoxicity assay
A sulforhodamine B (SRB) colorimetric assay was performed to test the cytotoxicity of GLP-1 to hSCs (Skehan et al., 1990). The cells were seed and treated with the selected concentrations of GLP-1. After 6 h, the assay was performed as previously described (Martins et al., 2015). No cytotoxicity was observed for the GLP-1 concentrations used (data not shown).
2.8. Western blot
Total proteins isolated from hSCs were extracted using the M-PER Mammalian Protein Extraction Reagent (Thermo Scientific, Rockford, USA). Western blot was performed as previously described (Alves et al., 2014). The membranes were incubated overnight at 4 °C with primary and secondary antibodies (Table 2). Mouseβ-tubulin was used as pro-tein loading control. ECF detection system was used and the membranes were read in the BioRad FX-Pro-plus (BioRad, Hemel Hempstead, UK). The densities from each band were quantified according to standard methods using Image Lab (BioRad, Hemel Hempstead, UK). Whenever possible the membranes were stripped with Restore Western Blot Stripping Buffer (Thermo Scientific, Rockford, USA) following the manufacturer's instructions, blocked and marked with other primary and consequently secondary antibody.
2.9. Lactate dehydrogenase (LDH) activity
The commercial Pierce LDH Kit (Thermo Scientific, Rockford, USA) was used to measure LDH activity. The obtained values of activity were calculated using the molar absorptivity of formazan (ε = 19,900 M−1.cm−1).
2.10. Measurement of oxidative damage
The oxidative damage to proteins and lipids was evaluated by Slot-blot. We determined the protein carbonyl, nitro-tyrosine (NT) and 4-hydroxynonenal (4-HNE) group levels as previously described (Martins et al., 2015). The membranes were incubated with primary and sec-ondary antibodies (Table 2). ECF detection system was used, the membranes were read in the BioRad FX-Pro-plus and the densities from each band were quantified using Image Lab (BioRad, Hemel Hemp-stead, UK).
2.11. Glutathione content assay
Glutathione content of cells exposed to GLP-1 was performed using the commercial kit to quantify total, oxidized and reduced glutathione contents (Enzo Life Sciences, Lausen, Switzerland), according to the manufactory instructions.
2.12. Mitochondrial membrane potential
The cation JC-1 dye (Molecular Probes, Eugene, OR, USA) was used to evaluate mitochondrial membrane potential. Cells were exposed to the chosen concentrations of GLP-1 for 6 h and mitochondrial mem-brane potential determined as previously described (Martins et al., 2016). Fluorescent intensity was measured using a Cytation 3 Imaging Reader (BioTek Instruments, Winooski, USA). The ratio of the fluor-escent intensity of JC-1 aggregates to monomers was used as an in-dicator of mitochondria membrane potential.
2.13. Nuclear magnetic resonance (NMR) spectroscopy
The concentration of extracellular media metabolites was de-termined by1H NMR spectroscopy, as previously described (Alves et al., 2011). For internal reference we used sodium fumarate (singlet at 6.50 ppm) to quantify the following metabolites (multiplet, ppm): H1-α-glucose (doublet, 5.22), lactate (doublet, 1.33), pyruvate (singlet, 1.35), alanine (doublet, 1.45), acetate (singlet, 1.90). The spectral analysis was done offline using the NUTSpro™ NMR (Acorn, Fremont, USA) to quantify the relative areas of1H NMR resonances by a curve-fitting routine.
2.14. Statistical analysis
Statistical significance was assessed by one-way ANOVA. All results were performed in triplicate and data are shown as mean ± SEM (n = 6 for each condition). Statistical analysis was performed using GraphPad Prism 6 (GraphPad Software, San Diego, CA, USA). P < .05 was considered significant.
3. Results
3.1. GLP-1 receptor is expressed in hSCs
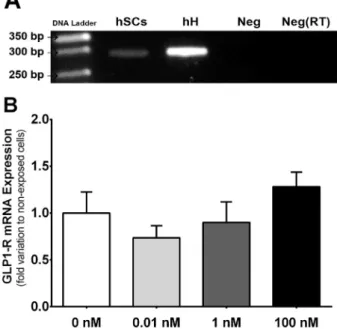
GLP-1R was previously identified in the mice testis, only by im-munohistochemistry (Zhang et al., 2015). We investigated the presence of GLP-1R in hSCs and detected a 300 bp amplicon, corresponding to the presence of GLP-1R mRNA (Fig.1A). Our results also show that, when exposed to the different concentrations of GLP-1, hSCs do not present alteration in the transcript levels of GLP-1R (Fig. 1B). Table 1
Primers used in this study
Gene Primer sequence (5′-3′) AT(°C) Amplicon size (bp) GLP-1R Sense: GCTCTCCTTCACCTCCTTCC 58 300 Anti-Sense: TGTCTCTCCCACCTGGATTG ND1 Sense: CGATTCCGCTACGACCAACT 60 121 Anti-Sense: AGGTTTGAGGGGGAATGCTG β2M Sense: ATGAGTATGCCTGCCGTGTG 60 150 Anti-sense: CAAACCTCCATGATGCTGCTTAC β2Mnc Sense: GAGGCTATCCAGCGTGAGTC 60 306 Anti-sense: GACGCTTATCGACGCCCTAA
Abbreviations: β2M: Beta-2-Microglobulin; β2Mnc: nuclear encoded beta-2-microglobulin; GLP-1R: Glucagon like peptide-1 receptor; ND1: NADH dehy-drogenase, subunit 1.
3.2. Glucose consumption is decreased in hSCs exposed to GLP-1 Glucose is essential for SCs metabolism and spermatogenesis. This metabolite enters SCs mostly through glucose transporters (GLUTs), GLUT1–3 (Martins et al., 2015;Martins et al., 2016). After treatment with GLP-1, no alterations were detected in the protein levels of those GLUTs in hSCs (Supplementary Fig. 1A to C). Nevertheless, when hSCs were exposed to 0.01 and 1 nM of GLP-1, glucose consumption de-creased to 45.35 ± 18.40 and 25.66 ± 15.60 pmol/cell, respectively, while cells exposed to 100 nM of GLP-1 consumed 75.82 ± 28.40 pmol of glucose/cell and those not exposed to GLP-1 consumed 122.30 ± 30.70 pmol of glucose/cell (Fig. 2A). SCs also produce acetate (Alves et al., 2012), which is exported to the intratubularfluid by monocarboxylate transporters (MCTs), as is lactate. Our results show that hSCs exposed to all GLP-1 concentrations did not alter the protein
levels of MCT4 (Supplementary Fig.1D). On the other hand, acetate production by hSCs exposed to 1 nM of GLP-1 increased to 2.49 ± 0.38 pmol/cell when compared to non-exposed cells that pro-duced 1.34 ± 0.31 pmol/cell of acetate (Supplementary Fig. 2C). 3.3. Exposure to GLP-1 increased lactate production by hSCs
Once inside the cell, glucose is metabolized to pyruvate. Pyruvate is at a crossroad of several metabolic pathways. Exposure of hSCs to GLP-1 did not alter the consumption of pyruvate (Supplementary Fig. 2A). One of the metabolic pathways originated from pyruvate is the con-version to alanine by alanine aminotransferase. When we evaluated alanine production by hSCs exposed to GLP-1 no differences were ob-served (Supplementary Fig. 2B). In these cells, the majority of pyruvate is converted to lactate by LDH. Our results showed that lactate pro-duction by hSCs exposed to GLP-1 increased to 11.49 ± 2.06 and 11.49 ± 1.67 pmol/cell for cells exposed to 0.01, 1 nM, respectively, when compared to non-exposed hSCs (6.72 ± 2.48 pmol/cell of lac-tate) (Fig. 2B). We further analysed LDH expression and detected that it slightly decreased in cells exposed to 100 nM of GLP-1 to 0.86 ± 0.03-fold variation to non-exposed cells when compared to cells exposed to 1 nM of GLP-1 (0.94 ± 0.02-fold variation to non-exposed cells (Fig. 2C). However, LDH activity was increased in hSCs exposed to 100 nM of GLP-1 to 1.26 ± 0.16-fold variation relative to non-exposed cells and when compared to hSCs exposed to 1 nM of GLP-1, which, presented an activity of 0.78 ± 0.11-fold variation relative to non-exposed cells (Fig. 2D).
3.4. Human SCs exposed to 100 nM of GLP-1 presented decreased mitochondrial membrane potential
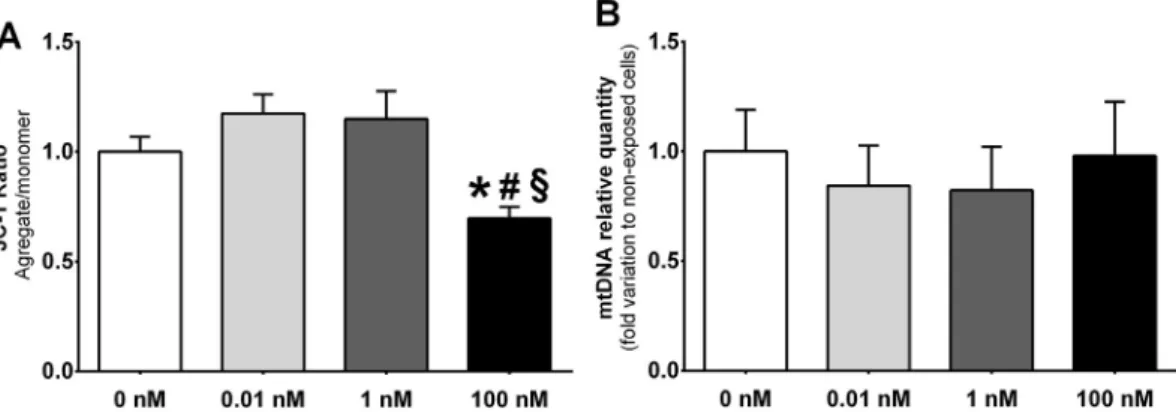
Our data showed that mitochondrial membrane potential decreased in SCs exposed to 100 nM (ratio of 0.61 ± 0.02), when compared to non-exposed or those exposed to 0.01 and 1 nM of GLP-1 (ratio of 1 ± 0.06; 1.15 ± 0.07 and 1.11 ± 0.10, respectively) (Fig. 3A). Still, when we analysed the relative quantity of mitochondrial DNA no al-teration was observed in hSCs exposed to GPL-1 when compared to non-exposed cells (Fig. 3B).
3.5. Carbonyl group levels decreased in hSCs exposed to 1 and 100 nM when compared to 0.01 nM of GLP-1
The high glycolyticflux, followed by the conversion of pyruvate to lactate, as happens in SCs, enhances a pro-oxidative environment. The products of protein carbonylation (dinitrophenol (DNP)), nitration (NT) and lipid peroxidation (4-HNE) are biomarkers for oxidative stress. Table 2
Antibodies used in this study
Antibody Source Molecular Weight (kDa) Dilution Vendor Catalog #
GLUT1 Rabbit 55 1:500 Santa Cruz Biotechnology, Heidelberg, Germany sc-7903 GLUT2 Rabbit 61 1:5000 Santa Cruz Biotechnology, Heidelberg, Germany sc-9117 GLUT3 Goat 48 1:500 Santa Cruz Biotechnology, Heidelberg, Germany sc-7582 MCT4 Rabbit 43 1:1000 Santa Cruz Biotechnology, Heidelberg, Germany sc-50329
LDH Rabbit 37 1:10000 Abcam, Cambridge, MA, USA ab52488
Catalase Mouse 60 1:4000 Sigma-Aldrich, Roedermark, Germany C0979
P-mTOR Rabbit 289 1:500 Cell Signaling Technology, Danvers, MA, USA 2971S β-Tubulin Mouse 50 1:5000 Thermo Fisher Scientific, Rockford, USA MA5-16308
DNP Rabbit — 1:5000 Sigma-Aldrich, Roedermark, Germany D9656
4-HNE Goat — 1:5000 EMD Millipore, Temecula, CA, USA AB5605
Nitro-Tirosine Rabbit — 1:2500 Cell Signaling Technology, Danvers, MA, USA 9691S
Mouse Goat — 1:5000 Sigma-Aldrich, Roedermark, Germany A3562
Rabbit Goat — 1:5000 Sigma-Aldrich, Roedermark, Germany A3687
Goat Rabbit — 1:5000 Sigma-Aldrich, Roedermark, Germany A4187
Abbreviations: 4-HNE- 4 Hydroxynonenal; DNP- Dinitrophenol; GLUT1- Glucose transporter 1; GLUT2- Glucose transporter 2; GLUT3- Glucose transporter 3; LDH-Lactate dehydrogenase; MCT4- Monocarboxylate transporter 4; P-mTOR- Phospho-mTOR
Fig. 1. Identification and effects of exposure to glucagon like peptide-1 (GLP-1) in its receptor (GLP-1R) in human Sertoli cells. Panel A - Expression of GLP-1R in cultured human Sertoli cells identified by reverse transcriptase polymerase chain reaction. Panel B - Expression of mRNA transcript levels of GLP-1R in human Sertoli cells exposed to increasing concentrations of GLP-1. Panels B shows pooled data of independent experiments, indicating the mRNA transcript levels of GLP-1R. hSCs: human Sertoli cells; hH: human heart; Neg: Negative control; Neg(RT): Negative without reverse transcriptase. Results are expressed as mean ± SEM (n = 6 for each condition).
Carbonyl group levels did not altered in any of hSCs exposed groups to GLP-1 when compared with the no GLP-1 group. However, hSCs ex-posed to 1 and 100 nM of GLP-1 presented lower levels of carbonyl groups (0.78 ± 0.07 and 0.86 ± 0.05-fold variation to non-exposed cells (no GLP-1), respectively (Fig. 4A)) when compared with hSCs exposed to 0.01 nM of GLP-1 (1.10 ± 0.02-fold variation to non-ex-posed cells (no GLP-1)). Yet, the levels of 4-HNE and NT groups were not altered in cells exposed to GLP-1 when compared with non-exposed cells (Fig. 4B and C, respectively). Additionally, we determined the
protein levels of antioxidant enzymes such as catalase and the total/ reduced glutathione ratio. Our results show that cells exposed to all GLP-1 concentrations did not presented alterations in the protein levels of catalase or in the total/reduced glutathione ratio when compared with the levels detected in non-exposed cells (Supplementary Fig. 3A and 3B, respectively).
Fig. 2. Effects of glucagon like peptide-1 (GLP-1) in glucose metabolism in human Sertoli cells. Glucose consumption (Panel A), lactate production (Panel B), expression of lactate dehydrogenase (LDH) (Panel C) and LDH activity (Panel D) in human Sertoli cells after exposure to increasing concentrations of GLP-1 are represented. Panels A and B show pooled data of independent experiments, indicating the glucose consumption and lactate production, respectively. Panels C and D show pooled data of independent experiments, indicating the protein levels and activity of LDH, respectively. Panels C also show representative Western Blot experiments. Results are expressed as mean ± SEM (n = 6 for each condition). Significantly different results (p < .05) are as indicated: * relative to non-exposed cells (no GLP-1); § relative to 1 nM.
Fig. 3. Effects of glucagon like peptide-1 (GLP-1) in mitochondria function of human Sertoli cells. JC-1 ratio (Panel A) and mitochondrial relative copies (Panel B) in human Sertoli cells exposed to increasing concentrations of GLP-1 are represented. Panel A shows JC-1 ratio found in human Sertoli cells cultured with increasing concentrations of GLP-1 or without GLP-1. Panel B shows pooled data of independent experiments indicating mitochondrial DNA (mtDNA) quantity by quantitative PCR. Results are expressed as mean ± SEM (n = 6 for each condition). Significantly different results (p < .05) are as indicated: * relative to non-exposed cells (no GLP-1); # relative to 0.01 nM; § relative to 1 nM.
3.6. Phosphorylated mTOR is increased in hSCs exposed to 100 nM of GLP-1
mTOR has a crucial role in coordinating cellular homeostasis and energy status (Chiang and Abraham, 2005). Recent studies demonstrate that mTOR signalling modulates the glycolytic and oxidative profile in hSCs (Jesus et al., 2016). GLP-1 had no effects regarding mTOR phos-phorylation in hSCs of any of the exposed groups when compared with expression in hSCs of no GLP-1 group. Still, hSCs exposed to 100 nM of GLP-1 presented an increase in the protein levels of phosphorylated mTOR (Ser2448), to 1.41 ± 0.28-fold variation to non-exposed cells (no GLP-1) when compared to hSCs exposed to 0.1 nM of GLP-1 (0.77 ± 0.12-fold variation relative non-exposed cells (no GLP-1)) (Fig. 5).
4. Discussion
GLP-1 is a peptide hormone with an active role in the regulation of circulating glucose levels (Brubaker, 2006). Glucose equilibrium is crucial for energy homeostasis and the proper functioning of
physiological functions, including male fertility (Dunning et al., 2005). Excessive fat accumulation is associated with dysregulation of energy homeostasis signalling systems, and with a concurrent impairment of GLP-1 mediated functions (Dirksen et al., 2013). Several GLP-1 analo-gues are now used as pharmacological agents to promote weight loss (Blundell et al., 2017). Recent studies have consistently associated the increase in obesity rates with decreased male fertility (Rato et al., 2014a). In 2030, it is estimated that over 50% of the world population will be overweight/obese (Smith and Smith, 2016), which will ag-gravate male infertility trends. Alterations in SC metabolism were hy-pothesized to contribute for reduced fertility in obese males (Winters et al., 2006). In fact, the SCs are responsible for the nutritional support of spermatogenesis.
There is evidence that GLP-1 may influence male reproductive function (Jeibmann et al., 2005), although few studies have been fo-cused on the molecular mechanisms. Since SCs are major hormonal targets within the testis (Alves et al., 2014;Martins et al., 2015;Martins et al., 2016), we hypothesized that GLP-1 could directly modulate the metabolic functions of these cells and has a possible effect on male fertility. For that, we exposed hSCs to increasing doses of GLP-1 to evaluate: (1) the impact of the postprandial levels of GLP-1; (2) the impact of GLP-1 when present at the levels reached by its analogues (liraglutide) in the plasma of healthy/obese individuals. The maximum plasma concentrations found in overweight and obese subjects treated with GLP-1 analogues is similar to the one observed in healthy in-dividuals (Onge et al., 2016). 1 actions are mediated by the GLP-1R. So far GLP-1R has only been identified in mice SCs by im-munohistochemistry of the testicular tissue (Zhang et al., 2015). Our results allowed us to observe for thefirst time the expression of GLP-1R in isolated hSCs. Interestingly, GLP-1 exposure did not change GLP-1R expression in cultured hSCs, illustrating that the mRNA expression of this receptor in these cells is not rapidly responsive to exposure to in-creasing GLP-1 concentrations.
We then evaluated the impact of GLP-1 postprandial levels in hSCs metabolism and bioenergetics. These cells uptake glucose from the in-terstitialfluid by the action of GLUTs (GLUT1–3). Glucose is then used to produce essential metabolites (mainly lactate) that will serve as en-ergy sources for developing germ cells (Martins et al., 2015;Martins et al., 2016). Although GLP-1 exposure did not alter GLUTs expression, hSCs decreased the consumption of glucose after exposure to post-prandial levels of this hormone, as compared to non-exposed cells. Concurrent results had been reported in other mammalian cell lines, with GLP-1 exposure decreasing deoxyglucose uptake (Morales et al., 2014). Our results suggest that this hormone is capable of eliciting an alteration of glucose uptake, likely due to an alteration on its Fig. 4. Detection of oxidative damage in human Sertoli cells exposed to increasing concentrations of glucagon like peptide-1 (GLP-1). The levels of carbonyl (Panel A), 4-hydroxynonenal (4-HNE) (Panel B) and nitro-tyrosine (NT) (Panel C) groups after exposure of human Sertoli cells to increasing concentrations of GLP-1 are represented. Panels A to C show pooled data of independent experiments, indicating the expression levels of carbonyl, 4-HNE and NT, respectively. Panels A-C also show representative Slot blot experiments. Results are expressed as mean ± SEM (n = 6 for each condition). Significantly different results (p < .05) are as in-dicated: # relative to 0.01 nM.
Fig. 5. Effect of glucagon like peptide-1 (GLP-1) on mammalian target of ra-pamycin (mTOR) signalling pathway. The protein expression levels of phos-phorylated mTOR (Ser2448) in human Sertoli cells after exposure to increasing concentrations of GLP-1 are represented. Figure shows pooled data of in-dependent experiments, indicating the expression levels of P-mTOR. Figure also show representative Western Blot experiments. Results are expressed as mean ± SEM (n = 6 for each condition). Significantly different results (p < .05) are as indicated: # relative to 0.01 nM.
metabolism. Still, GLP-1 postprandial levels were capable to stimulate lactate production by hSCs. Previous studies, show that lactate is es-sential for spermatogenesis (Oliveira et al., 2011) since it is used as metabolic fuel by developing germ cells (Boussouar and Benahmed, 2004) and has an anti-apoptotic effect on those cells (Rato et al., 2014b). The postprandial levels of GLP-1 increased the production of lactate, while glucose consumption was decreased, as compared to non-exposed cells, illustrating the metabolic commitment of these cells to an efficient production of lactate. No effect was detected on mitochondria functionality in these cells. Neither mitochondrial membrane potential nor DNA content were affected by exposure to these levels of GLP-1. Moreover, the oxidative stress markers (protein carbonyl and nitro-tyrosine groups, and lipid peroxides) were not altered, which correlates with a normal functioning of the mitochondria. Hence, at postprandial levels, GLP-1 seems to be vital for eliciting the production of lactate by hSCs, which in turn consume lower amounts of glucose. These cells have adaptive mechanisms, and show a metabolic plasticity (Alves et al., 2014;Martins et al., 2015;Martins et al., 2016;Meneses et al., 2016) that is very important to sustain the metabolic support of sper-matogenesis. They utilize a wide sort of metabolic sources to produce lactate, namely from triglycerides that accumulate as lipid droplets (Gorga et al., 2017). Depending on the substrate availability and on stimuli, SCs can oxidize these cytoplasmic lipidic droplets to support their metabolic requirements (Jutte et al., 1985). It has been described that GLP-1 may promote lipid droplet remodelling and lipolysis in human adipocytes, when present at concentrations above 10−11M (Villanueva-Penacarrillo et al., 2001). A similar event may be occurring in hSCs exposed to the postprandial levels of GLP-1 (Vilsboll et al., 2001;Balestrieri et al., 2015).
Similar results were obtained when the hSCs were exposed to GLP-1 concentrations that mimic the levels of GLP-1 analogues observed in the plasma after a single administration of liraglutide at the therapeutic dosage recommended for obese individuals (Elbrond et al., 2002). Both glucose consumption and lactate production were maintained, when compared to cells exposed to postprandial levels of GLP-1. The SC is responsible for producing lactate favouring the glycolyticflux (Oliveira et al., 2015), but it also uses mitochondrial oxidative phosphorylation to sustain its own energetic needs. Human SC exposed to 1 nM of GLP-1 presented an increase in acetate production, however this did not lead to an increase in mitochondrial membrane potential, as observed in other cell lines (Morales et al., 2014). No changes were observed in the pro-oxidant environment, nitration and lipid peroxidation, nor in the levels of antioxidant defences, but we found less oxidative damage in proteins of cells exposed to this concentration of GLP-1. This protective effect mediated by GLP-1 may be essential to counteract the pro-oxidant environment promoted by an increased metabolic activity.
Contrasting results were obtained with cells exposed to GLP-1 concentrations that mimic the levels of GLP-1 analogues observed in the plasma after a prolonged administration of liraglutide at the therapeutic dosage recommended for obese individuals (Jiang et al., 2011;Danne et al., 2017). In this case, hSCs appear to consume higher amounts of glucose, producing the same amounts of lactate, as compared to cells exposed to postprandial GLP-1 levels. This increased glucose con-sumption was associated with LDH activity stimulation, which suggest an adaptation to sustain lactate production. In fact, hSCs exposed to 100 nM of GLP-1, presented a decrease in mitochondrial membrane potential. As said, SCs have a distinct metabolic behaviour when compared to most somatic cells, with remarkable metabolic resem-blances with cancer cells (Oliveira et al., 2015). Thus, decreased mi-tochondrial membrane potential may not be a sign of compromised function, but rather a shift to sustain the metabolic biosynthetic re-quirements of developing germ cells and redirecting the metabolism of the cell for oxidative phosphorylation. Indeed, when we accessed oxi-dative damage, which is often associated with mitochondria malfunc-tion, the exposure to 100 nM GPL-1 did not promote protein nitration nor lipid peroxidation, but these cells rather showed less oxidative
damage in proteins without any changes in the levels of antioxidant defences. Again, GLP-1 appears to exert a protective effect that is es-sential to counteract testicular pro-oxidant environment. Although these results suggest that GLP-1 has an antioxidant effect the exact mechanism by which GLP-1 decreases oxidative stress in hSCs remains to be elucidated. Our studies further suggest that these alterations in glucose metabolism and mitochondrial function in hSCs exposed to 100 nM GPL-1 are associated with stimulation of mTOR Complex 1 (mTORC1) pathway, as mTOR phosphorylation at Ser2448 is increased. Although the significance of mTORC1 pathway for GLP-1 mediated effects is unclear, the involvement of this signalling pathway has been described in several cellular systems (Ravassa et al., 2011).
In conclusion, GLP-1 was able to modulate glucose metabolism and bioenergetics, promoting the production of lactate by hSCs. Moreover, exposure to the highest concentration of GLP-1 decreased oxidative damage in these cells. Also, the absence of toxic effects of GLP-1 at this concentration in hSCs, allied to a decrease in oxidative damage, adds a possible positive impact on male fertility. Still, further experiments are needed to clarify the effects of GLP-1 in male reproductive health and to determine if the effects observed in vitro translate to in vivo. Taking in consideration the decline of fertility rates parallel to the increasing prevalence of obesity, it is crucial to understand how GLP-1 affects male fertility. The use of GLP-1 analogues for obesity treatment could also be valuable to counteract the negative impact of adiposity related meta-bolic dysregulation in male reproductive function and arise as an ad-ditional target for medical intervention.
Conflict of interest
The authors declare that they have no conflict of interest. Acknowledgments
This work was supported by the “Fundação para a Ciência e a Tecnologia” - FCT: MG Alves (PTDC/BIM-MET/4712/2014, PTDC/ MEC-AND/28691/2017 and IFCT2015); PF Oliveira (PTDC/BBB-BQB/ 1368/2014 and IFCT2015); AD Martins (SFRH/BD/108726/2015); and UMIB (Pest-OE/SAU/UI0215/2014) co-funded by Fundo Europeu de Desenvolvimento Regional d FEDER via Programa Operacional Fatores de Competitividade COMPETE/QREN, FSE and POPH funds. NMR data was collected at the UC-NMR facility which is supported in part by FEDER e European Regional Development Fund through the COMPETE Programme (Operational Programme for Competitiveness) and by National Funds through FCT through grants RECI/QEQQFI/0168/2012, CENTRO-07-CT62-FEDER-002012, and Rede Nacional de Ressonância Magnética Nuclear (RNRMN).
Appendix A. Supplementary data
Supplementary data to this article can be found online athttps:// doi.org/10.1016/j.taap.2018.10.009.
References
Alves, M.G., Oliveira, P.J., Carvalho, R.A., 2011. Substrate selection in hearts subjected to ischemia/reperfusion: role of cardioplegic solutions and gender. NMR Biomed. 24, 1029–1037.
Alves, M.G., Socorro, S., Silva, J., Barros, A., Sousa, M., Cavaco, J.E., Oliveira, P.F., 2012. In vitro cultured human Sertoli cells secrete high amounts of acetate that is stimu-lated by 17beta-estradiol and suppressed by insulin deprivation. Biochim. Biophys. Acta 1823, 1389–1394.
Alves, M.G., Martins, A.D., Vaz, C.V., Correia, S., Moreira, P.I., Oliveira, P.F., Socorro, S., 2014. Metformin and male reproduction: effects on Sertoli cell metabolism. Br. J. Pharmacol. 171, 1033–1042.
Alves, M.G., Jesus, T.T., Sousa, M., Goldberg, E., Silva, B.M., Oliveira, P.F., 2016. Male fertility and obesity: are ghrelin, leptin and glucagon-like peptide-1 pharmacologi-cally relevant? Curr. Pharm. Des. 22, 783–791.
Balestrieri, M.L., Rizzo, M.R., Barbieri, M., Paolisso, P., D'Onofrio, N., Giovane, A., Siniscalchi, M., Minicucci, F., Sardu, C., D'Andrea, D., Mauro, C., Ferraraccio, F.,
Servillo, L., Chirico, F., Caiazzo, P., Paolisso, G., Marfella, R., 2015. Sirtuin 6 ex-pression and inflammatory activity in diabetic atherosclerotic plaques: effects of in-cretin treatment. Diabetes 64, 1395–1406.
Bell, G.I., Sanchez-Pescador, R., Laybourn, P.J., Najarian, R.C., 1983. Exon duplication and divergence in the human preproglucagon gene. Nature 304, 368–371.
Blundell, J., Finlayson, G., Axelsen, M., Flint, A., Gibbons, C., Kvist, T., Hjerpsted, J.B., 2017. Effects of once-weekly semaglutide on appetite, energy intake, control of eating, food preference and body weight in subjects with obesity. Diabetes Obes. Metab. 19, 1242–1251.
Boussouar, F., Benahmed, M., 2004. Lactate and energy metabolism in male germ cells. Trends Endocrinol. Metab. 15, 345–350.
Brubaker, P.L., 2006. The glucagon-like peptides: pleiotropic regulators of nutrient homeostasis. Ann. N. Y. Acad. Sci. 1070, 10–26.
Bullock, B.P., Heller, R.S., Habener, J.F., 1996. Tissue distribution of messenger ribonu-cleic acid encoding the rat glucagon-like peptide-1 receptor. Endocrinology 137, 2968–2978.
Chiang, G.G., Abraham, R.T., 2005. Phosphorylation of mammalian target of rapamycin (mTOR) at Ser-2448 is mediated by p70S6 kinase. J. Biol. Chem. 280, 25485–25490.
Crane, J., McGowan, B., 2016. The GLP-1 agonist, liraglutide, as a pharmacotherapy for obesity. Ther. Adv. Chronic Dis. 7, 92–107.
Danne, T., Biester, T., Kapitzke, K., Jacobsen, S.H., Jacobsen, L.V., Petri, K.C., Hale, P.M., Kordonouri, O., 2017. Liraglutide in an Adolescent Population with Obesity: a Randomized, Double-blind, Placebo-Controlled 5-Week Trial to Assess Safety, Tolerability, and Pharmacokinetics of Liraglutide in Adolescents Aged 12-17 Years. J. Pediatr. 181 (146–153), e143.
Dirksen, C., Jorgensen, N.B., Bojsen-Moller, K.N., Kielgast, U., Jacobsen, S.H., Clausen, T.R., Worm, D., Hartmann, B., Rehfeld, J.F., Damgaard, M., Madsen, J.L., Madsbad, S., Holst, J.J., Hansen, D.L., 2013. Gut hormones, early dumping and resting energy expenditure in patients with good and poor weight loss response after Roux-en-Y gastric bypass. Int. J. Obes. 37, 1452–1459.
Dunning, B.E., Foley, J.E., Ahren, B., 2005. Alpha cell function in health and disease: influence of glucagon-like peptide-1. Diabetologia 48, 1700–1713.
Elbrond, B., Jakobsen, G., Larsen, S., Agerso, H., Jensen, L.B., Rolan, P., Sturis, J., Hatorp, V., Zdravkovic, M., 2002. Pharmacokinetics, pharmacodynamics, safety, and toler-ability of a single-dose of NN2211, a long-acting glucagon-like peptide 1 derivative, in healthy male subjects. Diabetes Care 25, 1398–1404.
Fontaine, K.R., Redden, D.T., Wang, C., Westfall, A.O., Allison, D.B., 2003. YEars of life lost due to obesity. JAMA 289, 187–193.
Fuke, S., Kubota-Sakashita, M., Kasahara, T., Shigeyoshi, Y., Kato, T., 2011. Regional variation in mitochondrial DNA copy number in mouse brain. Biochim. Biophys. Acta 1807, 270–274.
Gorga, A., Rindone, G.M., Regueira, M., Pellizzari, E.H., Camberos, M.C., Cigorraga, S.B., Riera, M.F., Galardo, M.N., Meroni, S.B., 2017. PPARgamma activation regulates lipid droplet formation and lactate production in rat Sertoli cells. Cell Tissue Res. 369, 611–624.
Guedes, T.P., Martins, S., Costa, M., Pereira, S.S., Morais, T., Santos, A., Nora, M., Monteiro, M.P., 2015. Detailed characterization of incretin cell distribution along the human small intestine. Surg. Obes. Relat. Dis. 11, 1323–1331.
Jeibmann, A., Zahedi, S., Simoni, M., Nieschlag, E., Byrne, M.M., 2005. Glucagon-like peptide-1 reduces the pulsatile component of testosterone secretion in healthy males. Eur. J. Clin. Investig. 35, 565–572.
Jesus, T.T., Oliveira, P.F., Silva, J., Barros, A., Ferreira, R., Sousa, M., Cheng, C.Y., Silva, B.M., Alves, M.G., 2016. Mammalian target of rapamycin controls glucose con-sumption and redox balance in human Sertoli cells. Fertil. Steril. 105, 825–833 (e823).
Jesus, T.T., Oliveira, P.F., Sousa, M., Cheng, C.Y., Alves, M.G., 2017. Mammalian target of rapamycin (mTOR): a central regulator of male fertility? Crit. Rev. Biochem. Mol. Biol. 52, 235–253.
Jiang, J., Zhang, J., Jacobsen, L.V., Hu, P., 2011. The pharmacokinetics, pharmacody-namics, and tolerability of liraglutide, a once-daily human GLP-1 analogue, after multiple subcutaneous administration in healthy Chinese male subjects. J. Clin. Pharmacol. 51, 1620–1627.
Jutte, N.H., Eikvar, L., Levy, F.O., Hansson, V., 1985. Metabolism of palmitate in cultured rat Sertoli cells. J. Reprod. Fertil. 73, 497–503.
Kang, M.Y., Oh, T.J., Cho, Y.M., 2015. Glucagon-like Peptide-1 increases Mitochondrial Biogenesis and Function in INS-1 Rat Insulinoma Cells. Endocrinol. Metab. (Seoul). 30, 216–220.
MacLusky, N.J., Cook, S., Scrocchi, L., Shin, J., Kim, J., Vaccarino, F., Asa, S.L., Drucker, D.J., 2000. Neuroendocrine function and response to stress in mice with complete disruption of glucagon-like peptide-1 receptor signaling. Endocrinology 141,
752–762.
Martins, A.D., Moreira, A.C., Sa, R., Monteiro, M.P., Sousa, M., Carvalho, R.A., Silva, B.M., Oliveira, P.F., Alves, M.G., 2015. Leptin modulates human Sertoli cells acetate production and glycolytic profile: a novel mechanism of obesity-induced male in-fertility? Biochim. Biophys. Acta 1852, 1824–1832.
Martins, A.D., Sa, R., Monteiro, M.P., Barros, A., Sousa, M., Carvalho, R.A., Silva, B.M., Oliveira, P.F., Alves, M.G., 2016. Ghrelin acts as energy status sensor of male re-production by modulating Sertoli cells glycolytic metabolism and mitochondrial bioenergetics. Mol. Cell. Endocrinol. 434, 199–209.
Meneses, M., Bernardino, R., Sá, R., Silva, J., Barros, A., Sousa, M., Silva, B., Oliveira, P., Alves, M., 2016. Pioglitazone increases the glycolytic efficiency of human Sertoli cells with possible implications for spermatogenesis. Int. J. Biochem. Cell Biol. 79, 52–60.
Morales, P.E., Torres, G., Sotomayor-Flores, C., Pena-Oyarzun, D., Rivera-Mejias, P., Paredes, F., Chiong, M., 2014. GLP-1 promotes mitochondrial metabolism in vascular smooth muscle cells by enhancing endoplasmic reticulum-mitochondria coupling. Biochem. Biophys. Res. Commun. 446, 410–416.
Ogata, M., Iwasaki, N., Ide, R., Takizawa, M., Uchigata, Y., 2014. GLP-1-related proteins attenuate the effects of mitochondrial membrane damage in pancreatic beta cells. Biochem. Biophys. Res. Commun. 447, 133–138.
Oliveira, P.F., Sousa, M., Barros, A., Moura, T., Rebelo Da Costa, A., 2009. Intracellular pH regulation in human Sertoli cells: role of membrane transporters. Reproduction 137, 353–359.
Oliveira, P.F., Alves, M.G., Rato, L., Silva, J., Sa, R., Barros, A., Sousa, M., Carvalho, R.A., Cavaco, J.E., Socorro, S., 2011. Influence of 5alpha-dihydrotestosterone and 17beta-estradiol on human Sertoli cells metabolism. Int. J. Androl. 34, e612–e620.
Oliveira, P.F., Martins, A.D., Moreira, A.C., Cheng, C.Y., Alves, M.G., 2015. The Warburg effect revisited–lesson from the Sertoli cell. Med. Res. Rev. 35, 126–151.
Oliveira, P.F., Cheng, C.Y., Alves, M.G., 2017. Emerging Role for Mammalian Target of Rapamycin in Male Fertility. Trends Endocrinol. Metab. 28, 165–167.
Onge, E.S., Miller, S.A., Motycka, C., 2016. Liraglutide (Saxenda®) as a Treatment for Obesity. Food Nutr. Sci. 7, 227.
Park, S.H., Park, J.H., Shim, H.M., Na, A.Y., Bae, K.C., Lim, J.G., Song, D.K., 2015. Protection of pancreatic beta-cells against glucotoxicity by short-term treatment with GLP-1. Biochem. Biophys. Res. Commun. 459, 561–567.
Ranganath, L.R., 2008. The entero-insular axis: implications for human metabolism. Clin. Chem. Lab. Med. 46, 43–56.
Rato, L., Alves, M.G., Cavaco, J.E., Oliveira, P.F., 2014a. High-energy diets: a threat for male fertility? Obes. Rev. 15, 996–1007.
Rato, L., Duarte, A.I., Tomás, G.D., Santos, M.S., Moreira, P.I., Socorro, S., Cavaco, J.E., Alves, M.G., Oliveira, P.F., 2014b. Pre-diabetes alters testicular PGC1-α/SIRT3 axis modulating mitochondrial bioenergetics and oxidative stress. Biochim. Biophys. Acta 1837, 335–344.
Ravassa, S., Zudaire, A., Carr, R.D., Diez, J., 2011. Antiapoptotic effects of GLP-1 in murine HL-1 cardiomyocytes. Am. J. Physiol. Heart Circ. Physiol. 300, H1361–H1372.
Ruiz-Grande, C., Alarcon, C., Alcantara, A., Castilla, C., Lopez Novoa, J.M., Villanueva-Penacarrillo, M.L., Valverde, I., 1993. Renal catabolism of truncated glucagon-like peptide 1. Horm. Metab. Res. 25, 612–616.
Skehan, P., Storeng, R., Scudiero, D., Monks, A., McMahon, J., Vistica, D., Warren, J.T., Bokesch, H., Kenney, S., Boyd, M.R., 1990. New colorimetric cytotoxicity assay for anticancer-drug screening. J. Natl. Cancer Inst. 82, 1107–1112.
Smith, K.B., Smith, M.S., 2016. Obesity Statistics. Prim. Care 43 (121–135), ix.
Steger, K., Rey, R., Kliesch, S., Louis, F., Schleicher, G., Bergmann, M., 1996. Immunohistochemical detection of immature Sertoli cell markers in testicular tissue of infertile adult men: a preliminary study. Int. J. Androl. 19, 122–128.
Villanueva-Penacarrillo, M., Marquez, L., Gonzalez, N., Diaz-Miguel, M., Valverde, I., 2001. Effect of GLP-1 on lipid metabolism in human adipocytes. Horm. Metab. Res. 33, 73–77.
Vilsboll, T., Krarup, T., Deacon, C.F., Madsbad, S., Holst, J.J., 2001. Reduced postprandial concentrations of intact biologically active glucagon-like peptide 1 in type 2 diabetic patients. Diabetes 50, 609–613.
Winters, S.J., Wang, C., Abdelrahaman, E., Hadeed, V., Dyky, M.A., Brufsky, A., 2006. Inhibin-B levels in healthy young adult men and prepubertal boys: is obesity the cause for the contemporary decline in sperm count because of fewer Sertoli cells? J. Androl. 27, 560–564.
Zhang, E., Xu, F., Liang, H., Yan, J., Xu, H., Li, Z., Wen, X., Weng, J., 2015. GLP-1 Receptor Agonist Exenatide Attenuates the Detrimental Effects of Obesity on Inflammatory Profile in Testis and Sperm Quality in mice. Am. J. Reprod. Immunol. 74, 457–466.