O R I G I N A L
A R T I C L E
Average spectral power changes at the
hippocampal electroencephalogram in
schizophrenia model induced by ketamine
Luis Rafael L. Sampaio
a,b, Lucas T.N. Borges
a, Joyse M.F. Silva
b,
Francisca Roselin O. de Andrade
b, Talita M. Barbosa
a,
Tatiana Q. Oliveira
a, Danielle Macedo
a, Ricardo F. Lima
a,
Leonardo P. Dantas
a, Manoel Cl
audio A. Patrocinio
c,d,
Otoni C. do Vale
a,#, Silv
^
ania M.M. Vasconcelos
a*
a
Department of Physiology and Pharmacology, School of Medicine, Federal University of Ceara, Fortaleza, Brazil b
Health Science Center, School of Nursing, University of Fortaleza, Fortaleza, Brazil c
Health Science Center, School of Medicine, University Centre Christus, Fortaleza, Brazil d
Department of Anesthesiology, Dr. Jose Frota Institute Hospital, Fortaleza, Brazil
Keywords
electroencephalogram, hippocampus, ketamine, schizophrenia, spectral analysis
Received 11 May 2017; revised 13 August 2017; accepted 23 August 2017
*Correspondence and reprints: silvania_vasconcelos@ yahoo.com.br and [email protected]
#in memoriam.
A B S T R A C T
The use of ketamine (Ket) as a pharmacological model of schizophrenia is an important tool for understanding the main mechanisms of glutamatergic regulated neural oscillations. Thus, the aim of the current study was to evaluate Ket-induced changes in the average spectral power using the hippocampal quantitative elec-troencephalography (QEEG). To this end, male Wistar rats were submitted to a stereotactic surgery for the implantation of an electrode in the right hippocampus. After three days, the animals were divided into four groups that were treated for 10 consecutive days with Ket (10, 50, or 100 mg/kg). Brainwaves were captured on the 1st or 10th day, respectively, to acute or repeated treatments. The adminis-tration of Ket (10, 50, or 100 mg/kg), compared with controls, induced changes in the hippocampal average spectral power of delta, theta, alpha, gamma low or high waves, after acute or repeated treatments. Therefore, based on the alterations in the average spectral power of hippocampal waves induced by Ket, our findings might provide a basis for the use of hippocampal QEEG in animal models of schizophrenia.
I N T R O D U C T I O N
Schizophrenia is a serious and disabling chronic mental illness that affects around 1% of the world population [1]. Schizophrenia include positive (delusions and hal-lucinations) and negative (blunted affect and social withdrawal) symptoms as well as cognitive impair-ments [2]. The pathophysiology of this mental disorder remains unknown. These symptoms are related to alterations in distinct brain areas, mainly hippocampus (HC) [3,4]. Patients with schizophrenia, besides from presenting behavioral symptoms, also show
electroencephalographic changes mostly during crises [5]. This abnormal electrical activity is related to the malfunction of brain structures like the hippocampus, amygdala, thalamus, temporal, frontal, and cingulate cortices [6].
states of rest and activity. Neural oscillations and their synchronization may represent a versatile signal to understand the flexible communication within and between cortical areas. There is broad evidence that cognitive functions are associated with the synchro-nized oscillatory activity, suggesting a functional mech-anism of neural oscillations in cortical networks. In addition to its role in normal brain function, there is growing evidence that the modified oscillatory activity may be associated with certain neuropsychiatric disor-ders such as schizophrenia, which involve dysfunc-tional behavior and cognition [9]. That way, schizophrenia is often considered a disconnection syn-drome, as abnormal interactions between a wide range of functional brain networks result in cognitive and perception deficits [10].
Ketamine, a noncompetitive antagonist of NMDA glutamate receptor, presents a broad range of phar-macological effects depending on the dose. In this regard, at high doses (160 mg/kg) this drug presents anesthetics properties [11]. However, not anesthetics doses of ketamine (10 mg/kg [12]; 20 mg/kg [13,14]; 25, 50, or 75 mg/kg [15]; and 100 mg/kg [16]) induce cognitive impairment, psychosis, and exacerbates schizophrenic symptoms. Thus, ketamine is widely used for schizophrenia-like induction in rodents [12–14,16,17]. In line with this, several stud-ies have demonstrated that a single dose of ketamine induces a state in the brain characterized by an increase in the power and intrinsic frequency of brain oscillations [18–20]. Spectral analysis showed an
increase in absolute power after ketamine doses of 9 or 30 mg/kg, with the highest increase being achieved in the delta, beta, and gamma bands. Changes were most prominent at 10–15 min after administration, which temporally correlates with the highest ketamine and norketamine levels in the brain [21].
Pharmacological models of schizophrenia induced by ketamine are an important tool for understanding the main mechanisms of glutamatergic regulated neural oscillations. These neural oscillations are evaluated through quantitative EEG (QEEG) of rats after the administration of ketamine providing a valuable animal-clinical interface for the study of glutamatergic dysfunction in schizophrenia. Thus, our study aimed to evaluate changes in the average spectral power of hippocampal QEEG in animals sub-mitted to the model of schizophrenia induced by ketamine.
M A T E R I A L A N D M E T H O D S
Animals
The experiments were performed in male Wistar rats (200–300 grams). The animals were kept at a room
with controlled temperature (231°C) with a cycle of 12-h light/dark and free access to food and water. Experiments were conducted during the light phase between 09:00 and 13:00.
All experimental procedures were performed in accordance with Guide for the Care and Use of Labora-tory Animals from the National Research Council. The protocols were approved by the Ethics Committee of Federal University of Ceara (No. 92/2009).
Drugs
Ketamine (Ket) hydrochloride (Vetanarcol, 50 mg/ mL, K€onig, Avellaneda, Argentina) was dissolved in 0.9% saline solution and administered intraperitoneally (ip). The control animals received 0.9% saline. All solu-tions were administered in a volume of 0.1 mL for each 100 g of body weight.
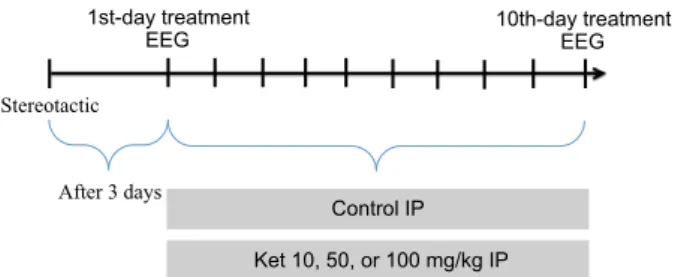
Outline of the study Electroencephalographic study
Stereotactic surgery and electrodes implantation. The rats were first anesthetized with ketamine (100 mg/kg, i.p.) and xylazine (10 mg/kg, i.p.). During the surgical pro-cedure, bipolar and twisted electrodes of NiCr wire (di-ameter 150lm) were implanted in the hippocampus through stereotactic device (Stoelting
, EUA) at the fol-lowing coordinates (mm): AP= 4.0, ML =2.6, and DV = 3.5 from bregma, according to the Atlas of Paxinos and Watson [22]. An additional screw was placed in the frontal bone cavity as the reference elec-trode. The electrodes were fixed to the skull with dental acrylic cement. The correct location of the implanted electrodes in the hippocampus was verified by histologi-cal analysis using violet cresyl staining according to [23] and [24].
Treatment protocol. Three days after implantation of the electrodes [23], the animals were randomly divided into four groups (n=6 animals/group). The treatment groups received 10 days administration of the drugs (each one administered once a day) being divided as follows: group 1–control–0.9% saline intraperitoneal
which are indicated in the literature for induction of schizophrenia-like alterations (10 mg/kg [12]; 50 [15,25] or 100 mg/kg [16]). The EEG recordings were taken from the hippocampus of animals in vivo on the 1st and 10th days of treatment, immediately after the last drug administration during the light phase between the hours of 09:00 and 13:00 (Figure 1).
Electroencephalographic records. The quantitative EEG was recorded continuously for 20 min through a poly-graph digital system (PowerLab 4/30 device) [26]. The signals were 20 0009amplified and filtered (means fil-ter), in a 1 000-Hz sampling rate and recorded using version 7.3.8 of the LabChart Acquisition Software. EEG was recorded individually in a glass box (0.390.59 0.4 m), with the floor covered with saw-dust. The acquisition cable was connected to a micro-connector on the animal’s head, with the electrical activity signals being captured by a PowerLabsystem. The EEG recordings were analyzed by the Lab-Chart 7.3.8. The data were segmented into 1 024 points, and the signals were converted to spectral power by the fast Fourier transform (FFT). The spectral power parameter was defined as the average of mean power frequency (absolute values), calculated in steps of 5 min. The waves were divided into five bands at the following defined frequency ranges (delta: 0–4 Hz; theta: 4–8 Hz; alpha: >8–13 Hz; gamma low: 30–50 Hz; and gamma high 50–100 Hz) [23].
Statistical analysis
D’Agostino and Pearson omnibus normality test was used to confirm the normally distribution of data. The comparisons were performed by analysis of variance (two-way ANOVA) using GraphPad Software 5.0 version for Windows, GraphPad Software (San Diego, CA, USA) with Bonferroni as post hoc test. Results were
considered significant at P <0.05 and were presented as meanSEM.
R E S U L T S
Typical examples of the EEG, mean power spectral in the hippocampus of rats in acute treatment (Figure 2a), or repeated treatment for 10 days (Figure 2b) with ketamine were 10, 50, or 100 mg/kg.
The acute administration of ketamine did not change the average spectral power in the delta band (0–4 Hz) at any time when compared to the control group ( Fig-ure 3a). However, ketamine repeated administration for 10 days at the lowest dose (10 mg/kg) induced increases in the average spectral power in the delta band (Figure 3b). This increase was observed in the fifth (3.440.02; P< 0.05), tenth (3.440.01; P<0.01), fifteenth (3.44 0.01;P< 0.01), and twen-tieth minute (3.440.00; P <0.01) compared to group control (5 min: 3.370.01; 10 min: 3.36 0.01; 15 min: 3.360.00; 20 min: 3.37 0.01) [F3,50=30.23;P<0.001].
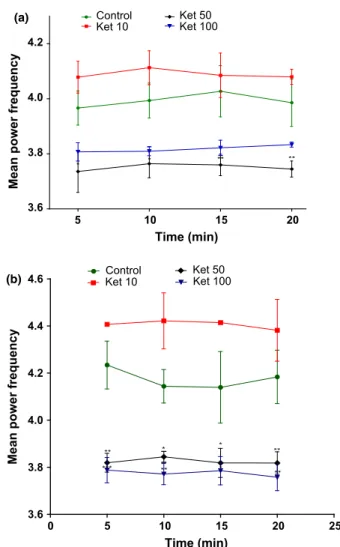
For the theta band (4–8 Hz), ketamine (Figure 4a) only at the dose of 50 mg/kg decreased its average spectral power in the 1st day of treatment (5 min: P<0.05; 10 min: P <0.05; 15 min: P<0.01; 20 min: P<0.01) when compared to the control group (5 min: 3.960.06; 10 min: 3.990.06; 15 min: 4.020.09; 20 min: 3.98 0.08) [F3,49=24.85; P <0.0001]. A similar effect (Figure 4b) was observed after repeated ketamine administration for 10 days at 50 mg/kg (5 min: P <0.01; 10 min: P<0.05; 15 min: P <0.05; 20 min: P< 0.01) or 100 mg/kg (5 min: P <0.001; 10 min: P<0.01; 15 min: P<0.05; 20 min: P <0.01) when compared to the control group (5 min: 4.230.10; 10 min: 4.140.07; 15 min: 4.000.08; 20 min: 4.180.11) [F3,62=42.36; P< 0.0001]. On the other hand, Ket 10 mg/kg induced an increase, although not statistically significant, in theta band (Figure 4 a andb).
An increase in the average spectral power of alpha band (>8–13 Hz) was evidenced by ketamine
adminis-tration (Figure 5) only at the lowest dose, both on the 1st day (5 min:P <0.01; 10 min:P <0.001; 15 min: P<0.05) as on the 10th day of treatment (5 min: P<0.01; 10 min: P <0.01; 15 min: P <0.001; 20 min: P<0.01) when compared to the control group [1st day (5 min: 4.87 0.12; 10 min: 4.840.12; 15 min: 4.880.16) [F3,58 =23.63; 10th-day treatment
EEG
Stereotactic
After 3 days 1st-day treatment
EEG
Control IP
Ket 10, 50, or 100 mg/kg IP
Bands Treatment for 10 days
Control Ket 10 Ket 50 Ket 100
Delta
Theta
Alpha
Gamma low
Gamma high
Bands Acute treatment
Control Ket 10 Ket 50 Ket 100
Delta
Theta
Alpha
Gamma low
Gamma high
(b) (a)
P<0.0001]; 10th day (5 min: 5.26 0.19; 10 min: 5.07 0.09; 15 min: 4.88 0.08; 20 min: 4.99 0.16)] [F3,64= 41.70;P< 0.0001].
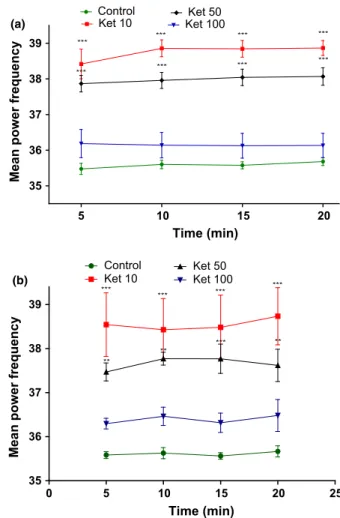
The low gamma band (30–50 Hz) was increased
after acute administration of ketamine (Figure 6a) in the doses of 10 (5 min:P <0.001; 10 min:P<0.001; 15 min: P<0.001; 20 min: P <0.001) or 50 mg/kg (5 min: P<0.001; 10 min: P<0.001; 15 min: P<0.001; 20 min:P <0.001) when compared to con-trol group (5 min: 35.480.15; 10 min: 35.600.11; 15 min: 35.580.09; 20 min: 35.680.10) [F3,51=109.29; P<0.0001]. A similar effect was observed after ketamine repeated treatment (Figure 6b) at the doses of 10 (5 min: P<0.001; 10 min: P<0.001; 15 min: P<0.001; 20 min: P<0.001) or 50 mg/kg (5 min: P <0.01; 10 min: P<0.01; 15 min:P<0.001; 20 min:P <0.01) when
compared to control group (5 min: 35.580.07; 10 min: 35.630.12; 15 min: 35.560.07; 20 min: 35.670.12) [F3,33=48.45;P <0.0001].
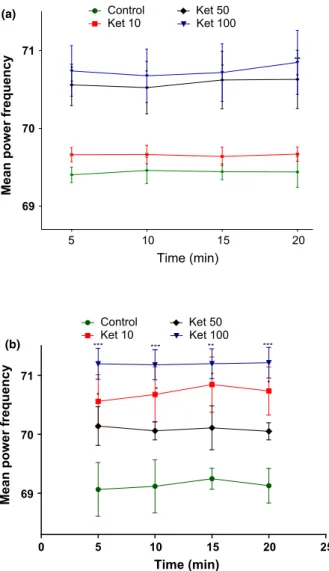
In the high gamma band (50–100 Hz), the results of
the average spectral power were increased by acute [F3,44=17.14;P <0.0001] or repeated [F3,46=26.43; P<0.0001] treatment with ketamine (Figure 7) at the dose of 100 mg/kg [1st day (5 min:P <0.05; 10 min: P<0.05; 15 min: P <0.05; 20 min: P<0.01); 10th day (5 min: P<0.001; 10 min: P<0.001; 15 min: P<0.01; 20 min: P<0.001)]. However, a similar effect was observed with the acute administration of ketamine 50 mg/kg (5 min: P <0.05; 20 min:
0 5 10 15 20 25
3.35 3.40
3.45 ControlKet 10 Ket 50Ket 100
(a)
Time (min)
Mean power frequency
0 5 10 15 20 25
3.35 3.40 3.45 3.50
Control Ket 10
Ket 50 Ket 100
(b)
Time (min)
Mean power frequency
* ** **
**
Figure 3 Mean power spectral of delta rhythm in the
hippocampus of rats in acute treatment (a) or repeated treatment for 10 days (b) with ketamine (10, 50 or 100 mg/kg). Each bar represents meanSEM. For all analyzes,*P<0.05 or
**P<0.01 were considered significant. Two-wayANOVAfollowed by Bonferroni as post hoc test.
5 10 15 20
3.6 3.8 4.0 4.2
Control Ket 10
Ket 50 Ket 100
0 5 10 15 20 25
3.6 3.8 4.0 4.2 4.4
4.6 ControlKet 10 Ket 50Ket 100
Mean power frequency
Mean power frequency
Time (min)
Time (min)
(a)
(b)
* * ** **
** ** *
* **
** ***
*
Figure 4Mean power spectral of theta rhythm in the
hippocampus of rats in acute treatment (a) or repeated treatment for 10 days (b) with ketamine (10, 50, or 100 mg/kg). Each bar represents meanSEM. For all analyzes,*P<0.05,
P <0.05), and with the repeated administration of ketamine 10 mg/kg (5 min: P <0.05; 10 min: P <0.05; 15 min: P<0.05; 20 min: P <0.05) when compared to control group [1st day (5 min: 69.40 0.19; 10 min: 69.45 0.29; 15 min: 69.440.14; 20 min: 69.430.39); 10th day (5 min: 69.42 0.36; 10 min: 69.44 0.35; 15 min: 69.440.14; 20 min: 69.430.39)].
D I S C U S S I O N
From the quantitative analysis of rats hippocampal EEG under the pharmacological model of schizophrenia induced by ketamine, our results showed that only ketamine in low doses (10 mg/kg) caused an increase in the average spectral power in the delta band after
repeated treatment. This result suggests that the action of ketamine in rats’ hippocampal delta wave will depend on the dose of administration and the treat-ment time. In other words, we observed that the fre-quency of the delta wave was increased to near the maximum peak frequency stipulated in this study (4 Hz) only after the repeated treatment with ketamine 10 mg/kg. A similar result was obtained in an in vivo study showing the effects of the administration of NMDA receptor (NMDAR) antagonists on delta oscilla-tions in the CA1 area of the hippocampus [27]. These authors observed an increase in the average spectral power with ketamine at a dose of 50 mg/kg, which was not seen with the dose of 20 mg/kg [27].
0 5 10 15 20 25
4.0 4.5 5.0 5.5
6.0 Control Ket 10
Ket 50 Ket 100
5 10 15 20 25
5 6 7
8 Control
Ket 10
Ket 50 Ket 100
Mean power frequency
Mean power frequency
Time (min)
Time (min)
(a)
(b)
* ***
**
** ** **
***
Figure 5 Mean power spectral of alpha rhythm in the
hippocampus of rats in acute treatment (a) or repeated treatment for 10 days (b) with ketamine (10, 50, or 100 mg/kg). Each bar represents meanSEM. For all analyzes,*P<0.05,**P<0.01, or***P<0.001 were considered significant. Two-wayANOVA followed by Bonferroni as post hoc test.
0 5 10 15 20 25
35 36 37 38 39
Control Ket 10
Ket 50 Ket 100
5 10 15 20
35 36 37 38 39
Control Ket 10
Ket 50 Ket 100
Mean power frequency
Mean power frequency
Time (min)
Time (min) (a)
(b)
***
***
***
***
***
***
***
***
***
*** ***
***
*** ** **
**
Figure 6 Mean power spectral of gamma low rhythm in the hippocampus of rats in acute treatment (a) or repeated treatment for 10 days (b) with ketamine (10, 50, or 100 mg/kg). Each bar represents meanSEM. For all analyzes,**P<0.01 or
It is believed that the slow delta activity is originated in oscillatory neurons in the deep cortical layers of the thalamus, normally inhibited by the ascending reticular input. The delta activity might reflect the hyperpolariza-tion of cortical neurons resulting in de-differentiahyperpolariza-tion of neural activity [28] [29]. This supports the concept that schizophrenia may involve the filtering of sensory sig-nals input to the cortex by means of the thalamus [30]. Many researchers have supported the concept that the negative symptoms of schizophrenia might be related to a decrease in delta wave during sleep [31–34].
For theta band, our findings showed that ketamine in the higher dose decreased the average spectral power. Previous findings showed a similar decrease in the average spectral power in hippocampal theta band oscillations with the administration of NMDAR antago-nists, amino-phosphono-valeric acid (10–20lg APV)
[35]; MK801 (0.01–0.2 mg/kg) [36,37], and ketamine (20 mg/kg) [38] [39]. Theta rhythm is a rather slow frequency between 4 and 8 Hz, with an amplitude of 50–100lV [23,40]. This rhythm is mostly related to
REM sleep [40] and may represent the inhibitory action of GABAergic interneurons affecting the corti-cothalamic network. It could be associated with limbic activity (memory and emotions) [8] in brain areas such as hippocampus and amygdala. The proper organiza-tion and funcorganiza-tion of GABAergic interneuron networks in these systems are essential for many cognitive pro-cesses and abnormalities documented in schizophrenic patients. The memory function of the hippocampus depends on two major patterns of oscillations in the theta and gamma ranges [37].
We also observed an increase in the average spectral power of the alpha band with ketamine administration at a dose of 10 mg/kg in the 1st and 10th day of treatment. The effects caused by the administration of NMDAR antagonists on hippocampal alpha oscillations are poorly documented in the literature. The alpha rhythm can be produced by pacemaker neurons distributed through the thalamus that oscillate synchronously in the alpha fre-quency range (7.5–12.5 Hz), which dominates the EEG of an alert normal person at rest [28]. The reticular nucleus can hyperpolarize cell membranes of thalamic neurons through the release of GABA, decreasing the dominant alpha rhythm, thus passing to the theta spec-trum, which is slower (3.5–7.5 Hz) and reducing the sensory activity to the cortex [28]. Therefore, we can infer that the alpha band activity could be increased with low and intermediate doses of ketamine. Based on this premise, we can suggest that the changes induced by ketamine in the alpha band oscillation are related primarily to the thalamus. Thus, the alterations in this frequency band may indicate dysfunction of the inhibitory thalamic neurons by ketamine.
Acute administration of ketamine (10 or 50 mg/kg) increased the spectral power of the gamma low band. This increase in the spectral activity of gamma low band remained after the treatment with ketamine for 10 days in doses of 10 or 50 mg/kg. A similar effect was observed for gamma high band with acute keta-mine administration only at the highest dose (50 or
5 10 15 20
69 70 71
0 5 10 15 20 25
69 70 71
Control Ket 10
Ket 50 Ket 100 Control
Ket 10
Ket 50 Ket 100
Mean power frequency
Mean power frequency
Time (min)
Time (min)
(a)
(b)
* *
* * *
**
*** *** ** ***
* *
*
*
100 mg/kg). In the case of treatment with ketamine for 10 days, this increase in the spectral activity of gamma high band remained, but at the doses of 10 or 100 mg/kg. The activity in the gamma bands (25–50 Hz) may reflect cortico-thalamo-cortical rever-beratory circuits as well as back propagation of axonal discharges to the dendrites of cortical pyramidal cells, which may play an important role in perception [28]. Furthermore, there is also evidence that the oscillatory gamma activity may be related to symptoms of schizophrenia such as hallucinations, thought disorders and negative symptoms. Thus, the positive symptoms of schizophrenia can be correlated with an amplitude increase in the gamma-band in brain regions, while the negative symptoms have been linked to low fre-quency oscillations [8,41] [42]. Similar results were observed in earlier studies demonstrating that the administration of ketamine induced a state in the brain characterized by an increase in the power and intrinsic frequency of gamma oscillations [15,27,37,43].
The present study has some limitations: (i) the beta band (14–30 Hz) is missing in the defined frequency
ranges of our study, and (ii) ketamine is a pharmaco-logical model of schizophrenia presenting thus limita-tions regarding the modeling of the ethiopatogenic mechanisms involved in this mental disorder, such as its developmental course. This may justify some inconsistent results observed in the present study.
In summary, our study provides an analysis of the changes induced by ketamine in the hippocampal elec-trical activity of rats. We found that acute and repeated administration of ketamine increased the aver-age spectral power of delta, alpha, gamma low, and gamma high bands, indicating that the glutamatergic system dysfunction observed in schizophrenia affects the spectrum of hippocampal bands oscillations.
A C K N O W L E D G E M E N T
Brazilian Institutions, CNPq, CAPES and FUNCAP partially funded this study.
R E F E R E N C E S
1 McGrath J., Saha S., Chant D., Welham J. Schizophrenia: a concise overview of incidence, prevalence, and mortality. Epidemiol. Rev. (2008)3067–76.
2 Bowie C.R., Harvey P.D. Cognitive deficits and functional outcome in schizophrenia. Neuropsychiatr. Dis. Treat. (2006) 2531–536.
3 de Oliveira L., Fraga D.B., De Luca R.D. et al. Behavioral changes and mitochondrial dysfunction in a rat model of schizophrenia induced by ketamine. Metab. Brain Dis. (2011) 2669–77.
4 Floresco S.B., Zhang Y., Enomoto T. Neural circuits subserving behavioral flexibility and their relevance to schizophrenia. Behav. Brain Res. (2009)204396–409. 5 Dawson N., Morris B.J., Pratt J.A. Functional brain
connectivity phenotypes for schizophrenia drug discovery. J. Psychopharmacol. (2015)29169–177.
6 Kandratavicius L., Lopes-Aguiar C., Bueno-Junior L.S., Romcy-Pereira R.N., Hallak J.E.C., Leite J.P.; Associacß~ao Brasileira de Psiquiatria (ABP). Psychiatric comorbidities in temporal lobe epilepsy: possible relationships between psychotic disorders and involvement of limbic circuits. Rev. Bras. Psiquiatr (2012)34454–466.
7 Toth A., Zaborszky L., Detari L. EEG effect of basal forebrain neuropeptide Y administration in urethane anaesthetized rats. Brain Res. Bull. (2005)6637–42.
8 Constant I., Sabourdin N. The EEG signal: a window on the cortical brain activity. Paediatr Anaesth. (2012)22539–552. 9 Uhlhaas P.J. High-frequency oscillations in schizophrenia.
Clin. EEG Neurosci. (2011)4277–82.
10 Jalili M., Knyazeva M.G. Constructing brain functional networks from EEG: partial and unpartial correlations. J. Integr. Neurosci. (2011)10213–232.
11 Yilmaz A., Schulz D., Aksoy A., Canbeyli R. Prolonged effect of an anesthetic dose of ketamine on behavioral despair. Pharmacol. Biochem. Behav. (2002)71341–344. 12 Arruda M.de.O.V. Activities of the antipsychotic drugs
haloperidol and risperidone on behavioural effects induced by ketamine in mice. Sci. Pharm. (2008) [cited 2016 Mar 26]76 673–687. Available from: https://www.researchgate.net/ publication/240315024_Activities_of_the_Antipsychotic_ Drugs_Haloperidol_and_Risperidone_on_Behavioural_Effects_ Induced_by_Ketamine_in_Mice.
13 Vasconcelos G.S., Ximenes N.C., de Sousa C.N.S., et al. Alpha-lipoic acid alone and combined with clozapine reverses schizophrenia-like symptoms induced by ketamine in mice: participation of antioxidant, nitrergic and neurotrophic mechanisms. Schizophr. Res. (2015) [cited 2015 Jun 29]165 163–170. Available from: http://www.ncbi.nlm.nih.gov/ pubmed/25937462.
14 Monte A.S., de Souza G.C., McIntyre R.S. et al. Prevention and reversal of ketamine-induced schizophrenia related behavior by minocycline in mice: possible involvement of antioxidant and nitrergic pathways. J. Psychopharmacol. (2013)271032–1043.
15 Caixeta F.V., Cornelio A.M., Scheffer-Teixeira R., Ribeiro S., Tort A.B.L. Ketamine alters oscillatory coupling in the hippocampus. Sci. Rep. (2013)32348.
17 Chatterjee M., Ganguly S., Srivastava M., Palit G. Effect of “chronic” versus “acute” ketamine administration and its “withdrawal” effect on behavioural alterations in mice: implications for experimental psychosis. Behav. Brain Res. (2011)216247–254.
18 Newcomer J.W., Farber N.B., Jevtovic-Todorovic V. et al. Ketamine-induced NMDA receptor hypofunction as a model of memory impairment and psychosis.
Neuropsychopharmacology (1999)20106–118.
19 Stone J.M., Morrison P.D., Pilowsky L.S. Review: glutamate and dopamine dysregulation in schizophrenia a synthesis and selective review. J. Psychopharmacol. (2006)21440–452. 20 Kim J.W., Lee Y.S., Han D.H., Min K.J., Lee J., Lee K.
Diagnostic utility of quantitative EEG in un-medicated schizophrenia. Neurosci. Lett. (2015)589126–131. 21 Palenıcek T., Fujakova M., Brunovsk y M. et al.
Electroencephalographic spectral and coherence analysis of ketamine in rats: correlation with behavioral effects and pharmacokinetics. Neuropsychobiology (2011)63202–218. 22 Paxinos G., Watson C. The Rat Brain in Stereotaxic
Coordinates, 4th edn. Academic Press, San Diego, CA, 1998. 23 Magni D.V., Oliveira M.S., Furian A.F. et al. Creatine
decreases convulsions and neurochemical alterations induced by glutaric acid in rats. Brain Res. (2007)1185336–345. 24 Magni D.V., Souza M.A., Oliveira A.P.F. et al.
Lipopolysaccharide enhances glutaric acid-induced seizure susceptibility in rat pups: behavioral and
electroencephalographic approach. Epilepsy Res. (2011)93 138–148.
25 Rao V.S., Carvalho A.C., Trevisan M.T.S. et al. Mangiferin ameliorates 6-hydroxydopamine-induced cytotoxicity and oxidative stress in ketamine model of schizophrenia. Pharmacol. Rep. (2012)64848–856.
26 Min B.-K., Bystritsky A., Jung K.-I. et al. Focused ultrasound-mediated suppression of chemically-induced acute epileptic EEG activity. BMC Neurosci. (2011)1223.
27 Zhang Y., Yoshida T., Katz D.B., Lisman J.E. NMDAR antagonist action in thalamus imposesdoscillations on the hippocampus. J. Neurophysiol. (2012)1073181–3189. 28 John E.R. The neurophysics of consciousness. Brain Res.
Brain Res. Rev. (2002)391–28.
29 Steriade M., McCormick D.A., Sejnowski T.J. Thalamocortical oscillations in the sleeping and aroused brain. Science (1993) 262679–685.
30 Bunney B.G., Potkin S.G., Bunney W.E. New morphological and neuropathological findings in schizophrenia: a
neurodevelopmental perspective. Clin. Neurosci. (1995)381–88. 31 Ganguli R., Reynolds C.F., Kupfer D.J.
Electroencephalographic sleep in young, never-medicated
schizophrenics. A comparison with delusional and nondelusional depressives and with healthy controls. Arch. Gen. Psychiatry (1987)4436–44.
32 Keshavan M.S., Miewald J., Haas G., Sweeney J., Ganguli R., Reynolds C.F. Slow-wave sleep and symptomatology in schizophrenia and related psychotic disorders. J. Psychiatr. Res. (1995)29303–314.
33 Kajimura N., Kato M., Okuma T., Sekimoto M., Watanabe T., Takahashi K. Relationship between delta activity during all-night sleep and negative symptoms in schizophrenia: a preliminary study. Biol. Psychiatry (1996)39451–454. 34 Kato M., Kajimura N., Okuma T. et al. Association between
delta waves during sleep and negative symptoms in schizophrenia. Pharmaco-eeg studies by using structurally different hypnotics. Neuropsychobiology (1999)39165– 172.
35 Leung L.W., Desborough K.A. APV, an N-methyl-D-aspartate receptor antagonist, blocks the hippocampal theta rhythm in behaving rats. Brain Res. (1988)463148–152.
36 Ehlers C.L., Kaneko W.M., Wall T.L., Chaplin R.I. Effects of dizocilpine (MK-801) and ethanol on the EEG and event-related potentials (ERPS) in rats. Neuropharmacology (1992) 31369–378.
37 Kittelberger K., Hur E.E., Sazegar S., Keshavan V., Kocsis B. Comparison of the effects of acute and chronic administration of ketamine on hippocampal oscillations: relevance for the NMDA receptor hypofunction model of schizophrenia. Brain Struct. Funct. (2011)217395–409.
38 Lazarewicz M.T., Ehrlichman R.S., Maxwell C.R., Gandal M.J., Finkel L.H., Siegel S.J. Ketamine modulates theta and gamma oscillations. J. Cogn. Neurosci. (2010)221452–1464. 39 Ehrlichman R.S., Gandal M.J., Maxwell C.R. et al.
N-methyl-d-aspartic acid receptor antagonist–induced frequency oscillations in mice recreate pattern of electrophysiological deficits in schizophrenia. Neuroscience (2009)158705–712. 40 Mizuseki K., Miyawaki H. Hippocampal information
processing across sleep/wake cycles. Neurosci. Res. (2017) [cited 2017 Jul 5]11830–47.
41 Demiralp T., Herrmann C.S., Erdal M.E. et al. DRD4 and DAT1 polymorphisms modulate human gamma band responses. Cereb. Cortex (2007)171007–1019.
42 Baldeweg T., Spence S., Hirsch S.R., Gruzelier J. Gamma-band electroencephalographic oscillations in a patient with somatic hallucinations. Lancet (1998)352620–621.
43 Sampaio L.R., Borges L.T., Barbosa T.M. et al.