AMTD
7, 7397–7450, 2014An intercomparison study of analytical
methods used
K. E. Yttri et al.
Title Page
Abstract Introduction
Conclusions References
Tables Figures
◭ ◮
◭ ◮
Back Close
Full Screen / Esc
Printer-friendly Version Interactive Discussion
Discussion
P
a
per
|
Discus
sion
P
a
per
|
Discussion
P
a
per
|
Discussion
P
a
per
Atmos. Meas. Tech. Discuss., 7, 7397–7450, 2014 www.atmos-meas-tech-discuss.net/7/7397/2014/ doi:10.5194/amtd-7-7397-2014
© Author(s) 2014. CC Attribution 3.0 License.
This discussion paper is/has been under review for the journal Atmospheric Measurement Techniques (AMT). Please refer to the corresponding final paper in AMT if available.
An intercomparison study of analytical
methods used for quantification of
levoglucosan in ambient aerosol filter
samples
K. E. Yttri1, J. Schnelle-Kreiss2, W. Maenhaut3,6, C. Alves4, R. Bossi5, A. Bjerke1, M. Claeys6, C. Dye1, M. Evtyugina4, D. García-Gacio7, A. Gülcin2, R. Hillamo8, A. Hoffer9, M. Hyder10,15, Y. Iinuma11, J.-L. Jaffrezo12, A. Kasper-Giebl13, G. Kiss9, P. L. López-Mahia7, C. Pio4, C. Piot12,16, C. Ramirez-Santa-Cruz13, J. Sciare14, K. Teinilä8, R. Vermeylen6, A. Vicente4, and R. Zimmermann2
1
NILU – Norwegian Institute for Air Research, P.O. Box 100, 2027 Kjeller, Norway
2
Helmholtz Zentrum München, Cooperation group Comprehensive Molecular Analytics, Neuherberg, Germany
3
Department of Analytical Chemistry, Ghent University, 9000 Gent, Belgium
4
Centre for Environmental and Marine Studies, Department of Environment, University of Aveiro, 3810-193 Aveiro, Portugal
5
AMTD
7, 7397–7450, 2014An intercomparison study of analytical
methods used
K. E. Yttri et al.
Title Page
Abstract Introduction
Conclusions References
Tables Figures
◭ ◮
◭ ◮
Back Close
Full Screen / Esc
Printer-friendly Version Interactive Discussion
Discussion
P
a
per
|
Discus
sion
P
a
per
|
Discussion
P
a
per
|
Discussion
P
a
per
|
6
Department of Pharmaceutical Sciences, University of Antwerp, Campus Drie Eiken, 2610 Antwerp, Belgium
7
Group of Analytical Chemistry (QANAP), Institute of Environment (IUMA), Department of Analytical Chemistry, Faculty of Sciences, University of A Coruña, Campus de A Coruña, E, 15071 A Coruña, Spain
8
Finnish Meteorological Institute, Atmospheric Composition Research, Aerosol Research, Erik Palménin Aukio 1, 00560, Helsinki, Finland
9
MTA-PE Air Chemistry Research Group, P.O. Box 158, 8201 Veszprém, Hungary
10
Center for Analysis and Synthesis, Department of Chemistry, Lund University, Sweden
11
Leibniz-Institut für Troposphärenforschung, Permoserstr. 15, 04138 Leipzig, Germany
12
Univ. Grenoble Alpes, LGGE, 38000 Grenoble, France, CNRS, LGGE, 38000 Grenoble, France
13
Institute of Chemical Technologies and Analytics, Vienna University of Technology, Getreidemarkt 9/164, 1060, Vienna
14
Laboratoire des Sciences du Climat et de l’Environnement, CEA-CNRS-UVSQ, 91190 Gif-sur-Yvette, France
15
Pakistan Space and Upper Atmosphere research commission (SUPARCO), Lahore, Pakistan
16
Université de Savoie, LCME, 73376 Le Bourget du lac, France
Received: 16 June 2014 – Accepted: 2 July 2014 – Published: 23 July 2014 Correspondence to: K. E. Yttri ([email protected])
AMTD
7, 7397–7450, 2014An intercomparison study of analytical
methods used
K. E. Yttri et al.
Title Page
Abstract Introduction
Conclusions References
Tables Figures
◭ ◮
◭ ◮
Back Close
Full Screen / Esc
Printer-friendly Version Interactive Discussion
Discussion
P
a
per
|
Discus
sion
P
a
per
|
Discussion
P
a
per
|
Discussion
P
a
per
Abstract
The monosaccharide anhydrides (MAs) levoglucosan, galactosan and mannosan are products of incomplete combustion and pyrolysis of cellulose and hemicelluloses, and are found to be major constituents of biomass burning aerosol particles. Hence, am-bient aerosol particle concentrations of levoglucosan are commonly used to study the
5
influence of residential wood burning, agricultural waste burning and wild fire emissions on ambient air quality. A European-wide intercomparison on the analysis of the three monosaccharide anhydrides was conducted based on ambient aerosol quartz fiber filter samples collected at a Norwegian urban background site during winter. Thus, the samples’ content of MAs is representative for biomass burning particles originating
10
from residential wood burning. The purpose of the intercomparison was to examine the comparability of the great diversity of analytical methods used for analysis of levoglu-cosan, mannosan and galactosan in ambient aerosol filter samples. Thirteen labora-tories participated, of which three applied High-Performance Anion-Exchange Chro-matography (HPAEC), four used High-Performance Liquid ChroChro-matography (HPLC)
15
or Ultra-Performance Liquid Chromatography (UPLC), and six resorted to Gas Chro-matography (GC). The analytical methods used were of such diversity that they should be considered as thirteen different analytical methods. All of the thirteen laborato-ries reported levels of levoglucosan, whereas nine reported data for mannosan and/or galactosan. Eight of the thirteen laboratories reported levels for all three isomers.
20
The accuracy for levoglucosan, presented as the mean percentage error (PE) for each participating laboratory, varied from−63 to 23 %; however, for 62 % of the
labo-ratories the mean PE was within±10 %, and for 85 % the mean PE was within±20 %.
For mannosan, the corresponding range was−60 to 69 %, but as for levoglucosan, the
range was substantially smaller for a subselection of the laboratories; i.e., for 33 % of
25
the laboratories the mean PE was within±10 %. For galactosan, the mean PE for the
participating laboratories ranged from−84 to 593 %, and as for mannosan 33 % of the
AMTD
7, 7397–7450, 2014An intercomparison study of analytical
methods used
K. E. Yttri et al.
Title Page
Abstract Introduction
Conclusions References
Tables Figures
◭ ◮
◭ ◮
Back Close
Full Screen / Esc
Printer-friendly Version Interactive Discussion
Discussion
P
a
per
|
Discus
sion
P
a
per
|
Discussion
P
a
per
|
Discussion
P
a
per
|
The variability of the various analytical methods, as defined by their minimum and maximum PE value, was typically better for levoglucosan than for mannosan and galac-tosan, ranging from 3.2 to 41 % for levoglucosan, from 10 to 67 % for mannosan, and from 6 to 364 % for galactosan. For the levoglucosan to mannosan ratio, which may be used to assess the relative importance of softwood vs. hardwood burning, the variability
5
only ranged from 3.5 to 24 %.
To our knowledge, this is the first major intercomparison on analytical methods used to quantify monosaccharide anhydrides in ambient aerosol filter samples conducted and reported in the scientific literature. The results show that for levoglucosan the ac-curacy is only slightly lower than that reported for analysis of SO24− on filter samples,
10
a constituent that has been analyzed by numerous laboratories for several decades, typically by ion chromatography, and which is considered a fairly easy constituent to measure. Hence, the results obtained for levoglucosan with respect to accuracy are encouraging and suggest that levels of levoglucosan, and to a lesser extent mannosan and galactosan, obtained by most of the analytical methods currently used to quantify
15
monosaccharide anhydrides in ambient aerosol filter samples, are comparable. Finally, the various analytical methods used in the current study should be tested for other aerosol matrices and concentrations as well, the most obvious being summertime aerosol samples affected by wild fires and/or agricultural fires.
1 Introduction
20
The monosaccharide anhydrides (MAs) levoglucosan, galactosan and mannosan are products of the incomplete combustion and pyrolysis of cellulose and hemicelluloses, and are thus constituents of biomass burning (BB) aerosol (Simoneit et al., 1999). The presence of MAs has been demonstrated in emissions from wood combustion (Oros and Simoneit, 1999; Fine et al., 2001; Nolte et al., 2001; Schmidl et al., 2008; Frey et al.,
25
AMTD
7, 7397–7450, 2014An intercomparison study of analytical
methods used
K. E. Yttri et al.
Title Page
Abstract Introduction
Conclusions References
Tables Figures
◭ ◮
◭ ◮
Back Close
Full Screen / Esc
Printer-friendly Version Interactive Discussion
Discussion
P
a
per
|
Discus
sion
P
a
per
|
Discussion
P
a
per
|
Discussion
P
a
per
et al., 2005; Mazzoleni et al., 2007; Sullivan et al., 2008; Alves et al., 2010; Saarnio et al., 2010a; Vicente et al., 2012). Recently, it has been shown that combustion of peat (Iinuma et al., 2007; Kourtchev et al., 2011) as well as of certain types of brown coal (Fabbri et al., 2009) could be additional sources of ambient aerosol concentrations of MAs in regions where such fuels are utilized.
5
Levoglucosan exhibits the highest concentration of the MAs in the BB aerosol; con-sequently, it has been applied for source apportionment of ambient particulate matter (PM). Additional information can be drawn from the PM MAs pattern, e.g., it has been used to estimate the impact from combustion of different wood types; however, no clear picture of the variability of MAs concentrations and ratios from wood combustion
10
has been found. Some studies have reported a high variability depending on burning conditions or type of wood with filtration based sampling (Schmidl et al., 2008; Orasche et al., 2012, 2013) or by application of aerosol mass spectrometry (Weimer et al., 2008; Elsasser et al., 2013). Other studies have shown relatively little variation in MAs emis-sions during wood combustion under varying conditions (Jordan and Seen, 2005; Frey
15
et al., 2009) or with different types of wood (Fine et al., 2001, 2002, 2004). Size distri-bution measurements of MAs in particulate emission samples from wood combustion have shown that most MAs are associated with PM<1.2 µm (Frey et al., 2009). These results are in agreement with wintertime observations showing that most levoglucosan is present in the PM1fraction of the ambient aerosol (Yttri et al., 2005; Agarwal et al.,
20
2010; Krumal et al., 2010).
The atmospheric concentration of levoglucosan is highly variable as it depends not only on the source strength, but also on meteorological parameters. During win-tertime in Europe residential wood burning is the major source of levoglucosan, and the observed concentration is typically <1 µg m−3 (Oliveira et al., 2007; Yttri
25
AMTD
7, 7397–7450, 2014An intercomparison study of analytical
methods used
K. E. Yttri et al.
Title Page
Abstract Introduction
Conclusions References
Tables Figures
◭ ◮
◭ ◮
Back Close
Full Screen / Esc
Printer-friendly Version Interactive Discussion
Discussion
P
a
per
|
Discus
sion
P
a
per
|
Discussion
P
a
per
|
Discussion
P
a
per
|
(Pietrogrande et al., 2013), and concentrations>7 µg m−3have been reported for haze episodes in tropical regions (Claeys et al., 2010; He et al., 2010).
Early investigations suggested that levoglucosan is resistant to atmospheric acid-catalyzed degradation (Fraser and Lakshmanan, 2000). The low vapor pressure of levoglucosan (Oja and Suuberg, 1999; Booth et al., 2011) as well as the minor impact
5
of temperature on the observed volatility of levoglucosan in ambient PM (Ruehl et al., 2011) further support its stability and thus its suitability as a tracer species. Recent in-vestigations on the stability of levoglucosan in aqueous solution suggest that “oxidation of levoglucosan in atmospheric deliquescent particles is at least as fast as that of other atmospherically relevant organic compounds and levoglucosan may not be as stable
10
as previously thought in the atmosphere, especially under high relative humidity con-ditions” (Hoffmann et al., 2010; Teraji and Arakaki, 2010). Further, oligomerization of levoglucosan by Fenton chemistry in aqueous solution has been observed (Holmes and Petrucci, 2007). The decay of levoglucosan upon ageing of wood combustion aerosol has been studied in smog chamber experiments. When exposed to typical summertime
15
OH radical concentrations, the atmospheric lifetime of levoglucosan in BB particles was found to be 0.7–2.2 days (Hennigan et al., 2010) under biomass burning plume condi-tions and estimated to range up to two weeks for atmospheric background condicondi-tions (Slade and Knopf, 2013). The impact of the abovementioned effects on the levoglu-cosan content in the (true) ambient aerosol still remains to be documented; however,
20
these are indications that levoglucosan may be depleted in the atmosphere, and that possible degradation thus should be taken into account when using levoglucosan as a tracer of biomass burning emissions in source apportionment studies. Nonetheless, levoglucosan is a valuable tracer to investigate the impact of residential wood burn-ing in urban (Oliveira et al., 2007; Timonen et al., 2008; Caseiro et al., 2009; Szidat
25
AMTD
7, 7397–7450, 2014An intercomparison study of analytical
methods used
K. E. Yttri et al.
Title Page
Abstract Introduction
Conclusions References
Tables Figures
◭ ◮
◭ ◮
Back Close
Full Screen / Esc
Printer-friendly Version Interactive Discussion
Discussion
P
a
per
|
Discus
sion
P
a
per
|
Discussion
P
a
per
|
Discussion
P
a
per
As levoglucosan is commonly used as a tracer of emissions from biomass combus-tion, increasing efforts have been put into levoglucosan quantification during the last decade. Gas chromatographic (GC) methods were established since the end of the last century, whereas liquid chromatographic methods were more recently developed and are gaining attention. A review of existing methods was published in 2006 (Schkolnik
5
and Rudich, 2006) and derivatization methods for analysis of MAs using GC were cov-ered by Hsu et al. (2007). Thus, only a brief overview on actual existing methods and developments will be given here.
Gas chromatography/mass spectrometry (GC/MS) methods for separation and quantification of MAs are widespread. Most GC methods used for analysis of MAs
10
in environmental samples make use of solvent extraction followed by trimethylsilylation (Simoneit et al., 1999; Pashynska et al., 2002; Simpson et al., 2004; Medeiros and Simoneit, 2007). Reactive pyrolysis, i.e., thermally assisted alkylation of MAs, estab-lished in pyrolysis research (Fabbri et al., 2002), has also been applied to environ-mental samples (Blazso et al., 2003), and more recently, thermal extraction methods
15
have been developed. Lin et al. (2007) investigated solid-phase microextraction for pre-concentration of levoglucosan from filter samples prior to GC analysis, whereas Orasche et al. (2011) developed a method for in situ derivatization of MAs in filter sam-ples followed by GC/MS. The most recent advance was made by Ma et al. (2010), who developed a two-dimensional GC method, which uses heart-cutting and thermal
20
extraction of MAs from filter samples without the need of chemical derivatization. High-performance liquid chromatography combined with mass spectrometry (HPLC/MS) and high-performance anion-exchange chromatography (HPAEC) are the most commonly used methods for analysis of MAs in extracts based on polar sol-vents. Methods such as capillary electrophoresis with pulsed amperometric detection
25
AMTD
7, 7397–7450, 2014An intercomparison study of analytical
methods used
K. E. Yttri et al.
Title Page
Abstract Introduction
Conclusions References
Tables Figures
◭ ◮
◭ ◮
Back Close
Full Screen / Esc
Printer-friendly Version Interactive Discussion
Discussion
P
a
per
|
Discus
sion
P
a
per
|
Discussion
P
a
per
|
Discussion
P
a
per
|
to be widely applied to MA analysis. Gao et al. (2003) were the first to report the use of electrospray ionization-mass spectrometry (ESI-MS) for quantification of MAs, and, at present, HPLC combined with mass spectrometric (Dye and Yttri, 2005; Larsen et al., 2006; Wan and Yu, 2007; Piot et al., 2012) or aerosol charge detection (HPLC-ACD) (Dixon and Baltzell, 2006) are widespread. HPAEC coupled with pulsed
amperomet-5
ric detection (PAD) (Engling et al., 2006; Caseiro et al., 2007; Iinuma et al., 2009; Piazzalunga et al., 2010) or with mass spectrometric detection (HPAEC-MS) (Saarnio et al., 2010b) have been employed more recently.
The objective of the current intercomparison was to examine the comparability of the great diversity of analytical methods used for analysis of levoglucosan, mannosan and
10
galactosan in ambient aerosol filter samples.
2 Experimental
2.1 Site description and measurement period
Aerosol filter samples were collected at the urban background site Kjeller (59◦58′N, 11◦3′E), on the outskirts of the small town of Lillestrøm (20 000 inhabitants), located
15
20 km east of Oslo (Norway). The samples were collected during the period 11–16 De-cember 2008. The sampling inlets were installed approximately 4 m a.g.l.
2.2 Aerosol filter samples collection, storage, preparation, and shipment
Six ambient aerosol filter samples were provided using two high-volume samplers with Total Suspended Particulate Matter (TSP) inlets collecting aerosols on quartz fibre
20
filters (Munktel MK 360; 150 mm in diameter, batch number 403743). The instruments were operated at a flow rate of 21.5 m3h−1. The sampling time ranged from 24 to 48 h. After exposure, the filter samples were folded once, with the exposed side facing inwards, wrapped in aluminium foil, put in a zip-lock polyethylene bag and stored in a freezer at−18◦C to prevent any form of degradation of the analytes. Two field blanks
AMTD
7, 7397–7450, 2014An intercomparison study of analytical
methods used
K. E. Yttri et al.
Title Page
Abstract Introduction
Conclusions References
Tables Figures
◭ ◮
◭ ◮
Back Close
Full Screen / Esc
Printer-friendly Version Interactive Discussion
Discussion
P
a
per
|
Discus
sion
P
a
per
|
Discussion
P
a
per
|
Discussion
P
a
per
were collected, which were treated in exactly the same manner regarding handling, transport and storage as the filters being exposed.
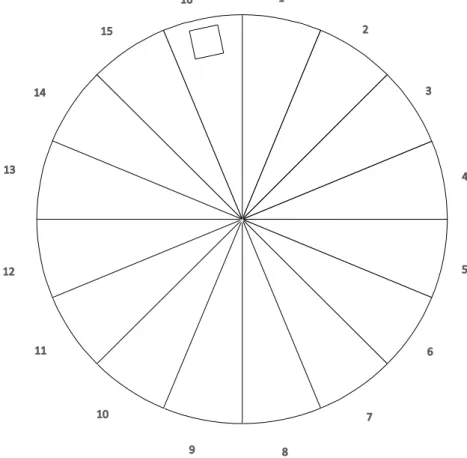
Each of the sampled filter samples was divided into 16 equally large sectors, pro-viding a total of 96 sectors, each sector with an exposed area of 9.6 cm2. A 1.0 cm2 punch was taken from each of the 16 sectors to perform a homogeneity test of the
5
filters subjected to the intercomparison (Sect. 2.4.1). Hence, each of the sectors sent to the participating laboratories had an exposed filter area of 8.6 cm2(Fig. 1).
Each sector was given a number, which combined with the filter sample identifica-tion gave the sector a unique identificaidentifica-tion. The sectors were then assigned to the participating laboratories following a randomizing approach.
10
For shipment, each sector was wrapped in aluminium foil and placed in a petrislide. The six petrislides to be received by each of the participating laboratories were placed in a zip-lock polyethylene bag and sent in an envelope to the participants by mail. Those receiving the samples were directed to store them in a freezer at−18◦C until analysis.
The deadline for reporting the results was set to be within 70 days after shipment.
15
2.3 The data set – background, scope, and application
Fifteen laboratories located in twelve different European countries reported their inter-est in the current intercomparison exercise and received sectors from the filter samples for analysis. Two of the fifteen laboratories did not submit results. Hence, the results presented in the current study are based on the results of thirteen different
laborato-20
ries. All thirteen laboratories reported levels for levoglucosan, whereas nine reported levels for mannosan and galactosan. Eight of thirteen laboratories reported levels for all three isomers, whereas one reported for levoglucosan and mannosan, and one for levoglucosan and galactosan.
A brief overview of the various analytical methods used by the participating
labora-25
AMTD
7, 7397–7450, 2014An intercomparison study of analytical
methods used
K. E. Yttri et al.
Title Page
Abstract Introduction
Conclusions References
Tables Figures
◭ ◮
◭ ◮
Back Close
Full Screen / Esc
Printer-friendly Version Interactive Discussion
Discussion
P
a
per
|
Discus
sion
P
a
per
|
Discussion
P
a
per
|
Discussion
P
a
per
|
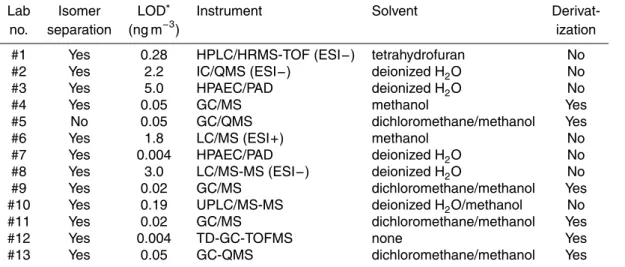
separation and detection of the analytes, the solvent(s) used for extraction and whether derivatization of the analytes was applied. Complementary information can be found in Table B1, including extraction procedure, derivatization agent, and recovery stan-dard. A full description of the various analytical methods can be found in Appendix A: in Sect. A1 for those using HPAEC, Sect. A2 for those using HPLC and UPLC and
5
Sect. A3 for those applying GC.
All of the major methods used for analysis of levoglucosan, mannosan and galac-tosan in ambient aerosol filter samples, and which have been reported in the scientific literature so far, are represented in the present intercomparison. This adds additional strength to any conclusion to be drawn from the study. In addition, the descriptions of
10
the various methods show that none of them can be considered completely identical; i.e., they differ to a large extent with respect to crucial parameters, such as, e.g., ex-traction procedure and derivatization agent, to fulfill such a criterion. This, however, brings an important asset to the intercomparison, as the goal is to evaluate the com-parability of the great diversity of analytical methods used for analysis of levoglucosan,
15
mannosan and galactosan in ambient aerosol filter samples. On the contrary, this great diversity prevents comparison of the performance of different subclasses of analytical methods, e.g., GC- vs. LC-based methods.
2.4 Quality assurance
2.4.1 Homogenity of filter samples
20
A uniformity test was performed to ensure that the two co-located filter samplers gen-erated samples with a homogenous distribution of the analytes.
Each of the six filter samples analyzed in the intercomparison was divided into 16 equally large sectors. From each sector one 1.0 cm2punch was taken and subjected to levoglucosan, mannosan and galactosan analysis using the analytical method applied
25
AMTD
7, 7397–7450, 2014An intercomparison study of analytical
methods used
K. E. Yttri et al.
Title Page
Abstract Introduction
Conclusions References
Tables Figures
◭ ◮
◭ ◮
Back Close
Full Screen / Esc
Printer-friendly Version Interactive Discussion
Discussion
P
a
per
|
Discus
sion
P
a
per
|
Discussion
P
a
per
|
Discussion
P
a
per
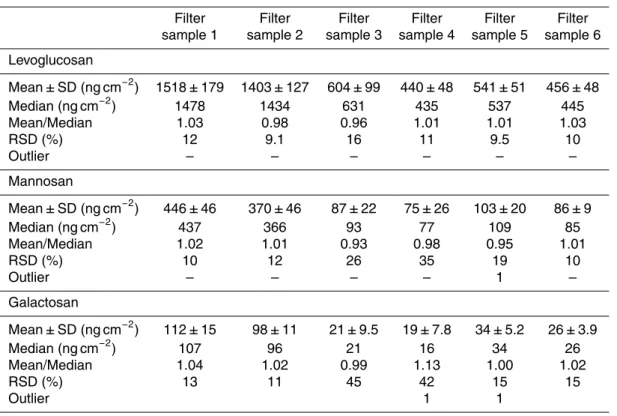
for each of the three isomers. The results from this uniformity test are shown in Table B2 and are briefly summarized as follows.
For levoglucosan, the mean relative standard deviation (RSD) for all six filter samples was 11±2.7 %. The highest RSD was observed for filter sample 3 (16 %) and the
lowest for filter sample 2 (9.1 %). For mannosan, the mean RSD was 19±9.9 %, with
5
the lowest RSD for filter sample 1 (10 %) and the highest for filter sample 4 (35 %). For galactosan, the mean RSD was 24±15 %, with the lowest RSD for filter sample
2 (11 %) and the highest for filter sample 3 (45 %). Note that the percentage provided for the RSD also includes the uncertainty of the analytical method (which is <5 %); hence, the filter homogeneity is in fact up to 5 % lower than that stated above. Two
10
outliers were detected for galactosan (one in filter sample 4 and one in filter sample 5, respectively) and one for mannosan (filter sample 5), when running the Grubbs test for outliers. These outliers did not affect the results of the intercomparison, as the sectors from which they were taken were sent out to laboratories which either did not submit results at all or which did not submit results for mannosan (lab. 13), or the sector
15
was not assigned to any of the participating laboratories. Consequently, the results from the homogeneity test demonstrate that the collected filter samples are sufficiently homogenous to be used for an intercomparison.
Finally, it can be questioned to which extent a 1.0 cm2 punch from each sector is representative for addressing the homogeneity of the filter samples as it accounts for no
20
more than 10 % of the total exposed filter area. However, the size of the punch used for the homogeneity test should not compromise the participation of various laboratories using analytical methods with detection limits varying over a wide range.
2.4.2 Outliers – Grubbs test
The Grubbs test was used to detect outliers amongst the results submitted by the
25
AMTD
7, 7397–7450, 2014An intercomparison study of analytical
methods used
K. E. Yttri et al.
Title Page
Abstract Introduction
Conclusions References
Tables Figures
◭ ◮
◭ ◮
Back Close
Full Screen / Esc
Printer-friendly Version Interactive Discussion
Discussion
P
a
per
|
Discus
sion
P
a
per
|
Discussion
P
a
per
|
Discussion
P
a
per
|
same laboratory (lab. 9). No outliers were observed for mannosan. Values defined as outliers were excluded from calculation of the “theoretical” median value, but included in the “measured” arithmetic mean value (see Sect. 2.5 for explanation of “theoretical” and “measured” value).
2.4.3 Samples with levels below limit of detection
5
Two laboratories (lab. 3 and 8) reported values of galactosan below the established detection limit of their analytical method for filter samples 3–6. These values were not included in the calculated “theoretical” median value nor in the “measured” mean value.
2.5 Calculation of the analytical methods performance
The outcomes of the intercomparison are presented in Figs. 2–4 as aggregated results,
10
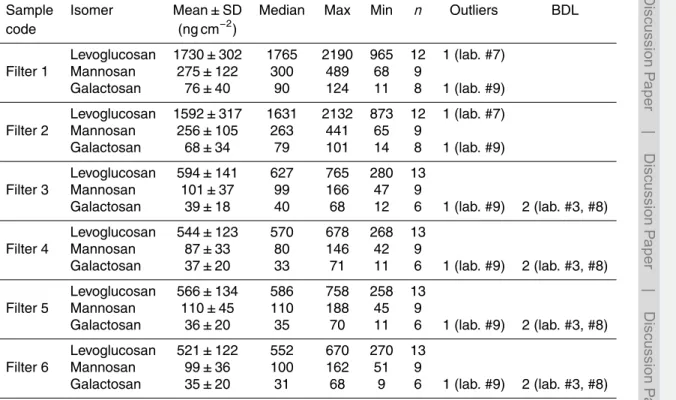
whereas the aggregated data reported by the laboratories, which are used as input for Figs. 2–4, are listed in Table B3. The results are presented in terms of the percentage error (PE); i.e., the PE was calculated for each of the participating laboratories for each of the six filter samples according to Eq. (1). The arithmetic mean PE for each laboratory, accounting for all six filters, was then subsequently calculated (Figs. 2–4).
15
Percentage error (PE)=measured−theoretical
theoretical ×100 (1)
where “measured” is the value of the analyte, e.g., levoglucosan, reported by the actual laboratory for one of the six filter samples and which is having its accuracy tested vs. the “theoretical” value. The latter value is the median value of the analyte based on the values reported by all participating laboratories (except outliers as described above).
20
AMTD
7, 7397–7450, 2014An intercomparison study of analytical
methods used
K. E. Yttri et al.
Title Page
Abstract Introduction
Conclusions References
Tables Figures
◭ ◮
◭ ◮
Back Close
Full Screen / Esc
Printer-friendly Version Interactive Discussion
Discussion
P
a
per
|
Discus
sion
P
a
per
|
Discussion
P
a
per
|
Discussion
P
a
per
The isomer splits, showing the relative contribution of each of the three monosac-charide anhydrides to the sum of the three monosacmonosac-charide anhydrides (ΣMA), and the levoglucosan to mannosan ratio are shown in Figs. 5–8 as aggregated results, whereas the aggregated data, based on those reported by the laboratories, are listed in Table B4. The results are discussed in detail in Sect. 3.
5
2.6 Analytical standard compounds
A different quality of standard compounds is a factor potentially affecting the compa-rability of an intercomparison. Results obtained using standard compounds without a given purity is of particular concern, but also batch-to-batch inconsistency is of po-tential importance.
10
In the present study, quantification standards of levoglucosan from three different manufacturers were employed, ranging from >98 to 99 % purity. For mannosan the range of purity was 98 % to “purity not given” for standards purchased from three dif-ferent manufacturers. One of the laboratories (lab. 11) used the levoglucosan standard also for mannosan and galactosan. The purity of the galactosan standards was “not
15
provided” for all, except for that used by lab. 9 (98 % purity) and lab. 13 (99 % purity). Nine (lab. 1, 2, 4, 5, 6, 9, 11, 12, 13) out of the thirteen laboratories used an inter-nal standard, but only eight (lab. 1, 2, 4, 5, 6, 9, 11, 12) of them used it to account for potential loss of analytic compounds during clean up. 13C6-labeled levoglucosan with a 98–99 % purity, purchased from two different manufacturers, was used by four
20
laboratories (lab. 1, 2, 6, 12), whereas2H7-labeled levoglucosan (99 % purity) (lab. 9), 13
C6-labeled galactosan (purity not known) (lab. 1), 2
H4-labeled succinic acid (98 % purity) (lab. 5),O-L-xylanopyranoside (99 % purity) (lab. 4) and sedoheptulose (>99 % purity) (lab. 11) were each used by one laboratory. Laboratory 13 used the internal standard (1-phenyldodecane, 99 % purity) to account for uncertainties in the injection
25
AMTD
7, 7397–7450, 2014An intercomparison study of analytical
methods used
K. E. Yttri et al.
Title Page
Abstract Introduction
Conclusions References
Tables Figures
◭ ◮
◭ ◮
Back Close
Full Screen / Esc
Printer-friendly Version Interactive Discussion
Discussion
P
a
per
|
Discus
sion
P
a
per
|
Discussion
P
a
per
|
Discussion
P
a
per
|
3 Results and discussion
3.1 Levoglucosan
The median theoretical concentration of levoglucosan, calculated based on the val-ues reported by the laboratories performing analysis of the actual compound, ranged from 552 ng cm−2 (filter sample 6) to 1765 ng cm−2 (filter sample 1) (Table B3). This
5
range corresponds to an ambient concentration of levoglucosan ranging from 120– 384 ng m−3, if obtained by a typical low volume sampler operating at flow rate of 38 L min−1for 24 h, assuming an exposed filter area of 12 cm2. This is within the range (60–900 ng m−3) observed for European urban areas during wintertime sampling, as reported by Szidat et al. (2009).
10
For the laboratories extracting, analyzing and reporting values for two or more aliquots pr. sector, the repeatability was on average 4.5±2.9 %. The repeatability
ex-ceeded 10 % for three of the 54 sectors, each of the three being analyzed by different laboratories (lab. 1, 3, and 13).
From Fig. 2 it can be seen that the mean PE for the various analytical methods
15
ranged from −63 to 20 %, i.e., reflecting the accuracy of the various methods. The
lowest mean PE was seen for lab. 7, for which two outliers were detected. When ex-cluding these results from the calculation, the mean PE for lab. 7 improved from−63
to−54 %, and thus also the total range including all the methods. The mean PE was
within ±10 % for eight (lab. 2, 3, 4, 6, 10, 11, 12, and 13) of the thirteen
laborato-20
ries, i.e., for 62 % of the laboratories, which should be considered a narrow range, and within ±20 % for eleven (lab. 1, 2, 3, 4, 5, 6, 9, 10, 11, 12, 13) of the thirteen
laboratories, corresponding to 85 %. Indeed, the accuracy reported for levoglucosan analysis is only slightly lower than the results reported for analysis of SO24− on filter samples during the latest intercomparison (intercomparison number 30) organized by
25
EMEP (http://www.nilu.no/projects/ccc/intercomparison/DQO-luft-30.pdf); i.e., an ac-curacy ranging from−23 to 40 % for the entire dataset of 64 laboratories, and from−6
AMTD
7, 7397–7450, 2014An intercomparison study of analytical
methods used
K. E. Yttri et al.
Title Page
Abstract Introduction
Conclusions References
Tables Figures
◭ ◮
◭ ◮
Back Close
Full Screen / Esc
Printer-friendly Version Interactive Discussion
Discussion
P
a
per
|
Discus
sion
P
a
per
|
Discussion
P
a
per
|
Discussion
P
a
per
samples has been analyzed by numerous laboratories for several decades, typically by ion chromatography, and should be considered as a fairly easy constituent to analyze. Hence, the comparable results obtained for levoglucosan with respect to accuracy are encouraging.
In Figs. 2–4 the error bars represent the minimum and the maximum PE observed
5
for the six samples analyzed with the respective analytical method. Hence, the range is a measure of the variability of the analytical method; i.e., the smaller the range, the better. For levoglucosan (Fig. 2) the variability ranged from 3.2 to 41 %. Two of the laboratories had a mean PE exceeding−40 %. For lab. 7 the low accuracy was
accom-panied by a large variability (30 %), whereas this was not the case for lab. 8 (6.5 %). For
10
lab. 7 the combination of a low accuracy and a large variability could suggest an instru-ment malfunction rather than a flaw in the analytical method used. However, two of the samples reported by this laboratory were outliers, and when excluded from the calcu-lation, the variability improved substantially (i.e., a variability of 5 %), thus a systematic underestimation could not be excluded. It should be noted that lab. 7 later found that
15
their instrument suffered from a technical problem that caused a random loss of signals during the sample analysis. Subsequent tests revealed that previous injections of high salt-containing samples (i.e., seawater) had contaminated the instrument. The prob-lem was resolved by a rigorous cleaning of instrument components, including working electrode, tubing, and fittings. Nevertheless, only two of the samples reported by this
20
laboratory were considered outliers when tested; hence, the results reported from this laboratory should be included in the current dataset. There were also other laborato-ries experiencing difficulties of various categories during the intercomparison; e.g., lab. 1 experienced possible ion suppression, mainly of levoglucosan, which was not previ-ously observed using the actual method, causing negatively biased concentrations as
25
AMTD
7, 7397–7450, 2014An intercomparison study of analytical
methods used
K. E. Yttri et al.
Title Page
Abstract Introduction
Conclusions References
Tables Figures
◭ ◮
◭ ◮
Back Close
Full Screen / Esc
Printer-friendly Version Interactive Discussion
Discussion
P
a
per
|
Discus
sion
P
a
per
|
Discussion
P
a
per
|
Discussion
P
a
per
|
of certain problems for one laboratory but not for others cannot easily be done without introducing additional flaws to the dataset.
Despite that the great diversity of the analytical methods prevents us from comparing the performance of different subclasses of analytical methods, it cannot be neglected that a certain pattern emerges from Fig. 2. Five out of the six GC-based methods
5
participating in the intercomparison had a mean PE above the theoretical value, rang-ing from 2.8–20 %. Furthermore, four of these five GC methods were based on the approach initially developed in the USA, which subsequently has been adopted by European research laboratories, involving separation by GC, detection by mass spec-trometry, extraction by methanol or dichloromethane, or a combination of the two, as
10
well as derivatization to improve the (gas) chromatographic behavior of the analyte. Despite a certain variation between laboratories, the general approach outlined above is by far the most commonly used one for analyzing levoglucosan within the research community and it also has the longest record of use. Hence, refinement and experi-ence in using this method is expected to be more extensive than for the more recently
15
developed LC and IC methods, for which the mean PE was below the theoretical value for five of seven methods (−63 to −1.9 %) (Fig. 2). Consequently, we should not
ex-clude the possibility that the experience associated with a more widespread analytical method could have a profound influence on the observed pattern, and that this might be an equally important factor as any differences attributed to the choice of the
ana-20
lytical method itself. Given that the more recently developed LC and IC methods have been taken into service on a wider scale than at the time of the current intercompar-ison, a follow-up intercomparison should address any potential change in the pattern seen in Fig. 2 of the current study.
3.2 Mannosan
25
AMTD
7, 7397–7450, 2014An intercomparison study of analytical
methods used
K. E. Yttri et al.
Title Page
Abstract Introduction
Conclusions References
Tables Figures
◭ ◮
◭ ◮
Back Close
Full Screen / Esc
Printer-friendly Version Interactive Discussion
Discussion
P
a
per
|
Discus
sion
P
a
per
|
Discussion
P
a
per
|
Discussion
P
a
per
to an ambient concentration of mannosan ranging from 17–65 ng m−3, if obtained by a typical low volume sampler operating at flow rate of 2.3 m3h−1for 24 h, assuming an exposed filter area of 12 cm2.
For the laboratories extracting, analyzing and reporting values of mannosan for two or more aliquots pr. sample, the repeatability was on average 5.2±3.9 %. The
repeata-5
bility exceeded 10 % for three of the 36 samples, and was reported by two different laboratories (lab. 8, 9).
The mean PE, representing the accuracy, ranged from−60 to 69 % for the various
analytical methods reporting values for mannosan (Fig. 3). This range is noticeably wider than that seen for levoglucosan (−63 to 20 %), and whereas 62 % of the
laborato-10
ries reported a mean PE within±10 % for levoglucosan, the corresponding percentage
for mannosan was only 33 (i.e. for lab. 6, 10, and 11). 55 % of the laboratories reported a mean PE within±23 % for mannosan (lab. 2, 4, 6, 10, and 11).
As described in Sect. 3.1, the “error bars” in Figs. 2–4 represent the minimum and the maximum PE observed for the actual analytical method, and thus the range is a
mea-15
sure of the variability of the analytical method. For mannosan the variability ranged from 9.3 to 38 %, which is a slightly smaller range than that seen for levoglucosan. For five of the nine laboratories (lab. 2, 3, 4, 8, and 11) reporting values for both levoglu-cosan and mannosan the variability was substantially higher, i.e., a factor of 2–6 for mannosan compared to levoglucosan. For two of the laboratories the difference was
20
only minor (lab. 9) or non-existing (lab. 7), whereas laboratories 6 and 10 had a slightly lower variability for mannosan compared to levoglucosan.
The three GC-based methods used to determine levels of mannosan had a mean PE above the theoretical value, ranging from 2.4–69 %, thus reflecting the general pattern seen for levoglucosan, whereas it ranged from below to above the theoretical values
25
AMTD
7, 7397–7450, 2014An intercomparison study of analytical
methods used
K. E. Yttri et al.
Title Page
Abstract Introduction
Conclusions References
Tables Figures
◭ ◮
◭ ◮
Back Close
Full Screen / Esc
Printer-friendly Version Interactive Discussion
Discussion
P
a
per
|
Discus
sion
P
a
per
|
Discussion
P
a
per
|
Discussion
P
a
per
|
3.3 Galactosan
The median theoretical concentration of galactosan, calculated based on the values reported by the laboratories performing analysis of the actual compound, ranged from 31 ng cm−2 (filter sample 6) to 90 ng cm−2 (filter sample 1). This range corresponds to an ambient concentration of galactosan ranging from 7–20 ng m−3, if obtained by
5
a typical low volume sampler operating at flow rate of 2.3 m3h−1for 24 h, assuming an exposed filter area of 12 cm2.
For the laboratories extracting, analyzing and reporting values for two or more aliquots pr. sample, the repeatability was on average 8.5±11 %. The repeatability
ex-ceeded 10 % for eleven of the 34 samples, and was reported by five different
laborato-10
ries (lab. 2, 3, 8, 9, and 11).
The mean PE, representing the accuracy, ranged from−84 to 593 % for the various
analytical methods reporting values for galactosan. This range is noticeably wider than that seen for both levoglucosan (−63 to 20 %) and mannosan (−60 to 69 %). The very
high mean PE (593 %) seen for lab. 9 is consistent with the finding that all values of
15
galactosan reported by this laboratory were found to be outliers. When excluding these data from the calculation, the mean PE range is substantially narrowed (−84–68 %),
but it is still wider than for the two other isomers. Excluding the two outliers reported by lab. 7 did not have an influence on the mean PE range including all laboratories, and it only marginally improved the mean PE for lab. 7, going from−74 to−70 %. 33 % of
20
the laboratories (lab. 4, 10, and 11) reported a mean PE for galactosan within±10 %.
This equals the percentage found for mannosan, but it is substantially lower than that observed for levoglucosan (62 %). 55 % of the laboratories (lab. 2, 3, 4, 10, and 11) reported a mean PE within±22 % for galactosan. It should be noted that for lab. 3 and
8 the mean PE is based on the results from only two of the six filter samples, as the
25
value was found to be below the detection limit for the other four.
AMTD
7, 7397–7450, 2014An intercomparison study of analytical
methods used
K. E. Yttri et al.
Title Page
Abstract Introduction
Conclusions References
Tables Figures
◭ ◮
◭ ◮
Back Close
Full Screen / Esc
Printer-friendly Version Interactive Discussion
Discussion
P
a
per
|
Discus
sion
P
a
per
|
Discussion
P
a
per
|
Discussion
P
a
per
a measure of the variability. For galactosan the variability ranged from 6 to 364 % when including all laboratories. For the subselection of laboratories not influenced by outliers or levels below the detection limit, the variability ranged from 16 to 112 %. For the latter subcategory of laboratories the variability for galactosan was better than that seen for mannosan for two of the laboratories (lab. 10 and 11) and poorer for the two others
5
(lab. 2 and 4). For lab. 10, the variability was noticeably better for galactosan (16 %) also when compared to levoglucosan (41 % and 31 % for levoglucosan and mannosan, respectively).
3.4 Relative contribution of levoglucosan, mannosan and galactosan to the
sum of the three isomeric compounds (ΣMA)
10
3.4.1 Levoglucosan toΣMA ratio
The median theoretical relative contribution of levoglucosan toΣMA ranged from 81– 83 % for the eight laboratories from which this ratio could be derived (Table B4); i.e., laboratories not affected by outliers of any of the three isomers or by levels below the detection limit (Table B3). The levoglucosan to ΣMA ratio did not vary substantially
15
between the laboratories included in the abovementioned subcategory. The largest difference was observed for filter sample 1 for which lab. 3 and lab. 10 reported a value of 81 % and lab. 8 a value of 87 %. This rather small difference is to be expected given that levoglucosan is by far the major MA of the three isomeric compounds reported in the literature. Lab. 7 reported values of levoglucosan for filter sample 1 and 2, which
20
were found to be outliers; however, the levoglucosan to ΣMA ratio for these two filter samples (80 %) did not differ substantially from that of filter samples 3–6 (82–84 %), nor from the subcategory not affected by outliers. For lab. 9 the levoglucosan toΣMA ratio ranged from 57–69 %, which is substantially lower than for the other laboratories. Indeed, lab. 9 reported levels of galactosan for filter samples 1–6, which all were found
25
AMTD
7, 7397–7450, 2014An intercomparison study of analytical
methods used
K. E. Yttri et al.
Title Page
Abstract Introduction
Conclusions References
Tables Figures
◭ ◮
◭ ◮
Back Close
Full Screen / Esc
Printer-friendly Version Interactive Discussion
Discussion
P
a
per
|
Discus
sion
P
a
per
|
Discussion
P
a
per
|
Discussion
P
a
per
|
(Fig. 3). Despite the fact that lab. 9 also reported the highest mean concentration of levoglucosan, the mean PE (20 %) was lower for this isomer than for the two others; hence, the lower levoglucosan toΣMA ratios seen for lab. 9 can likely be attributed to an overestimation of mannosan and galactosan.
The mean PE, representing the accuracy, ranged from−22 to 3.2 % for the various
5
laboratories for which the levoglucosan toΣMA could be derived (Fig. 5). When exclud-ing lab. 9, which reported outliers for filter samples 1–6 with respect to galactosan, this range is substantially reduced (−2.4 to 3.2 %). Excluding the two outliers detected for
lab. 7 only had a minor effect on the mean PE for the actual laboratory, going from−0.4 to−0.6 %.
10
As described in Sects. 3.1–3.3, the error bars in Figs. 2–8 represent the minimum and the maximum PE observed for the actual analytical method, and thus are a mea-sure of the method’s variability. For the levoglucosan toΣMA ratio the variability ranged from 0.9 to 13 % when including all laboratories. For the subselection of laboratories not influenced by outliers, the variability ranged from 0.9 to 4.8 %.
15
3.4.2 Mannosan toΣMA ratio
The median theoretical relative contribution of mannosan toΣMA ranged from 13–14 % for the laboratories from which this ratio could be derived; i.e., laboratories not affected by outliers of either of the three isomers or by levels below the detection limit. The mannosan toΣMA ratio did not vary substantially between the laboratories included in
20
the abovementioned subcategory. The largest difference was observed for filter sample 1 for which lab. 2 reported a value of 11 % and lab. 1 and 3 a value of 15 %. Lab. 7 reported values of levoglucosan for filter samples 1 and 2, which were considered outliers, hence, potentially affecting theΣMA value and the mannosan toΣMA ratio. The mannosan toΣMA ratio for these two filter samples (16 %) did not differ substantially
25
AMTD
7, 7397–7450, 2014An intercomparison study of analytical
methods used
K. E. Yttri et al.
Title Page
Abstract Introduction
Conclusions References
Tables Figures
◭ ◮
◭ ◮
Back Close
Full Screen / Esc
Printer-friendly Version Interactive Discussion
Discussion
P
a
per
|
Discus
sion
P
a
per
|
Discussion
P
a
per
|
Discussion
P
a
per
ratio (14–17 %) did not experience a similar decrease as the levoglucosan to ΣMA ratio due to the substantially elevated concentrations of galactosan; on the contrary, they were in the upper range and above that seen for the subcategory not affected by outliers; i.e., the mean PE of 69 % seen for lab. 9 with respect to mannosan seems to have counteracted this.
5
The mean PE, representing the accuracy, ranged from −17 to 8 % for the various
laboratories for which the mannosan toΣMA could be derived (Fig. 6). Excluding lab. 9, which reported outliers for filter samples 1–6 with respect to galactosan, and lab. 7, which reported outliers for filters 1 and 2 for levoglucosan, did not have an influence on the reported range. Excluding the two outliers detected for lab. 7 improved the mean
10
PE for the actual laboratory from 7.4 to 3.4 %.
As previously described, the error bars in Figs. 2–8 represent the minimum and the maximum PE observed for the actual analytical method, and thus are a measure of the method’s variability. For the mannosan toΣMA ratio the variability ranged from 2 to 20 % when including all laboratories. The range did not change for the subselection of
15
laboratories not influenced by outliers.
3.4.3 Galactosan toΣMA ratio
The median theoretical relative contribution of galactosan to ΣMA ranged from 3.9– 5.0 % for the laboratories from which this ratio could be derived; i.e., laboratories not affected by outliers of either of the three isomers or by levels below the detection limit.
20
The galactosan toΣMA ratio varied more between laboratories than seen for the two other isomers considering the above mentioned subcategory. The largest difference was observed for filter sample 1 for which lab. 2 reported a value of 6.3 % and lab. 8 a value of 1.0 %. Lab. 7 reported values of levoglucosan for filter samples 1 and 2, which were considered outliers, hence, potentially affecting theΣMA value and the
25
AMTD
7, 7397–7450, 2014An intercomparison study of analytical
methods used
K. E. Yttri et al.
Title Page
Abstract Introduction
Conclusions References
Tables Figures
◭ ◮
◭ ◮
Back Close
Full Screen / Esc
Printer-friendly Version Interactive Discussion
Discussion
P
a
per
|
Discus
sion
P
a
per
|
Discussion
P
a
per
|
Discussion
P
a
per
|
reported levels of galactosan for filter samples 1–6 which all were found to be outliers. The elevated levels reported by lab. 9 with respect to galactosan also had an effect on the galactosan toΣMA ratio, which ranged from 17 to 27 %, being substantially higher than for the subcategory not affected by outliers.
The mean PE, representing the accuracy, ranged from−70 to 389 % for the various
5
laboratories for which the galactosan toΣMA could be derived (Fig. 7). Excluding lab. 9, which reported outliers for filter samples 1–6 with respect to galactosan, substantially narrowed the range (−70–45 %), whereas no change was observed when excluding
lab. 7, which reported outliers for filter samples 1 and 2 for levoglucosan. Excluding the two outliers detected for lab. 7 changed the mean PE for the actual laboratory from
10
−22 to−26 %. It should be noted that for lab. 8, the mean PE (−70 %) is based on filter
samples 1 and 2 only, as galactosan for filter samples 3–6 was found to be below the detection limit.
The “error bars” in Figs. 2–8 represent the minimum and the maximum PE observed for the actual analytical method, and thus are a measure of the method’s variability.
15
For the galactosan toΣMA ratio the variability ranged from 6 to 257 % when including all laboratories. The range was substantially narrowed (6–56 %) when excluding lab. 9, which reported outliers for filter samples 1–6 with respect to galactosan. Excluding lab. 7, which reported outliers for filter samples 1 and 2 for levoglucosan, did not have an effect on the total range.
20
3.5 The levoglucosan to mannosan ratio
The levoglucosan to mannosan ratio is occasionally used to apportion the amount of the residential wood burning emissions to burning of either soft- or hardwood (Caseiro et al., 2009; Favez et al., 2010; Piazzalunga et al., 2011; Maenhaut et al., 2012), with softwood combustion giving rise to low ratios (<4) and hardwood to high ratios (14–
25
AMTD
7, 7397–7450, 2014An intercomparison study of analytical
methods used
K. E. Yttri et al.
Title Page
Abstract Introduction
Conclusions References
Tables Figures
◭ ◮
◭ ◮
Back Close
Full Screen / Esc
Printer-friendly Version Interactive Discussion
Discussion
P
a
per
|
Discus
sion
P
a
per
|
Discussion
P
a
per
|
Discussion
P
a
per
%spruce=(14.8−levoglucosan/mannosan)/0.112 (2)
where levoglucosan/mannosan is the levoglucosan to mannosan ratio in the ambient aerosol.
This equation was derived from data that were obtained for the combustion of
com-5
mon hardwood (beech and oak) and softwood species (spruce and larch) in wood stoves in Austria. Beside differences in the levoglucosan to mannosan ratio between various soft- and hardwood species, the uncertainty of the analytical methods used to quantify levoglucosan and mannosan is an unknown variable potentially contributing to the overall uncertainty when performing the soft- and hardwood attribution.
10
The median levoglucosan to mannosan ratio did not vary much between the six filter samples collected, ranging from 5.3–6.2 (Table B4), suggesting a rather stable compo-sition of the wood burnt that impacted the sampling site. When comparing the labora-tories from which this ratio could be extracted; i.e., laboralabora-tories not affected by outliers for either of the two isomers or by levels below the detection limit, the largest diff
er-15
ence observed was seen for filter sample 5 for which lab. 2 reported a levoglucosan to mannosan ratio of 6.9 and lab. 9 a value of 3.6. Lab. 7 reported values of levoglucosan for filter samples 1 and 2, which were considered outliers, thus potentially affecting the levoglucosan to mannosan ratio. The levoglucosan to mannosan ratio for these two filter samples (4.9–5.0) was in the lower range of that of filter samples 3–6 (5.1–6.5),
20
as well as being lower compared to the subcategory not affected by outliers.
The mean PE, representing the accuracy, ranged from−26 to 23 % for the various
analytical methods from which the levoglucosan to mannosan ratio could be derived (Fig. 8). 78 % of the laboratories (lab. 3, 4, 6, 7, 8, 10, and 11) reported a mean PE for the levoglucosan to mannosan ratio within±7 %, which should be considered quite
25
AMTD
7, 7397–7450, 2014An intercomparison study of analytical
methods used
K. E. Yttri et al.
Title Page
Abstract Introduction
Conclusions References
Tables Figures
◭ ◮
◭ ◮
Back Close
Full Screen / Esc
Printer-friendly Version Interactive Discussion
Discussion
P
a
per
|
Discus
sion
P
a
per
|
Discussion
P
a
per
|
Discussion
P
a
per
|
Assuming that the levoglucosan to mannosan ratio can thus be measured to within
±7 %, one can estimate the uncertainty from the analysis on the %spruce result derived
from Eq. (2). This uncertainty is ±8 % spruce points for levoglucosan to mannosan
ratios close to 14.8 % (thus for %spruce values close to 0 %) and gradually decreases to±2 % spruce points for ratios close to 0 (%spruce values close to 100 %). However,
5
the total uncertainty is likely much larger. It should be noted that besides MAs also other organic aerosol species, such as syringol and guaiacol, their derivatives, and retene, could be used to differentiate between hard- and softwood burning (e.g., Bari et al., 2009).
The “error bars” in Fig. 8 represent the minimum and the maximum PE observed for
10
the actual analytical method, and thus the range can be considered a measure of the variability. For the levoglucosan to mannosan ratio the variability ranged from 3.5 to 24 %.
4 Conclusions
In the current study we have compared the results of thirteen different analytical
meth-15
ods used to quantify monosaccharide anhydrides (MAs) (i.e., levoglucosan, mannosan and galactosan) in ambient aerosol filter samples. To our knowledge, this is the first major intercomparison that has been conducted and reported in the scientific literature with respect to these compounds. All major methods used for analysis of MAs in ambi-ent aerosol filter samples, and which have been reported in the sciambi-entific literature so
20
far, are represented in the present intercomparison.
The results show that for levoglucosan the accuracy is only slightly lower than that reported for analysis of SO24−on filter samples, a constituent that has been analyzed by numerous laboratories for several decades, typically by ion chromatography, and which should be considered a fairly easy constituent to analyze. Hence, the results obtained
25
AMTD
7, 7397–7450, 2014An intercomparison study of analytical
methods used
K. E. Yttri et al.
Title Page
Abstract Introduction
Conclusions References
Tables Figures
◭ ◮
◭ ◮
Back Close
Full Screen / Esc
Printer-friendly Version Interactive Discussion
Discussion
P
a
per
|
Discus
sion
P
a
per
|
Discussion
P
a
per
|
Discussion
P
a
per
by most analytical methods currently used to quantify monosaccharide anhydrides in ambient aerosol filter samples provide comparable results.
Finally, the various analytical methods used in the current study should be tested for other aerosol matrices and concentrations as well, the most obvious being summertime aerosol samples influenced by wild fires and/or agricultural fires.
5
Appendix A: Detailed description of analytical methods used for quantification of levoglucosan, mannosan and galactosan in the intercomparison
A1 HPAEC/Ion chromatography (IC)
Lab #2
For the analysis, punches of the filters (1 cm2) were spiked with13C6-levoglucosan and
10
extracted with 5 mL de-ionized water under 15 min gentle rotation. 50 µL of the filtered extracts (IC Acrodisc® syringe filter 0.45 µm Supor® (PES) membrane) were used for analysis. The MAs were measured using ion chromatography (Dionex IC-3000) cou-pled to a quadrupole mass spectrometer (Dionex MSQ). Separations were made using a Dionex CarboPac™ PA10 guard column (2 mm i.d.×50 mm length) and a Dionex
15
CarboPac™ PA10 analytical column (2 mm i.d.×250 mm length), a 2 mm ASRS-300
suppressor, a CR-ATC anion trap column, and a potassium hydroxide eluent genera-tor. Monosaccharide anhydrides were ionized using the ESI technique. The molecular ions of levoglucosan, mannosan and galactosan were monitored atm/z161, whereas that of 13C6-levoglucosan was monitored at m/z 167, using the selected ion mode.
20
Levoglucosan was used for calibration.
Lab. #3
AMTD
7, 7397–7450, 2014An intercomparison study of analytical
methods used
K. E. Yttri et al.
Title Page
Abstract Introduction
Conclusions References
Tables Figures
◭ ◮
◭ ◮
Back Close
Full Screen / Esc
Printer-friendly Version Interactive Discussion
Discussion
P
a
per
|
Discus
sion
P
a
per
|
Discussion
P
a
per
|
Discussion
P
a
per
|
test tubes, which were first agitated with a Vortex and then put into an ultrasonic bath (20 min). After centrifugation (10 min) the aqueous extract was transferred into 4 micro centrifugation vials with 1 mL solution each. The solutions (injection volume 20 µL) were analyzed using ion chromatography with pulsed amperometric detection (HPAEC/PAD, ICS-3000 from Dionex Corp.). The separating column was a CarboPac
5
MA1, the eluent concentration ranged from 0.48 M NaOH up to 0.65 M NaOH with a flow of 0.4 mL min−1. Levoglucosan, mannosan and galactosan were identified by their retention time and quantified using external standards.
Lab #7
For the analysis, punches of the filters (1.6 cm2) were extracted in 0.5 mL of Milli-Q
10
grade water under ultrasonication for 30 min. The extract was filtered through a sy-ringe filter (0.45 µm). The samples were analysed using a Dionex ICS-3000 system. The separation was carried out on a Dionex CarboPac MA1 column (4×250 mm) with
a corresponding guard column (4×50 mm) at room temperature. The sample injection
loop was 25 µL. The eluent gradient was programmed as follows: 0.52 M NaOH from 0
15
to 20 min, 0.52 M NaOH to 0.65 M NaOH in 15 min and held constant for 15 min. The eluent flow rate was 0.4 mL min−1. The waveform used for pulsed amperometric de-tection was the standard quadruple potential for carbohydrate analysis. Levoglucosan, mannosan and galactosan were identified by their retention time and were quantified using external standards.
20
A2 HPLC
Lab. #1
For the analysis, punches (1.5 cm2) of the filter were spiked with 13C6-levoglucosan and 13C6-galactosan and extracted twice with 2 mL tetrahydrofuran under ultrasonic agitation (30 min). The filtered extracts (Teflon syringe filter, 0.45 µm) were evaporated
AMTD
7, 7397–7450, 2014An intercomparison study of analytical
methods used
K. E. Yttri et al.
Title Page
Abstract Introduction
Conclusions References
Tables Figures
◭ ◮
◭ ◮
Back Close
Full Screen / Esc
Printer-friendly Version Interactive Discussion
Discussion
P
a
per
|
Discus
sion
P
a
per
|
Discussion
P
a
per
|
Discussion
P
a
per
to a total volume of 1 mL in a nitrogen atmosphere. Before analysis the sample solvent elution strength was adapted to the mobile phase by adding Milli-Q water (0.8 mL). The concentrations of the MAs were determined using High-Performance Liquid Chro-matography (HPLC) (Agilent model 1100) in combination with HRMS-TOF (high resolu-tion time-of-flight mass spectrometry, Micromass model LCT) operated in the negative
5
ESI mode. Levoglucosan, mannosan and galactosan were identified on the basis of retention time and mass spectra of authentic standards. Quantification was performed using isotope labeled standards of levoglucosan and galactosan. The mass traces at m/z161.0455 and 167.0657 were used for quantification (approximately 50 mDa peak width).
10
Lab. #6
For the analysis, filters were spiked with13C6-levoglucosan and extracted 3 times with methanol in an ultrasonic bath for 30 min. The three extracts were pooled and evap-orated to dryness. The sample was reconstituted with 1 mL methanol, shaken, and filtered through a nylon filter. The analysis was performed with liquid
chromatography-15
mass spectrometry with ESI in the positive ionization mode. Sodium acetate 2 mM was added to the LC mobile phase to form sodium adducts of levoglucosan and mannosan. The analytes were separated by a gradient using 10 mM sodium acetate and methanol as mobile phase. The LC column was a Benson Polymeric BP-100 Ca++ Carbohy-drate Column. Analysis was performed in the selected ion monitoring (SIM) of the Na
20
adducts. The ion monitored for levoglucosan and mannosan was m/z 185, whereas that for13C6-levoglucosan wasm/z191.
Lab. #8
For the analysis, filter punches (4.5 cm2) were extracted with 2 mL ultrapure wa-ter by 30 min vortex agitation. 449 µL of the filwa-tered extracts (Acrodisc syringe
AMTD
7, 7397–7450, 2014An intercomparison study of analytical
methods used
K. E. Yttri et al.
Title Page
Abstract Introduction
Conclusions References
Tables Figures
◭ ◮
◭ ◮
Back Close
Full Screen / Esc
Printer-friendly Version Interactive Discussion
Discussion
P
a
per
|
Discus
sion
P
a
per
|
Discussion
P
a
per
|
Discussion
P
a
per
|
ionization–tandem mass spectrometry (Thermo Fisher Scientific LCQ Fleet). Levoglu-cosan, mannosan and galactosan were identified and quantified on the basis of reten-tion time and specific multiple reacreten-tion monitoring (MRM) transireten-tion (m/z161–113 for levoglucosan and galactosan,m/z161–101 for mannosan). External calibrations were performed using standards of levoglucosan, mannosan, and galactosan.
5
Lab. #10
For the analysis, the entire filter punch was extracted twice with 6 mL pure water in an ultrasonic bath for 45 min. Extracts were filtered (Teflon syringe filter, 0.2 µm) and 50 µL of chloroform were added to prevent from bacteria activity. Extracts were kept frozen (−18◦C) until analysis. The analyses were performed using an ultra-performance
liq-10
uid chromatography (UPLC, Waters) instrument coupled with a triple quadrupole mass spectrometer (Applied Biosystems, model API3200). Separation of MAs was achieved using an Acquity UPLC HSS T3 column, a sample loop of 10 µL, a mixed water-methanol solvent, and post-column addition of water-methanol. Levoglucosan, mannosan and galactosan were identified and quantified on the basis of retention time and
spe-15
cific MRM transition (m/z161–113 for levoglucosan and galactosan,m/z161–113 for mannosan). External calibrations were performed using standards.
A3 GC
Lab. #4
For the GC/MS analyses, 3 filter punches (1 cm2each) were spiked with recovery
stan-20
dard (methylO-L-xylanopyranoside). Each punch was extracted three times with 10 mL methanol for 5 min under ultrasonic agitation. The combined extract was reduced in volume with a rotary evaporator to about 1 mL. The filtered concentrate (Teflon syringe filter, 0.45 µm) was completely dried under a stream of nitrogen. 40 µL of BSTFA+1 % TMCS/pyridine (2/1) was added to the dried sample, and the mixture reacted at 70◦C