Lateral cephalometric diagnosis of asymmetry in
Angle Class II subdivision compared to Class I and II
Aparecida Fernanda Meloti1, Renata de Cássia Gonçalves1, Ertty Silva2, Lídia Parsekian Martins3, Ary dos Santos-Pinto3
Introduction: Lateral cephalometric radiographs are traditionally required for orthodontic treatment, yet rarely used to assess asymmetries. Objective: The objective of the present study was to use lateral cephalometric radiographs to identify existing skeletal and dentoalveolar morphological alterations in Class II subdivision and to compare them with the exist-ing morphology in Class I and II relationship. Material and Methods: Ninety initial lateral cephalometric radiographs of male and female Brazilian children aged between 12 to 15 years old were randomly and proportionally divided into three groups: Group 1 (Class I), Group 2 (Class II) and Group 3 (Class II subdivision). Analysis of lateral cephalometric radiographs included angular measurements, horizontal linear measurements and two indexes of asymmetry that were prepared for this study. Results: In accordance with an Index of Dental Asymmetry (IDA), greater mandibular dental asymmetry was identified in Group 3. An Index of Mandibular Asymmetry (IMA) revealed less skeletal and dental mandibular asymmetry in Group 2, greater skeletal mandibular asymmetry in Group 1, and greater mandibular dental asymmetry in Group 3. Conclusion: Both IDA and IMA revealed greater mandibular dental asymmetry for Group 3 in comparison to Groups 1 and 2. These results are in accordance with those found by other diagnostic methods, showing that lateral cephalometric radiography is an acceptable method to identify existing skeletal and dentoalveo-lar morphological alterations in malocclusions.
Keywords:Facial asymmetry. Malocclusions. Radiography. Cephalometry.
How to cite this article: Meloti AF, Gonçalves RC, Silva E, Martins LP, Santos-Pinto A. Lateral cephalometric diagnosis of asymmetry in Angle Class II subdivi-sion compared to Class I and II. Dental Press J Orthod. 2014 July-Aug;19(4):80-8. DOI: http://dx.doi.org/10.1590/2176-9451.19.4.080-088.oar
Submitted: July 02, 2012 - Revised and accepted: December 05, 2012
Contact address: Aparecida Fernanda Meloti
Rua Carlos Antônio de Azevedo, 333 ‒ Jardim São José ‒ Urupês/SP — Brazil
CEP: 15.850-000 ‒ E-mail: [email protected]
1 PhD in Orthodontics and Facial Orthopedics, School of Dentistry — State
University of São Paulo (UNESP)/Araraquara.
2 Specialist in Orthodontics and Facial Orthopedics, PUC-RJ.
3 Adjunct professor, Department of Pediatric Dentistry and Orthodontics, School
of Dentistry — State University of São Paulo (UNESP)/Araraquara.
» The authors report no commercial, proprietary or financial interest in the products or companies described in this article.
DOI: http://dx.doi.org/10.1590/2176-9451.19.4.080-088.oar
Introdução: as telerradiografias laterais são tradicionalmente solicitadas para planejamento ortodôntico, mas raramente utilizadas para avaliar assimetrias. Objetivo: o objetivo do presente estudo foi utilizar as telerradiografias laterais para identificar as alterações morfológicas esqueléticas e dentoalveolares existentes na má oclusão de Classe II subdivisão e compará-las com a morfologia existente nas más oclusões de Classe I e II. Métodos: noventa telerradiografias laterais ini-ciais de adolescentes brasileiros de ambos os sexos, com idade cronológica entre 12 e 15 anos, foram divididas em três gru-pos randomizados e proporcionais: Grupo 1 (Classe I), Grupo 2 (Classe II) e Grupo 3 (Classe II subdivisão). A análise das telerradiografias laterais envolveu mensurações angulares, mensurações lineares horizontais e dois índices de assimetria, estipulados para o presente estudo. Resultados: foi identificada, de acordo com o Índice de assimetria dentária (IAD), uma maior assimetria dentária inferior no Grupo 3. O Índice de assimetria mandibular (IAM) revelou menor assimetria esquelética e dentária no Grupo 2, maior assimetria esquelética no Grupo 1 e maior assimetria dentária inferior no Gru-po 3. Conclusão: o IAD e o IAM mostraram maior assimetria dentária inferior no GruGru-po 3 do que nos GruGru-pos 1 e 2. Esses resultados estão de acordo com os encontrados em outros métodos de diagnóstico, indicando que a telerradiografia lateral é um método aceitável para avaliar alterações morfológicas esqueléticas e dentoalveolares nas más oclusões.
INTRODUCTION
Class II subdivision is characterized by an asymmet-rical posterior occlusal relationship in which the dental arches demonstrate a Class I relationship on one side and a Class II relationship on the other side. This asym-metrical occlusal relationship is of skeletal and/or
dento-alveolar origin.1 Knowing the origin of this asymmetry
is extremely important to ensure correct treatment of individuals with Class II subdivision.
Slight degrees of facial asymmetry are common
among the general population.2 Individuals with Class II
subdivision typically present an accentuated degree of asymmetry that involves the lower third of the face and
the mandible.3,4,5
Alavi et al6 reported the distal position of the irst
lower molar as the main cause of Class II subdivi-sion asymmetry. Additionally, these authors stated that asymmetry could have dentoalveolar or skeletal
etiology. Rose et al7 also observed irst lower molar in
Class II subdivision asymmetry positioned more poste-riorly on the Class II side; however, these authors stated that asymmetry resulted from dentoalveolar involve-ment without observable changes in the jaw. The posi-tion of dental midlines in relaposi-tion to the facial midline
was examined and revealed8 that lower dental midline
deviation was more common than upper midline de-viation, suggesting the cause of this asymmetry to be mandibular in nature.
While observing maxillary and mandibular chang-es in Class II subdivision and Class I malocclusions,
Janson et al9 showed that dentoalveolar changes occurred
in jaws without positional asymmetry. The main cause of Class II subdivision relationship was the distal posi-tion of lower molars on the Class II side. The posiposi-tion of upper mesial molars, also on the Class II side, was a secondary cause. The lower dental midline also present-ed more frequent deviations on the Class II side than
the upper dental midline did. Therefore, this study9 as
well as others4,7,8,10,11 demonstrated that asymmetries
present in Class II subdivision patients are mainly of dentoalveolar origin.
Computed tomography is considered an
opti-mal diagnostic method for asymmetry assessment,12
but the cost of this method is higher and its radiation dose is greater in comparison to other methods. Pho-tographs have been compared to posteroanterior radio-graphs, but no signiicant correlation has been found
between methods.13 Edler et al14 argued that
photo-graphs should be used simultaneously with posteroan-terior radiographs. When photographs were compared to submentovertex radiographs and posteroanterior
radiographs,15 a small correlation was found between
methods. Posteroanterior radiographs allow observa-tions of vertical and transversal changes; however,
re-ports in the literature6-9,11,12 have noted a greater change
in the anteroposterior positioning of molars in Class II subdivision malocclusion.
Although anteroposterior changes can be observed
with submentovertex radiographs, Lew and Tay16 found
a distortion in linear measurements taken with these
radiographs. Additionally, Arnold et al17 reported
dif-iculties in using submentovertex radiographs. The use of 45° cephalometric radiographs ofers another method that allows visualization of structures in the anteropos-terior direction, but this method is not routinely applied because it requires two further radiographic images in addition to those required for basic orthodontic docu-mentation. Study models may be used for observation of dental structures in the anteroposterior direction, but these models do not allow skeletal observations. In addi-tion, panoramic radiographs do not enable
anteroposte-rior morphological alterations to be visualized.18,19
Because they are traditionally required for orth-odontic treatment, lateral cephalometric radiographs allow visualization of anteroposterior structures in a simple manner without additional costs to the
ortho-dontist. Only one study6 has used lateral cephalometric
radiographs to observe the position of molars and the existence of an asymmetrical mandibular relationship in the anteroposterior direction.
Therefore, the objectives of our study were to use lateral cephalometric radiographs to identify skeletal and dentoalveolar morphological alterations in cases of Class II subdivision; to compare these changes with morphology of Class I and Class II; and to assess the incidences of dental and skeletal symmetry and asym-metry of the maxilla and mandible.
MATERIAL AND METHODS
State University of São Paulo/Araraquara. The sample was divided into three equal groups of Class I, Class II or Class II subdivision patients. Malocclusion criteria were based on the occlusal relationship between upper and lower arches obtained on study models and photo-graphic documentation. Molar and canine relationships in Group 1 (Class I) were bilateral and symmetrical, whereas those in Group 2 (Class II) were displaced in more than half the width of a cusp. In Group 3 (Class II subdivision), molar and canine exhibited a Class I rela-tionship on one side and a Class II relarela-tionship on the other side. Additional inclusion criteria for all groups were as follows: normal lower arch or a lower arch with slight lower-anterior crowding, and the presence of all permanent teeth in the dental arches (from irst molar to irst molar) with eminent eruption or eruption of second molars. Subjects were excluded if they had occlusal in-terferences that might cause functional alterations (e.g., dental crossbite, open bite or history of facial trauma).
Standardized lateral cephalometric radiographs were taken with patients’ teeth in maximum habitual inter-cuspation with relaxed lips and face positioned with Camper’s plane parallel to the ground. Radiographs were taken with Rotograph plus model MR05, adjusted for 85 Kvp, 10 mA and 0.5 seconds of exposure time. The equipment had ixed and constant focus-object distance
of 1.5 meters. The chassis with Kodaktm - TMG/RA,
20.3cm x 25.4 cm ilm was positioned 15 cm away from the medial sagittal plan, giving an average magniication factor of 10%.
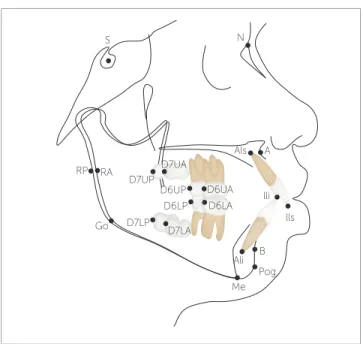
Cephalometric analysis was performed by digitizing twenty-one points identiied in the lateral radiographs (Fig 1) by the same researcher using a Numonics Accu-Grid digitizer (TPL 1212 – Kurta, Seymour, Connecticut – USA) and Dentofacial Planner Plus, version 6.5, 1995 (Dentofacial sotware Inc. Toronto, Ontario – Canada). Radiographs were randomly digitized by means of sim-ple random sampling without group identiication.
For characterization of the sample, the follow-ing angular measurements were used: SNA, SNB, ANB, SNPP (angle formed by the SN line and the palatal plane [ANS – PNS]), SNOP (angle formed by the SN line and the occlusal plane [Op – Oa]), SN-GoMe, U1.SN, L1SN-GoMe, U1.L1 and NAPog. Study analysis involved two indexes (i.e., the index of den-tal asymmetry and the index of mandibular asym-metry) as well as ive linear measurements (RA-RP,
D7UA-D7UP, D6UA-D6UP, D7LA-D7LP and D6LA-D6LP) (Fig 2).
Index of dental asymmetry (IDA)
An IDA was developed based on the diference in distance between the most anterior and the most pos-terior molars in the upper and lower dental arches [IDA1 = (D6UA-D6UP) – (D6LA-D6LP)]. Similarly, this index was applied for second upper and lower mo-lars [IDA2= (D7UA-D7UP) – (D7LA-D7LP)].
Mathematically, a diference of zero represents upper-lower dental symmetry. A variation from nor-mality of ± 0.5 mm was used for the tolerance criterion; this value corresponds to the degree of magniication between the right and let sides in cephalometric mea-surements. Values greater than 0.5 mm represented a greater distance between upper molars than between lower molars, and thus indicated upper dental asymme-try. Values of less than -0.5 mm represented a greater distance between lower molars than between upper molars, and thus indicated lower dental asymmetry.
For example, the IDA using the irst molars is de-scribed as follows:
» IDA1= (D6UA-D6UP) – (D6LA-D6LP), where » (D6UA-D6UP) = distance between the most an-terior image of the upper irst molar (D6UA) and the most posterior molar (D6UP); and
» (D6LA-D6LP) = distance between the most ante-rior image of the lower irst molar (D6LA) and the most posterior molar (D6LP).
If:
» IDA > 0.5 mm = upper dental asymmetry; » IDA < -0.5 mm = lower dental asymmetry;
» -0.5 mm ≥ IDA ≤ 0.5 mm = upper and lower dental symmetry.
Index of mandibular asymmetry (IMA)
Following the same logic, an IMA was devel-oped based on the diference in distance between the most anterior and the most posterior por-tions of the mandibular ramus, and the distance be-tween the most anterior and the most posterior lower irst molars [IMA1 = (RA-RP) – (D6LA-D6LP)]. Similarly, this index was applied for second molars [IMA2= (RA-RP) – (D7LA-D7LP)].
Figure 1 - Skeletal and dental cephalometric points. S (Sella), N (Nasion),
A (Subspinal), B (Supramental), Go (Gonial), Me (Mentalis), Pog (Pogonion),
IIs (Incisal edge of maxillary central incisor), AIs (Apex of upper incisor),
IIi (Incisal edge of the lower central incisor), AIi (Apex of lower incisor),
RA (Anterior ramus), RP (Posterior ramus), D7UA (Point in the distal face of the most anterior image of the second upper molar crown), D7UP (Point in the distal face of the most posterior image of the second upper molar crown), D6UA (Point in the distal face of the most anterior image of the first upper molar crown), D6UP (Point in the distal face of the most posterior image of the first upper molar crown), D7LA (Point in the distal face of the most anterior image of the second lower molar crown), D7LP (Point in the distal face of the most posterior image of the second lower molar crown),
D6LA (Point in the distal face of the most anterior image of the first lower molar crown), D6LP (Point in the distal face of the most posterior image of first lower molar crown).
Figure 2 - Skeletal and dental linear cephalometric measurements. RA-RP
(Horizontal distance between the anterior (RA) and posterior (RP) images of the posterior mandibular borders), D7UA-D7UP (Horizontal distance between the D7UA and D7UP points), D6UA-D6UP (Horizontal distance between the D6UA and D6UP points), D7LA-D7LP (Horizontal distance between the D7LA and D7LP points), D6LA-D6LP (Horizontal distance be-tween the D6LA and D6LP points).
and skeletal mandibular symmetry. As above, a toler-ance criterion of ± 0.5 mm was used to indicate varia-tion from normality. Values greater than 0.5 mm rep-resented skeletal asymmetry, as the anterior-posterior extent of the ramus was greater than that of the lower molars. On the other hand, values of less than -0.5 mm represented dental asymmetry, as the anterior-posterior extent of the lower molars was greater than that of the mandibular ramus.
For example, the IMA using the irst molars was de-scribed as follows:
» IMA1= (RA-RP) – (D6LA-D6LP), where
» (RA-RP) = distance between the most anterior image of the mandibular ramus (RA) and the most pos-terior one (RP); and
» (D6LA-D6LP) = distance between the most ante-rior image of the lower irst molar (D6LA) and the most posterior one (D6LP).
If:
» IMA > 0.5 = mandibular skeletal asymmetry; » IMA < -0.5 = mandibular dental asymmetry; » -0.5 mm ≥ IMA ≤ 0.5 mm = skeletal and dental mandibular symmetry.
Statistical analysis
To assess consistency of measurements, six radio-graphs from each group were digitized twice by the same researcher with an interval of two weeks in between. The intra-class correlation coeicient (ICC) was used to assess reliability of the variable measurement process. Measurements were considered adequate when the ICC value was greater than 0.95.
To test the hypothesis that mean angular measure-ments were equivalent for the three groups, an analysis of variance (ANOVA) was used. When Levene’s prior test rejected the hypothesis of homogeneity of variances, Brown-Forsythe test was used to verify equality of means. Schefé’s multiple comparison test was used to detect signiicant diferences between groups.
A chi-square test was used to test the hypothesis that the proportion of subjects with asymmetries did not difer between groups, and to determine whether there was an association between category of asymmetry and group. A 95% conidence level (p < 0.05) was considered statisti-cally signiicant. Statistical analyses were performed using SPSS sotware, version 16.0 for Windows (release 16.01 – Nov. 2007; SPSS Inc., 1989-2007).
RP RA
Go D7LP
RA-RP
D7LA-DTLP D6LA-D6LP
D6UA-D6UP D7UA-DTUP
D6LP
D7LA D6LA D6UA D6UP D7UP
D7UA
Als
lli
lls
Ali
Me Pog B
RESULTS
Reliability of the method was satisfactory; ICC val-ues for replicate measurements were greater than 0.99 for angular measurements and greater than 0.96 for linear measurements. The calculated ICC value was greater than 0.98 for all variables.
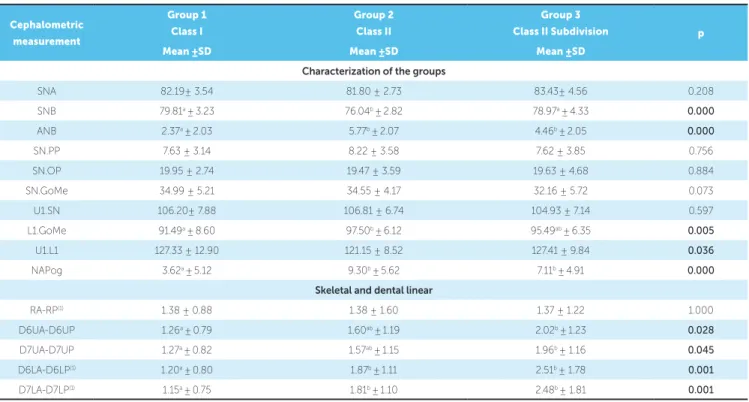
The analysis of diferences between groups (Table 1) conirmed greater mandibular retrusion (small-est SNB) and greater lower incisor inclination (great-er L1.GoMe) for Group 2 in comparison to the oth(great-er groups (1 and 3). Group 1 had smaller maxillomandibu-lar diferences (smallest ANB) and lower facial convex-ity (smallest NAPog) than the other groups (2 and 3). Despite signiicant ANOVA result for the U1.L1 mea-surement, Schefé’s multiple comparison test was un-able to detect signiicant diferences between groups.
As shown in Table 1, the RA-RP distance was simi-lar for all groups. Therefore, if image distortions or vari-ations in head position occurred, they were similar for all groups. In contrast, the dental measurements difered signiicantly among groups. Diferences in distance be-tween irst upper molars (D6UA-D6UP) and second
upper molars (D7UA-D7UP) were smaller in Group 1 than Group 3; yet the values for these groups did not difer from those of Group 2. Distances between irst lower molars (D6LA-D6LP) and second lower molars (D7LA-D7LP) were smaller in Group 1 than Groups 2 or 3. All dental measurements were greater in Group 3 than in Groups 1 or 2.
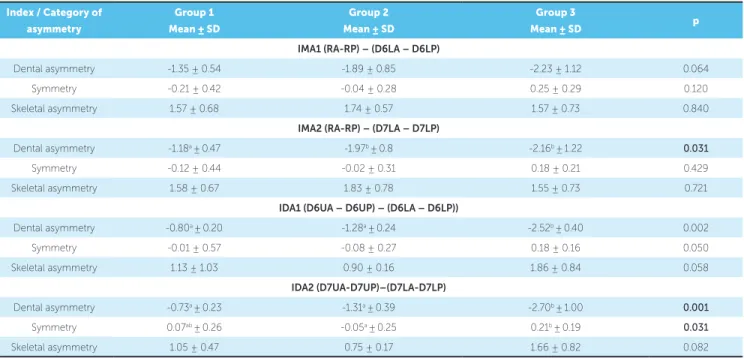
The proportion of subjects with skeletal and dental mandibular symmetry, skeletal mandibular asymmetry and/or dental mandibular asymmetry was determined in the three groups by means of the IMA using irst (IMA1) or second (IMA2) molars as reference. Despite the greater proportion of subjects with skeletal asym-metry in Group 1, the greater proportion of subjects with skeletal and dental symmetry in Group 2 and the greater proportion of subjects with dental asymmetry in Group 3, the chi-square test revealed no signiicant association between asymmetry and group in IMA1 (Table 2). Additionally, there was no statistically sig-niicant diference among the means of IMA1 for each asymmetry category. However, a greater incidence of dental mandibular asymmetry was observed in
Cephalometric
measurement
Group 1
Class I
Group 2
Class II
Group 3
Class II Subdivision p
Mean ±SD Mean ±SD Mean ±SD
Characterization of the groups
SNA 82.19± 3.54 81.80 ± 2.73 83.43± 4.56 0.208
SNB 79.81a ±3.23 76.04b ±2.82 78.97a ±4.33 0.000
ANB 2.37a ±2.03 5.77b ±2.07 4.46b ±2.05 0.000
SN.PP 7.63 ± 3.14 8.22 ± 3.58 7.62 ± 3.85 0.756
SN.OP 19.95 ± 2.74 19.47 ± 3.59 19.63 ± 4.68 0.884
SN.GoMe 34.99 ± 5.21 34.55 ± 4.17 32.16 ± 5.72 0.073
U1.SN 106.20± 7.88 106.81 ± 6.74 104.93 ± 7.14 0.597
L1.GoMe 91.49a ±8.60 97.50b ±6.12 95.49ab ±6.35 0.005
U1.L1 127.33 ± 12.90 121.15 ± 8.52 127.41 ± 9.84 0.036
NAPog 3.62a ±5.12 9.30b ±5.62 7.11b ±4.91 0.000
Skeletal and dental linear
RA-RP(1) 1.38 ± 0.88 1.38 ± 1.60 1.37 ± 1.22 1.000
D6UA-D6UP 1.26a ±0.79 1.60ab ±1.19 2.02b ±1.23 0.028
D7UA-D7UP 1.27a ±0.82 1.57ab ±1.15 1.96b ± 1.16 0.045
D6LA-D6LP(1) 1.20a ±0.80 1.87b ±1.11 2.51b ± 1.78 0.001
D7LA-D7LP(1) 1.15a ±0.75 1.81b ±1.10 2.48b ± 1.81 0.001
Table 1 - Mean and standard deviation of measurements and analysis of variance (ANOVA) to test the hypothesis that the means of the three groups are the same
Group 3 than in Groups 1 or 2, and a greater incidence of skeletal asymmetry was observed in Group 2 than in Groups 1 or 3 (Table 3). When the second molar was used to calculate the IMA2, there was no signiicant association between asymmetry and group member-ship (Table 2). Finally, the magnitude of dental man-dibular asymmetry in Group 1 was smaller than that in Groups 2 or 3 (Table 3).
The proportion of subjects with dental symmetry, upper dental asymmetry and/or lower dental asym-metry was determined in the three groups by IDA1 and IDA2. A chi-square test revealed signiicant asso-ciation between asymmetry and group membership. The proportion of individuals with dental symmetry was signiicantly greater in Groups 1 and 2 than in Group 3. In Group 3, there was a high frequency of lower dental asymmetry (Table 2). The magnitude of lower dental asymmetry was also greater in Group 3 than in Groups 1 or 2 (Table 3).
DISCUSSION
In this study, lateral radiographs were used to assess the nature of asymmetries in individuals with Class II subdivision (Group 3) compared to control groups of individuals with bilateral symmetric Class I (Group 1) or bilateral symmetric Class II (Group 2) relationship. Although other diagnostic methods are more frequently used than lateral radiography, these methods are
accom-panied by speciic disadvantages.6-9,11-17
Lateral cephalometric radiographs allow anteroposterior structures to be visualized in a simple manner without ad-ditional costs to the orthodontist, as they are traad-ditionally required for diagnostic and treatment planning. However, as other radiographic methods, errors in head positioning may
occur.20 The head may rotate along transverse,
anteropos-terior, or vertical axes. Rotations along the transverse axis do not cause image distortions because the head remains parallel to the X-ray source. Rotation produces relative changes in the location of images on the ilm, but none in
Table 2 - Number and proportion of individuals according to group and category of the index of asymmetry and results of chi-square test for the association between asymmetry and group
IMA = index of mandibular asymmetry; IMA1 = (RA-RP) – (D6LA - D6LP); IMA 2 = (RA-RP) – (D7LA – D7LP). IDA = index of dental asymmetry; IDA1 = (D6UA-D6UP)–(D6LA-D6LP); IDA 2 = (D7UA-D7UP)–(D7LA-D7LP).
Index / Category
of asymmetry
Group 1 Group 2 Group 3
n % n % n %
IMA1 ( χ²= 8.66; df=4; p=0.070)
Dental asymmetry 10 33.3 14 46.7 20 66.7
Symmetry 7 23.3 9 30 4 13.3
Skeletal asymmetry 13 43.3 7 23.3 6 20
Total 30 100 30 100 30 100
IMA2 (χ²= 9.15; df=4; p=0.057)
Dental asymmetry 11 36.7 13 43.3 20 66.7
Symmetry 6 20.0 10 33.3 4 13.3
Skeletal asymmetry 13 43.3 7 23.3 6 20.0
Total 30 100.0 30 100.0 30 100.0
IDA1 (χ² = 16.33; df=4; p=0.003)
Dental asymmetry 3 10.0 8 26.7 13 43.3
Symmetry 23 76.7 18 60.0 8 26.7
Skeletal asymmetry 4 13.3 4 13.3 9 30.0
Total 30 100.0 30 100.0 30 100.0
IDA2 (χ²= 14.60; df=4; p=0.006)
Dental asymmetry 3 10.0 7 23.3 12 40.0
Symmetry 23 76.7 19 63.3 9 30.0
Skeletal asymmetry 4 13.3 4 13.3 9 30.0
Table 3 - Mean and standard deviation of the index of asymmetry and results of the analysis of variance (ANOVA) to test the hypothesis of equality of the means of the three groups, according to the category of asymmetry.
Index / Category of
asymmetry
Group 1
Mean ± SD
Group 2
Mean ± SD
Group 3
Mean ± SD p
IMA1 (RA-RP) – (D6LA – D6LP)
Dental asymmetry -1.35 ± 0.54 -1.89 ± 0.85 -2.23 ± 1.12 0.064
Symmetry -0.21 ± 0.42 -0.04 ± 0.28 0.25 ± 0.29 0.120
Skeletal asymmetry 1.57 ± 0.68 1.74 ± 0.57 1.57 ± 0.73 0.840
IMA2 (RA-RP) – (D7LA – D7LP)
Dental asymmetry -1.18a ±0.47 -1.97b ±0.8 -2.16b ±1.22 0.031
Symmetry -0.12 ± 0.44 -0.02 ± 0.31 0.18 ± 0.21 0.429
Skeletal asymmetry 1.58 ± 0.67 1.83 ± 0.78 1.55 ± 0.73 0.721
IDA1 (D6UA – D6UP) – (D6LA – D6LP))
Dental asymmetry -0.80a ±0.20 -1.28a ±0.24 -2.52b ±0.40 0.002
Symmetry -0.01 ± 0.57 -0.08 ± 0.27 0.18 ± 0.16 0.050
Skeletal asymmetry 1.13 ± 1.03 0.90 ± 0.16 1.86 ± 0.84 0.058
IDA2 (D7UA-D7UP)–(D7LA-D7LP)
Dental asymmetry -0.73a ±0.23 -1.31a ±0.39 -2.70b ±1.00 0.001
Symmetry 0.07ab ±0.26 -0.05a ±0.25 0.21b ±0.19 0.031
Skeletal asymmetry 1.05 ± 0.47 0.75 ± 0.17 1.66 ± 0.82 0.082
the relationships of structures that could cause errors in the process of radiographic measurement. Rotation along the anteroposterior axis afects vertical measurements. Although bilateral structures move equally, vertical measurements in-crease or dein-crease based on the direction of rotation. Ro-tation along the vertical axis could inluence horizontal
measurements, as analyzed in this study.20 When the head
rotates along the vertical axis, the length of the mandibu-lar body gradually decreases as the rotation angle increases along the direction of the ilm. Alteration in length is typi-cally approximately 1%; however, this percentage may in-crease to -5.78% when the angle of head rotation varies
between -5 and -15 degrees.20 The efects of head rotation
on measurements of mandible and molars are equal in mag-nitude. Therefore, the absolute but not relative distance be-tween these structures is afected, as demonstrated by the indexes of asymmetry of this current study.
According to Kjellberg et al,19 radiographic extent,
head position and distortions can be ignored when an
in-dex is used to calculate linear measurements. Habets et al20
also believe that morphological diferences of size, calcu-lation and interpretation of indings can be excluded by certain indexes such as those used in the current study.
Our sample showed a few cephalometric difer-ences related to the characteristics of malocclusion.
For example, individuals in Group 1 presented smaller ANB and less facial convexity. These diferences relect the characteristics of the groups, conirming that indi-viduals in Group 2 presented greater mandibular retru-sion than those in Groups 1 and 3. Although Group 3 has a Class II relationship on one side, the Class I re-lationship on the other side produces smaller retrusion than in individuals with bilateral Class II (Group 2).
Azevedo et al4 reported that skeletal involvement in
individuals with Class II subdivision is typically small. Greater buccal positioning of lower incisors in individu-als with Class II arises due to dentoalveolar compensa-tion for their greater mandibular retrusion, which re-sults in a signiicantly more closed interincisal angle.
Distances between irst and second upper or lower molars (Table 2) were always smaller in Group 1 than in Groups 2 and 3, thus revealing that this type of re-lationship is associated with greater dental symmetry. IDA1 and IDA2 identiied greater dental symmetry in Groups 1 and 2, indicating great concordance between our direct measurements and the results of these indexes.
Similarly, IMA1 and IMA2 revealed greater skeletal mandibular asymmetry in Group 1 (Table 2). This result is
supported by the indings by Sezgin et al21 who found
normal occlusion. They also found22 asymmetry in Class I patients, with the mandible less anterior and highly posi-tioned in hyperdivergent patients than in hypodivergent.
IMA revealed greater skeletal and dental mandibular symmetry in Group 2 than in Groups 1 and 3. Although Group 2 tended to show greater symmetry than individuals in the other groups, their skeletal asymmetry (when pres-ent) was greater in magnitude than that of Groups 1 and 3.
IMA revealed greater dental mandibular asymmetry in Group 3 than those in Groups 1 and 2. IDA also showed individuals in Group 3 to have greater lower dental asym-metry than Groups 1 and 2. These results corroborate those
presented by authors4,7-11 using other diagnostic methods,
such as posteroanterior radiography, submentovertex radi-ography, 45° radiradi-ography, study models and photographs.
Alavi et al6 used lateral radiograph to investigate
asymme-tries in individuals with Class II subdivision. Neverthe-less, the authors were not able to determine whether these changes arose due to dentoalveolar or skeletal etiology.
CONCLUSION
» Two indexes of asymmetry and direct measurements were presented as part of a new evaluation method used to identify dental and skeletal asymmetries by means of lateral cephalometric radiography.
» Distances between irst and second upper or lower molars were always less in the Class I group and greater in the Class II subdivision group, in ac-cordance with new IDA indexes which identi-ied greater dental asymmetry in individuals with Class II subdivision than those with Class I and Class II.
» New IMA indexes revealed less skeletal and dental mandibular asymmetry in individuals with Class II, and greater skeletal mandibular asymmetry in indi-viduals with Class I.
1. Janson GRP, Pereira ACJ, Dainesi EA, Freitas MR. The dental asymmetry and implication in the orthodontic treatment: a clinical case. Ortodontia. 1995;28:68-73.
2. Thompson JR. Asymmetry of the face. J Am Dent Assoc. 1943;30:1859-71. 3. Alkoide EA. Class II division 1 malocclusion: the subdivision problem. J Clin
Pediatr Dent. 2001;26(1):37-40.
4. Azevedo ARP, Janson G, Henriques JFC, Freitas MR. Evaluation of asymmetries between subjects with Class II subdivision and apparent facial asymmetry and those with normal occlusion. Am J Orthod Dentofacial Orthop. 2006;129(3):376-83.
5. Brin I, Bem-Bassat Y, Blustein Y, Ehriich J, Hochman N, Marmary Y, et al. Skeletal and functional efects of treatment for unilateral posterior crossbite. Am J Orthod Dentofacial Orthop. 1996;109(2):173-9.
6. Alavi DG, BeGole EA, Schneider BJ. Facial and dental arch asymmetries in Class II subdivision malocclusion. Am J Orthod Dentofacial Orthop. 1988;93(1):38-46. 7. Rose JM, Sadowsky C, BeGole EA, Moles R. Mandibular skeletal and dental
asymmetry in Class II subdivision malocclusions. Am J Orthod Dentofacial Orthop. 1994;105(5):489-95.
8. Araujo TM, Wilhelm RS, Almeida MA. Skeletal and dental arch asymmetries in Class II division 1 subdivision malocclusions. J Clin Pediatr Dent. 1994;18(3):181-5. 9. Janson GRP, Metaxas A, Woodside DG, Freitas MR, Pinzan A.
Three-dimensional evaluation of skeletal and dental asymmetries in Class II subdivision malocclusions. Am J Orthod Dentofacial Orthop. 2001;119(4):406-18. 10. Janson G, Lima KJRS, Woodside DG, Metaxas A, Freitas MR, Henriques JFC.
Class II subdivision malocclusion types and evaluation of their asymmetries. Am J Orthod Dentofacial Orthop. 2007;131(1):57-66.
11. Sabah ME. Submentovertex cephalometric analysis of Class II subdivision malocclusions. J Oral Sci. 2002;44(3-4):125-7.
12. Palomo JM, Hunt DW Jr, Hans MG, Broadbent BH Jr. A longitudinal 3-dimensional size and shape comparison of untreated Class I and Class II subjects. Am J Orthod Dentofacial Orthop. 2005;127(5):584-91.
REFERENCES
13. Lima KJRS, Janson G, Henriques JFC, Freitas MR, Pinzan A. Avaliação da concordância entre a classiicação dos tipos de Classe II subdivisão em fotograias e em radiograias póstero-anteriores. Rev Dental Press Ortod Ortop Facial. 2005:10(3):46-55.
14. Edler R, Wertheim D, Greenhill D. Comparison of radiographic and photographic measurement of mandibular asymmetry. Am J Orthod Dentofacial Orthop. 2003;123(2):167-74.
15. Azevedo ARP. Correlação entre assimetria clínica e assimetria radiográica na Classe II, Subdivisão [dissertação]. Bauru (SP): Universidade de São Paulo; 2003. 16. Lew KKK, Tay DKL. Submentovertex cephalometric norms in male Chinese
subjects. Am J Orthod Dentofacial Orthop 1993;103(3):247-52.
17. Arnold TG, Anderson GC, Liijemark WF. Cephalometric norms for craniofacial asymmetry using submental-vertical radiographs. Am J Orthod Dentofacial Orthop. 1994;106(3):250-6.
18. Yoon Y-J, Kim K-S, Hwang M-S, Kim H-J, Choi E-H, Kim K-W. Efect of head rotation on lateral cephalometric radiographs. Angle Orthod 2001;71(5):396-403. 19. Kjellberg H, Ekestubbe A, Kiliaridis S, Thilander B. Condylar height on panoramic
radiographs: a methodologic study with a clinical application. Acta Odontol Scand. 1994;52(1):43-50.
20. Habets LLMH, Bezuur JN, Naeiji M, Hansson TL. The orthopantomogram and aid in diagnosis of temporomandibular joint problems. II. The vertical symmetry. J Oral Rehabil. 1988;15(5):465-71.
21. Sezgin OS, Celenk P, Arici S. Mandibular asymmetry in diferent occlusion patterns: a radiological evaluation. Angle Orthod. 2007;77(5):803-7. 22. Ferrario VF, Sforza C, De Franco DJ. Mandibular shape and skeletal divergency.