Authors
Priscila Moreira de Lima Pereira1
Íris Teixeira Soares1 Marcus Gomes Bastos2 Ana Paula Carlos Cândido1
1 Universidade Federal de Juiz de Fora, Instituto de Ciências Bioló-gicas, Departamento de Nutrição, Juiz de Fora, MG, Brasil.
2 Universidade Federal de Juiz de Fora, Faculdade de Medicina, Departamento de Clínica Médica, Juiz de Fora, MG, Brasil.
Submitted on: 06/05/2018. Approved on: 06/16/2018.
Correspondence to:
Priscila Moreira de Lima Pereira E-mail: priscilamlp_jf@hotmail.com
assessment of chronic kidney disease patients under
con-servative treatment
Espessura do músculo adutor do polegar para avaliação nutricional
de portadores de doença renal crônica em tratamento conservador
Introdução: Avaliar a associação da espes-sura do músculo adutor do polegar (EMAP) com o estado nutricional e propor pontos de corte para depleção de massa muscular em idosos portadores da doença renal crônica (DRC) em tratamento conservador. Meto-dologia: Estudo epidemiológico, delineamen-to transversal, incluindo portadores de DRC estágios 3 a 5, acima de 60 anos. Obteve-se dados socioeconômicos, clínicos, prática de atividade física e antropométricos. A EMAP foi descrita e comparada de acordo com o es-tágio da DRC, dados socioeconômicos, ativi-dade física e estado nutricional e correlacio-nada com idade, taxa de filtração glomerular e variáveis antropométricas. Foram produzi-das curvas Receiver Operating Characteris-tic (ROC), considerando como padrão de referência a classificação do índice de tecido magro. O ponto de corte foi definido pelo índice Youden. Resultados: Avaliou-se 137 indivíduos. A EMAP foi inferior nos desnu-tridos e/ou com depleção de massa muscular; no sexo masculino foi superior nos pratican-tes de atividade física (p<0,05). A medida se correlacionou moderadamente com IMC, circunferência da panturrilha e braquial, te-cido de massa magra, índice de tete-cido magro e massa celular corporal (r<0,7), e negativa-mente com a idade (r=-0,34). A análise da curva ROC determinou pontos de corte de 15,33 mm para o sexo feminino e 20,33 mm para o masculino, com acurácia de 72,22% e 62,50%, respectivamente. Conclusão: A EMAP serve para estimar a massa muscu-lar, e o ponto de corte sugerido é útil para afastar a probabilidade de depleção de massa muscular. Recomenda-se que seja utilizada de forma complementar na avaliação nutri-cional.
R
esumoPalavras-chave: Anthropometry; Nutrition Assessment; Muscles; Renal Insufficiency, Chronic; Conservative Treatment.
Introduction: Evaluate the association be-tween the thumb adductor muscle thick-ness and the patient’s nutritional status, and propose cutoff points for muscle mass depletion in elderly patients with chronic kidney disease (CKD) under conservative treatment. Epidemiological and cross-sectional study, including patients with CKD stages 3 to 5, older than 60 years. Socioeconomic, clinical, physical activity and anthropometric data was obtained. TAMT was described and compared ac-cording to CKD stage, socioeconomic data, physical activity, nutritional status and correlated with age, glomerular filtra-tion rate and anthropometric variables. Receiver Operating Characteristic (ROC) curves were produced, considering the lean tissue index classification as refer-ence. The cut-off point was defined by the Youden index. Results: We evaluated 137 individuals. The TAMT was lower in malnourished and/or depleted muscle mass individuals; among males it was higher among those who practiced physi-cal activities (p <0.05). This measure was moderately correlated with BMI, calf and brachial circumferences, lean body tis-sue, lean tissue index and body cell mass (r <0.7); negatively with age (r = -0.34). The ROC curve analysis determined cut points of 15.33 mm for females and 20.33 mm for males, with 72.22% and 62.50% accuracy, respectively. Conclusion: TAMT is used to estimate muscle mass and we suggest the cutoff point is useful to rule out the likelihood of muscle mass deple-tion. It is recommended that it be used in a complementary way in nutritional assess-ment.
A
bstRActKeywords: Anthropometry; Nutrition Assessment; Muscles; Renal Insufficien-cy, Chronic; Conservative Treatment.
INTRODUCTION
Chronic kidney disease (CKD) is increasingly preva-lent in many countries, becoming one of the major public health challenges with significant economic and social impacts.1 An overall prevalence of 11% to 13% is estimated, considering all stages.2
Malnutrition in CKD patients is common, and the probability increases linearly with decreased glome-rular filtration rate (GFR).3 It bears a multifactorial etiology, including factors such as anorexia, metabo-lic acidosis, increased oxidative stress, inflammatory cytokines, increased catabolism and decreased pro-tein synthesis.4,5 It is one of the main factors that ad-versely affects prognosis and is associated with longer hospitalization, higher morbidity and higher mortali-ty.6 The changes that occur in body composition and functional capacity, such as decreased muscle mass and decreased muscle function and strength,7,8,9 are related to factors such as depression, cardiometabolic complications, poor quality of life and bad prognosis, making the nutritional assessment of these individuals relevant.10
Lean mass assessment presents limitations, since changes in body water volume and bone mass in pa-tients with the disease contribute to errors in body composition assessment.11 Thus; new anthropometric measures are introduced to fill existing gaps in practi-cality, cost, reliability and reproducibility, such as the Thumb Adductor Muscle Thickness (TAMT).12
TAMT evaluation is a simple, low-cost, and non--invasive procedure. Such a muscle is the only one that can be directly measured. It is influenced by nutritional status, energy catabolism and physical inactivity; It is minimally interfered by body fat and body water12,13,14,15 and has a correlation with lean mass,13,14,16,17,18 being useful to help monitor nutritio-nal status.12,14,19
The present study aims to evaluate the associa-tion of TAMT with nutriassocia-tional status, and to propose cutoff points for the evaluation of muscle mass deple-tion in elderly patients with CKD under conservative treatment.
METHODS
STUDY DESIGN AND SAMPLE SELECTION
A cross-sectional, epidemiological study in which conservative treatment of CKD patients in stages 3 to 5 of both genders, aged 60 and over, was carried
out at the State Center for Specialized Care (CEAE) Centro Mineiro de Ensino e Pesquisa em Nefrologia (IMEPEN) in Juiz de Fora, Minas Gerais, Brazil. The site is a referral center and covers a population of 837,991 people, who live in 37 municipalities in the region.20
We used the Epi InfoTM software (6.04 version, Centers for Disease Control and Prevention, USA) for sample calculation. We considered the popula-tion living in the cities covered by the service,20 the prevalence of the disease in stages 3 to 5 (10.6%),2 standard error of 2%, confidence level of 99% and 20% of losses, totaling one sample of 120 individuals.
The inclusion criteria were: to have CKD in stages 3 to 5 under follow-up at CEAE/IMEPEN; age 60 ye-ars or older and not be the first on-site visit. Exclusion criteria were: presence of hypermetabolic diseases; fracture in one hand; amputation of any limb; be wheelchair user and/or use a pacemaker. Participants who met the inclusion criteria were randomly selected from the attendance schedule. Then, by means of a telephone contact, the procedures were carried out by the active search, sensitization and clarification about the project and the scheduling of the evaluations.
In accordance with ethical issues, approval from the Institutional Ethics Committee (opinion: 1,323,441, CAAE: 48067815.2.0000.5260) was obtained, and the participants signed a Free and Informed Consent Form.
STUDY VARIABLES
Initially, the participants answered a questionnaire containing socioeconomic information, presence of recent illnesses, injuries and/or fractures in the hands, dominant side and practice of physical activity, being considered physically active those who reported at le-ast 150 minutes of weekly exercise practice.21
Their weight was measured on an Tanita Ironman ™ Scale (model BC-553; Tanita Corporation, Japan). For height measurement we used the Alturexata® Estadiometer (Alturexata, Brazil). Body Mass Index (BMI) was calculated and classified according to Lipschitz,22 as recommended by the Brazilian Ministry of Health.23
circumference (BC) was measured in the left arm at the midpoint between the acromion and the olecra-non. The Frisancho recommendations were conside-red.25 The tricipital skin fold (TCF) was measured in the posterior midline of the left arm, between the acromion and the olecranon, in a triplicate, and we took the simple arithmetic mean between the two clo-sest values. Subsequently, the brachial muscle circu-mference (BMC) was calculated using the Harrison
et al. equation,26 and the adequacy was determined according to Frisancho.25
For body composition assessment we used the Body Composition Monitor® (BCM model; Fresenius Medical Care) tetrapolar bioimpedance, which distinguishes muscle mass from pathological fluid overload,27 which is in accordance with such methods considered gold standard methods, such as double x-ray emission densitometry (DEXA),28 and is specific for patients with kidney failure, and is applicable in all stages of the disease.29 We ob-tained the following data: lean mass tissue (LMT), which represents the body mass without fat tissue and excess extracellular water; lean tissue index, which is calculated by the quotient between LMT/ height,² and the body cell mass (BCM), which con-sists of the metabolically active cell mass, excluding the extracellular fluid of this tissue. The results were classified according to the manufacturer’s recom-mendations.30 Prior to testing, the participants were instructed to fast for eight hours, not to exercise, not to consume alcohol and foods containing caffeine in the 12 hours before the test; wear light clothing; and remove metal objects at the time of evaluation.
TAMT was measured with the individual sitting down, with hands relaxed and on the knees and ar-ms resting on the thigh, with the elbow flexed by 90° approximately. Participants were instructed to keep their thumbs apart at an angle of approximately 90° with the index finger. The Lange® analog adipome-ter (Beta Technology Inc.®, USA) was applied to the adductor muscle of the thumb situated at the apex of the imaginary triangle formed by the extension of the thumb and index finger.12 Measurements were perfor-med on both hands in triplicates, and the mean of the closest values was considered.
GFR was calculated from the creatinine test using the CKD-EPI (Chronic Kidney Disease Epidemiology Collaboration)31 equation and classified in stages ac-cording to KDIGO (2012).32
All the data was collected in a single evaluation, individually, by a properly trained team supervised by a senior researcher.
STATISTICAL ANALYSIS
Firstly, exploratory analyzes were performed to check data integrity and coherence. The quantitative variables were evaluated for the presence of outliers and the type of distribution by the Kolmogorov-Smirnov test.
Descriptive analysis of the sample was performed according to gender. Continuous variables with nor-mal distribution were represented by mean ± standard deviation and compared using the Student’s t-test; the non-parametric variables were described with me-dian, minimum and maximum values and the Mann-Whitney test was performed. The categorical variables were presented with absolute and relative frequencies and the Pearson’s chi-square test was used.
TAMT mean values were described and compared by the Student’s t-test according to CKD stage, socio-economic data, physical activity practice and nutri-tional status. Correlations between TAMT with age, GFR and anthropometric variables were assessed by the Pearson or Spearman correlation tests. Weak cor-relations were those less than 0.30; moderate, betwe-en 0,30 and 0,70; and strong, whbetwe-en higher than 0,70. The analyses were performed using the Statistical Package for the Social Sciences (version 17.0; SPSS Inc., Chicago, IL, USA), with a significance level set at 5.0%.
Receiver Operating Characteristic (ROC) curves we-re produced using the classification of the lean tissue in-dex less than or equal to the 10th percentile as a referen-ce, according to gender and age.30 The cutoff point was defined using Youden’s index, which represents the va-lue of a better balance between sensitivity and specifici-ty. The values of accuracy, sensitivity, specificity, positive and negative predictive values and their respective 95% confidence intervals (95% CI) were evaluated using the MedCalc™ software (version 17.9.7).
RESULTS
Regarding CKD stage, 14.7% were classified in stage 3A; the majority (52.2%) in stage 3B; 27.2%, at 4; and only 5.9% in stage 5. In addition, a large part of the sample had other CKD-associated morbi-dities, such as hypertension (86.9%), DM (51.1%) or both (48.2%). Regarding nutritional status, there is a high number of overweight individuals (60.3%) and a low prevalence of malnutrition (9.6%), according to BMI.
Table 1 depicts the characteristics of the sample according to gender. It is noteworthy that women had higher BMI values and lower muscle mass (evaluated by CC, BMC, bioimpedance and TAMT) in relation to men.
After analyzing TAMT in both hands, it was found that they were similar and strongly correlated in fe-males and fe-males (r = 0.88 and r = 0.84, respectively). Therefore, for the subsequent analyses, we evaluated only dominant hand’s TAMT.
Table 2 depicts TAMT’s mean values and standard deviation according to CKD stage, socioeconomic da-ta, physical activity practice and nutritional status. The measure was lower in individuals of both genders classified as underweight according to BMI, and with muscle mass depletion according to CC, BMC and le-an tissue index. TAMT was higher among the active individuals.
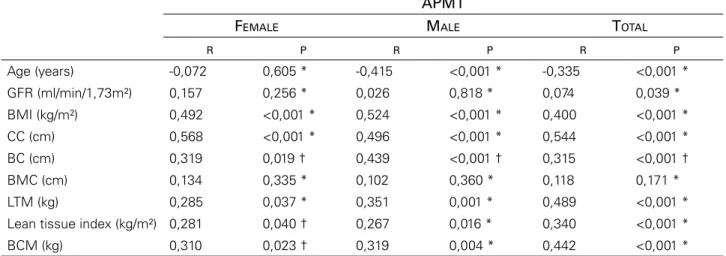
The female TAMT was positively and moderately correlated to BMI, CCC, BC, lean mass and BMC, and weakly to LMT and lean tissue index. Among males, there were positive and moderate correlations with BMI, CC, BC, lean mass, LMT and BMC, weak correlation with lean tissue index, and a negative and moderate with age (Table 3).
The ROC curve analysis determined cutoff point of 15.33 mm for women and 20.33 mm for males. Being more specific for women (80.0%) and more sensitive for men (70.8%). It should be noted that
* Test T Student. †Test Mann – Whitney. §Test Chi square.
Continuous variables with normal distribution, represented by mean values ± standard deviation. Non-parametric variables, represented by median, minimum and maximum values. Categorical variables, represented according to the absolute and relative frequencies.
DM: diabetes mellitus, SAH: systemic arterial hypertension, GFR: glomerular filtration rate, BMI: body mass index, CC: calf circumference, BC: brachial circumference, BMC: brachial muscle circumference, LTM: lean tissue mass; BCM: body cell mass, APMT: adductor pollicis muscle thickness.
Variable Female Male p
Age (years) 74,17 ± 7,22 72,30 ± 8,12 0,171 *
Monthly income (real) 937,00
(150,00 – 2000,00)
1000,00
(937,00 – 5000,00) 0,005 †
Monthly income (dollar) 293,73
(47,02 – 626,96)
313,48
(293,73 – 1567,40) 0,005 †
Schooling (incomplete
elementary school) 43 (79,6) 61 (73,5) 0,542 §
Physical activity practice 19 (35,2) 32 (38,1) 0,857 §
Presence of DM 27 (50) 43 (51,2) 1,00 §
Presence of SAH 50 (92,6) 70 (83,3) 0,128 §
Presença de SAH e DM 27 (50) 39 (46,4) 0,729 §
GFR (ml/min/1,73m²) 33,29 ± 11,02 34,36 ± 11,73 0,596 *
BMI (kg/m²) 29,85 ± 5,17 27,79 ± 4,89 0,019 *
CC (cm) 35,18 ± 3,37 36,85 ± 3,83 0,011 *
BC (cm) 32,00 (21,00 – 38,00) 30,00 (23,50 – 39,00) 0,065 †
BMC (cm) 23,29 ± 2,42 24,77 ± 3,18 0,004 *
LTM (kg) 29,86 ± 8,37 42,65 ±9,03 <0,001*
Lean tissue index (kg/m²) 12,70 (8,00- 24,90) 15,62 ± 3,06 <0,001†
BCM (kg) 16,10 (7,90 – 33,40) 24,58 ± 6,27 <0,001 † APMT dominant (mm) 17,22 ± 3,65 20,45 ± 5,10 <0,001 *
APMT not dominant (mm) 16,44 ± 3,92 19,74 ±4,90 <0,001 *
these values had an accuracy of 72.22% and 62.50%, respectively (Figure 1 and Table 4).
Considering these cut-off points, 33.3% of the women and 43.4% of the men had muscle mass de-pletion. Comparing the prevalence of muscle mass depletion, determined by TAMT, with those obtai-ned by other anthropometric measures, we noticed that in females, it was higher than that obtained by CC (9.3%), BC (5, 6%) and BMC (11.1%); howe-ver, it was similar to the diagnosis made by the thin tissue index of 35.2%. In males, it was higher than CC (6%), BC (16.9%) and lean tissue index (30%), similar to BMC results (45.8%).
DISCUSSION
In the present study, TAMT was significantly lower in the individuals classified as malnourished and/or with muscle mass depletion according to several pa-rameters. It correlated with other anthropometric me-asures, such as BMI, CC, BC, lean mass, BMC, LMT and lean tissue index. The proposed cutoff point had an accuracy of 72.22% for females and 62.50% for males.
The mean TAMT values obtained (20.45 ± 5.10 mm in males and 17.22 ± 3.65 mm in females) we-re lower than those found in studies with healthy
APMT
FEMALE MALE
n Mean ± SD p * n Mean ± SD p *
Stage of CKD
Stage 3 (A or B) 37 17,59 ± 4,03 0,201 54 20,35 ± 5,57 0,776
Stage 4 or 5 17 16,41 ± 2,59 28 20,69 ± 4,35
Schooling
Incomplete elementary school 43 17,08 ± 3,15 0,681 61 20,30 ± 5,41 0,550
Complete elementary school 11 17,79 ± 5,36 21 21,09 ± 4,34
Monthly income
≤ 937,00 real or 293,73 dollars 40 17,55 ± 3,50 0,228 41 19,77 ± 5,05 0,228 > 937,00 real or 293,73 dollars 14 16,29 ± 4,03 42 21,13 ± 1,17
Physical activity practice
Active (≥ 150 minutes / week) 44 17,10 ± 3,68 0,605 59 21,19 ± 5,34 0,042
Sedentary (< 150 minutes / week) 10 17,77 ± 3,68 24 18,67 ± 4,13
BMI
≥ 22kg/m² 51 17,55 ± 3,44 0,006 72 21,15 ± 4,71 0,001
< 22kg/m² 3 11,67 ± 3,06 10 15,50 ± 5,81
CC
≥ 31cm 49 17,61 ± 3,54 0,013 78 20,91 ± 4,81 0,001
< 31cm 5 13,40 ± 2,57 5 13,37 ± 5,17
BC
≥ 90% adequacy 51 17,55 ± 3,44 0,006 69 21,25 ± 4,72 0,001
< 90% adequacy 3 11,67 ± 3,06 14 16,53 ± 5,40
BMC
≥ 90% adequacy 48 17,14 ± 3,36 0,640 45 20,84 ± 4,73 0,458
< 90% adequacy 5 17,89 ± 5,89 38 20,00 ± 5,59
Lean tissue index
≥ p10 35 18,22 ± 3,43 0,005 56 21,48 ± 5,05 0,043
< p10 19 15,39 ± 3,40 24 19,47 ± 3,44
*Teste t de Student.
SD: standard deviation, APMT: adductor pollicis muscle thickness, CKD: chronic kidney disease, BMI: body mass index, CC: calf circumference, BC: brachial circumference, BMC: brachial muscle circumference.
APMT
FEMALE MALE TOTAL
R P R P R P
Age (years) -0,072 0,605 * -0,415 <0,001 * -0,335 <0,001 *
GFR (ml/min/1,73m²) 0,157 0,256 * 0,026 0,818 * 0,074 0,039 *
BMI (kg/m²) 0,492 <0,001 * 0,524 <0,001 * 0,400 <0,001 *
CC (cm) 0,568 <0,001 * 0,496 <0,001 * 0,544 <0,001 * BC (cm) 0,319 0,019 † 0,439 <0,001 † 0,315 <0,001 †
BMC (cm) 0,134 0,335 * 0,102 0,360 * 0,118 0,171 *
LTM (kg) 0,285 0,037 * 0,351 0,001 * 0,489 <0,001 *
Lean tissue index (kg/m²) 0,281 0,040 † 0,267 0,016 * 0,340 <0,001 * BCM (kg) 0,310 0,023 † 0,319 0,004 * 0,442 <0,001 * * Pearson correlation; † Spearman correlation..
APMT: adductor pollicis muscle thickness, GFR: glomerular filtration rate, BMI: body mass index, CC: calf circumference, BC: brachial circumference, BMC: brachial muscle circumference, LTM: lean tissue mass; BCM: body cell mass.
Figure 1. Receiver Operating Characteristic (ROC) curve to
discriminate muscle mass depletion according to the thumb adductor muscle thickness.
and younger populations, such as the study ran by Gonzalez et al.19 (whose values were 26.1 ± 4.4 mm and 19.8 ± 3.3 mm for men and women, respectively), and Bielemann et al.18 (24.2 ± 4.2 mm for both gen-ders). However, it was higher than those from other studies with healthy subjects, performed by Ghorabi
et al. (2014)33 (the mean values for males and females were 14.6 ± 3.2 mm and 11.2 ± 2.4 mm, respectively)
and by Lameu et al. (2004)12 (men: 12.5 ± 2.9 mm and women: 10.5 ± 2.3 mm). Our findings were also higher than those from other studies with ill individu-als, such as outpatient HIV-infected patients,34 large--scale gastrointestinal-surgical patients,14 inpatients in intensive care units.35
No other study evaluating TAMT in patients with CKD on conservative treatment was found in the lite-rature, there were only studies involving patients un-dergoing dialysis treatment, such as those carried out by Oliveira et al.36 and Pereira et al.37, who presented lower mean values than those in this study: 10.0 ± 4.5 mm and 11.9 ± 1.6 mm, for both genders, respective-ly. This is justified by the fact that at the non-dialysis stage, the prevalence of malnutrition is lower than in the dialysis phase.38 In these studies, the authors con-cluded that TAMT is a promising marker of nutritio-nal status,37 and it may be a useful parameter for the early diagnosis of malnutrition, risk assessment for hospitalization and mortality.36
Regarding the different TAMT values found in the studies, some considerations should be made. First, sample characteristics such as gender, age, race/skin color, body size, nutritional and health conditions in-terfere with the results.12,13,14 In this study, although the sample is made of elderly individuals and patients with a disease that depletes muscle mass, the preva-lence of overweight individuals was high and malnu-trition was low, which may have overestimated the values. Another factor that may cause divergences are the methodological inadequacies, since research iden-tifying very discrepant values may be based on errors
related to the calibration and the type of instrument adopted for the assessment,19 intra- and inter-exami-ner variability and the incorrect clamping of the ana-tomical site, because very low measures represent the thickness of the skinfold near the muscle, and not of the TAMT.18
TAMT measurements were different between the genders, being higher in males, as per reported by other authors.12,18,33,34,36 Skeletal muscle mass is in-fluenced by testosterone levels, so men often present a higher muscle density. This measure was also in-fluenced by age, since it was negatively correlated wi-th it (r = -0.335), as well as wi-that identified by Pereira
et al.,37 when evaluating patients with CKD under dialysis (r = -0, 32). It is known that the thickness of this muscle tends to decrease with age, being more significant as of the age of 65 years.12,33 Aging reduces the amount of type-2 fibers because of the neuroge-nic changes that induce denervation, something that, together with the lower production of mitochondrial adenosine triphosphate, causes a reduction in muscle mass.39 Such a fact should be considered in our sam-ple, since the mean age is 72.89 ± 7.66 years.
Another factor that seems to interfere with TAMT is laterality. Although there is no consensus on the side to be evaluated, a large part of the studies opt for the dominant hand, as well as the pioneering work of Lameu et al.12 One possible justification for this choi-ce would be the fact that the muscle was responsible for the opposition of the thumb, a movement perfor-med in almost all routine activities, being more requi-red in the dominant hand. Thus, there is a tendency to be measured in this hand, since the most exercised muscle tends to atrophy more rapidly in a situation of malnutrition.13
The results show evidence that the TAMT can be used as an indicator of muscle mass, since it has
remained associated and correlated with other anthro-pometric measures that evaluate the same compart-ment (CC, BC, lean mass, LMT, BMC and lean tissue index), similar to that found by other authors.12,33,34,36 However, this should be interpreted with caution, be-cause anthropometric measurements have limitations, such as the tendency to overestimate muscle mass, when compared to a reference standard.40
The suggested cutoff point is useful to rule out the probability of muscle mass depletion, since men with TAMT greater than 19.33 mm and women wi-th TAMT greater wi-than 15.33 mm have 82.5% and 77.8%, respectively, likelihood of muscle mass deple-tion (negative predictive values). However, to confirm the diagnosis of muscle mass depletion, we recom-mend that the measurement be associated with other anthropometric indicators.
It should be noted that sensitive tests are impor-tant for the early detection of muscle mass depletion in CKD patients, and are essential for reducing the risks inherent to the presence of sarcopenia, preven-ting the fragility syndrome, providing well-being8 and achieving a better prognosis.35 In addition, the-re is evidence that a poothe-rer nutritional status at the beginning of dialysis contributes to lower survival and greater likelihood of developing complications.6 However, since there is no ideal protocol for the nutri-tional assessment of these individuals, it is advisable to employ a combination of indicators to improve the nutritional diagnosis accuracy. In general, dual X-ray absorptiometry (DEXA) is suggested as the ideal me-thod to assess muscle mass, but its low availability and high cost limit its use in clinical practice. In this way, alternative methods such as the TAMT gains relevance.
Among the limitations of this study are its cross-sectional nature, which does not enable us to establish CI: confidence interval, PPV: positive predictive value, NPV: negative predictive value.
Female Male
Cutting point (mm) 15,33 20,33
Youden index 0,38 0,31
Acuracy (%) (95% CI) 72,22 (58,36 – 83,54) 62,50 (50,96 – 73,08) Sensitivity (95% CI) 57,89 (33,50 - 79,75) 70,83 (48,91 – 87,38)
Specificity (95% CI) 80,00 (63,06 - 91,56). 58,93 (44,98 – 71,90)
PPV (95% CI) 61,11 (42,22 – 77,16) 42,50 (33,01 – 52,58)
NPV (95% CI) 77,78 (66,82 – 85,88) 82,50 (70,89 – 90,13)
the cause and effect relationship and the applicability of the measure to evaluate the clinical prognosis and changes in body composition in the long term; the ab-sence of a gold standard for assessing muscle mass, limiting the validity of the proposed cutoff points, and the fact that the study was designed to evaluate elderly patients with CKD under conservative treat-ment, limiting the extrapolation of results to other groups. However, although it presents limitations, the study is relevant due to the relevance of the theme and its originality.
CONCLUSION
We concluded that TAMT measurement can be used for the nutritional assessment of patients with CKD submitted to conservative treatment, since it has been associated with other anthropometric measures (CC, BC, lean mass, LMT, BMC and lean tissue index), demonstrating that it is effective in estimating muscle mass. The adoption of the proposed cutoff point is useful to rule out the probability of muscle mass de-pletion and should be used in a complementary way in nutritional assessment.
REFERENCES
1. Bastos RMR, Bastos MG, Ribeiro LC, Bastos RV, Teixeira MTB. Prevalence of chronic kidney disease, stages 3, 4 and 5 in adults. Rev Assoc Med Bras 2009;55:40-4. DOI: http://dx.doi. org/10.1590/S0104-42302009000100013
2. Hill NR, Fatoba ST, Oke JL, Hirst JA, O’Callaghan CA, Lasserson DS, et al. Global Prevalence of Chronic Kidney Disease–A Syste-matic Review and Meta-Analysis. PLoS One 2016;11:e0158765. DOI: http://doi.org/10.1371/journal.pone.0158765
3. Kovesdy CP1, George SM, Anderson JE, Kalantar-Zadeh K. Out-come predictability of biomarkers of protein-energy wasting and inflammation in moderate and advanced chronic kidney disease. Am J Clin Nutr 2009;90:407-14. DOI: http://dx.doi.org/10.3945/ ajcn.2008.27390
4. Carrero JJ, Stenvinkel P, Cuppari L, Ikizler TA, Kalantar-Zadeh K, Kaysen G, et al. Etiology of the protein-energy wasting syndrome in chronic kidney disease: a consensus statement from the Inter-national Society of Renal Nutrition and Metabolism (ISRNM). J Ren Nutr 2013;23(2):77-90. DOI: http://dx.doi.org/10.1053/j. jrn.2013.01.001
5. Taraz M, Taraz S, Dashti-Khavidaki S. Association between de-pression and inflammatory/anti-inflammatory cytokines in chro-nic kidney disease and end-stage renal disease patients: A review of literature. Hemodial Int 2015;19:11-22. DOI: https://doi. org/10.1111/hdi.12200
6. Wing MR, Yang W, Teal V, Navaneethan S, Tao K, Ojo A, et al.; Chronic Renal Insufficiency Cohort (CRIC) Study. Race modifies the association between adiposity and inflammation in patients with chronic kidney disease: findings from the chronic renal insu-fficiency cohort study. Obesity (Silver Spring) 2014;22:1359-66. DOI: https://doi.org/10.1002/oby.20692
7. Kim JC, Kalantar-Zadeh K, Kopple JD. Frailty and protein--energy wasting in elderly patients with end stage kidney di-sease. J Am Soc Nephrol 2013;24:337-51. DOI: http://dx.doi. org/10.1681/ASN.2012010047
8. Fahal IH. Uraemic sarcopenia: aetiology and implications. Ne-phrol Dial Transplant 2014;29:1655-65. DOI: https://doi. org/10.1093/ndt/gft070
9. Heiwe S, Jacobson SH. Exercise training in adults with CKD: a sys-tematic review and meta-analysis. Am J Kidney Dis 2014;64:383-93. DOI: https://doi.org/10.1053/j.ajkd.2014.03.020
10. Carrero JJ, Johansen KL, Lindholm B, Stenvinkel P, Cuppari L, Avesani CM. Screening for muscle wasting and dysfunction in patients with chronic kidney disease. Kidney Int 2016;90:53-66. DOI: http://dx.doi.org/10.1016/j.kint.2016.02.025
11. Cuppari L, Kamimura MA. Nutritional evaluation in chronic kidney disease: challenges in clinical practice. J Bras Nefrol 2009;31:21-7.
12. Lameu EB, Gerude MF, Corrêa RC, Lima KA. Adductor pollicis muscle: a new anthropometric parameter. Rev Hosp Clin Fac Med Sao Paulo 2004;59:57-62. DOI: http://dx.doi.org/10.1590/ S0041-87812004000200002
13. Andrade PV, Lameu EB. Espessura do músculo adutor do pole-gar: um novo indicador prognóstico em pacientes clínicos. Rev Bras Nutr Clín 2007;22:28-35.
14. Bragagnolo R, Caporossi FS, Dock-Nascimento DB, Aguilar--Nascimento JE. Adductor pollicis muscle thickness: a fast and reliable method for nutritional assessment in surgical pa-tients. Rev Col Bras Cir 2009;36:371-6. DOI: http://dx.doi. org/10.1590/S0100-69912009000500003
15. Freitas BJSA, Mesquita LC, Teive NJV, Souza SR. Classical An-thropometry and the Adductor Pollicis Muscle to Determine the Nutritional Prognosis in Patients with Cancer. Rev Bras Cance-rol 2010;56:415-22.
16. Caporossi FS, Caporossi C, Borges Dock-Nascimento D, de Aguilar-Nascimento JE. Measurement of the thickness of the adductor pollicis muscle as a predictor of outcome in critical-ly ill patients. Nutr Hosp 2012;27:490-5. DOI: http://dx.doi. org/10.1590/S0212-16112012000200021
17. Rosa TCA, Arakaki DG, Arruda ECF, Rodrigues AS, Raslan M, Freitas KC. Adductor pollicis muscle: potential anthropometric parameter in hospitalized individuals. Acta Sci 2015;37:111-7. DOI: http://dx.doi.org/10.4025/actascihealthsci.v37i2.25990 18. Bielemann RM, Horta BL, Orlandi SP, Barbosa-Silva TG,
Gonzalez MC, Assunção MC, et al. Is adductor pollicis mus-cle thickness a good predictor of lean mass in adults? Clin Nutr 2016;35:1073-7. DOI: http://dx.doi.org/10.1016/j. clnu.2015.07.022
19. Gonzalez MC, Duarte RR, Budziareck MB. Adductor pollicis muscle: reference values of its thickness in a healthy popula-tion. Clin Nutr 2010;29:268-71. DOI: https://doi.org/10.1016/j. clnu.2009.08.012
20. Brasil. Instituto Brasileiro de Geografia e Estatística (IBGE). Censo Demográfico [Internet] 2010 [cited 2017 Aug 7]. Avail-able from: http://www.censo2010.ibge.gov.br
21. Pescatello LS, Arena R, Riebe D, Thompson PD. ACSM’s guide-lines for exercise testing and prescription. 9th ed. Baltimore:
Lip-pincott Williams & Wilkins; 2014. p. 2-18.
22. Lipschitz DA. Screening for nutritional status in the elderly. Prim Care 1994; 21:55-67.
23. Brasil. Ministério da Saúde, OPAS, Fiocruz, Ministério do De-senvolvimento Social e Combate à Fome. Vigilância alimentar e nutricional - SISVAN: orientações básicas para a coleta, proces-samento, análise de dados e informação em serviços de saúde. Brasília: Ministério da Saúde; 2004.
24. WHO Expert Committee. Physical status: the use and interpre-tation of anthropometry. Technical Report Series 854. Geneva: World Health Organization; 1995.
25. Frisancho AR. Anthropometric Standards for the Assessment of Growth and Nutritional Status. Ann Arbor: University of Michigan Press; 1990.
27. Wabel P, Rode C, Moissl U, Chamney P, Wizemann V. Accu-racy of bioimpedance spectroscopy (BIS) to detect fluid status changes in hemodialysis patients. Nephrol Dial Transplant 2007;22:129.
28. Hecking M, Antlanger M, Winnicki W, Reiter T, Werzowa J, Haidinger M, et al. Blood volume-monitored regulation of ultrafiltration in fluid-overloaded hemodialysis patients: study protocol for a randomized controlled trial. Trials 2012;13:79. DOI: https://doi.org/10.1186/1745-6215-13-79
29. Wizemann V, Moissl U, Chamney O, Wabel P. Differences in hydration status between healthy, Pre-ESRD, dx and tx subgroups can be distinguished clearly with bioimpedance spectroscopy. In: 44th ERA-EDTA Congress; 2007 Jun 21-24;
Barcelona, Spain.
30. Wieskotten S, Moissl U, Chamney P, Wabel P. Reference ran-ges for human body composition and fluid overload [Internet]. 2006 [cited 2017 Aug 7]. Available from: http://www.bcm-fre-senius.de/files/information_on_reference_ranges.pdf
31. Levey AS, Stevens LA, Schmid CH, Zhang YL, Castro AF 3rd, Feldman HI, et al.; CKD-EPI (Chronic Kidney Disease Epide-miology Collaboration). A new equation to estimate glomeru-lar filtration rate. Ann Intern Med 2009;150:604-12.
32. KDIGO 2012. Clinical Practice Guideline for the Evaluation and Management of chronic Kidney Disease. Kidney Int Suppl 2013;3:3-150.
33. Ghorabi S, Vahdat Shariatpanahi Z, Amiri Z. Measurement of adductor pollicis muscle thickness in a healthy population in Iran and its correlation with other anthropometric parameters. Mal J Nutr 2014;20:237-43.
34. Cortez AF, Tolentino JC, Aguiar MRA, Elarrat RM, Passos RBF. Association between adductor pollicis muscle thickness, anthropometric and immunological parameters in HIV-positive patients. Clin Nutr ESPEN 2017;17:105-9. DOI: https://doi. org/10.1016/j.clnesp.2016.09.004
35. Ghorabi S, Ardehali H, Amiri Z, Vahdat Shariatpanahi Z. Association of the Adductor Pollicis Muscle Thick-ness With Clinical Outcomes in Intensive Care Unit Pa-tients. Nutr Clin Pract 2016;31:523-6. DOI: https://doi. org/10.1177/0884533615621547
36. de Oliveira CMC, Kubrusly M, Mota RS, Choukroun G, Neto JB, da Silva CA. Adductor pollicis muscle thickness: a prom-ising anthropometric parameter for patients with chronic re-nal failure. J Ren Nutr 2012;22:307-16. DOI: http://dx.doi. org/10.1053/j.jrn.2011.07.006
37. Pereira RA, Caetano AL, Cuppari L, Kamimura MA. Adductor pollicis muscle thickness as a predictor of handgrip strength in hemodialysis patients. J Bras Nefrol 2013;35:177-84. DOI: http://dx.doi.org/10.5935/0101-2800.20130029
38. McIntyre CW, Selby NM, Sigrist M, Pearce LE, Mercer TH, Naish PF. Patients receiving maintenance dialysis have more severe functionally significant skeletal muscle wasting than patients with dialysis-independent chronic kidney disease. Ne-phrol Dial Transplant 2006;21:2210-6.
39. Schiaffino S, Reggiani C. Fiber types in mammalian skeletal muscles. Physiol Rev 2011;91:1447-531.