and Daqing Qin
1,2Abstract
Due to the rapid development of large thermal power stations and nuclear power stations, it requires that the power grid should provide greater capability and flexibility. Security, stability, and economy in operation should also be taken into consideration. The pumped storage power station which has double peak regulating capability is a good choice to realize this goal. However, the existence of S shape characteristic of a pump turbine in generating mode at off-design condition makes it difficult to connect to the power grid. So it is necessary to analyze the reason of S shape characteris-tic in pump turbine by experimental investigation and numerical simulations. To achieve the above-mentioned object, numerical simulations of a pump turbine’s internal flow field were performed. The generating mode was analyzed by unsteady computational fluid dynamics simulation. The evolution of flow details in runner regions under the S shape characteristic conditions was observed by changing the guide vane opening. The unsteady flow structure and load on the blades in regions of S shape characteristic were obtained, which will contribute to the design of hydro-turbine.
Keywords
Hydraulic machinery, computational fluid dynamics, S shape characteristic, pump turbine, unsteady simulation
Date received: 16 June 2015; accepted: 5 January 2016
Academic Editor: Junwu Wang
Introduction
Rapid developments of large thermal power plants— either coal or nuclear—need more powerful and feasi-ble ability of the electrical system. It requires that the power grid should provide greater capability and flexi-bility. Rigorous safe, stable, and economical strategy of the electrical system is needed because of the random-ness of the electricity between demand and supply. Pumped-storage power plants have strong ability of peaking and are convenient in starting, stopping, and compensating. It can decrease the cost of electrical sys-tem construction and supply the need of peaking and frequency adjustment, which increases the quality and reliability of the electrical supply and improves the operating conditions of electrical system.
Pumped-storage power plants have taken the task of power-frequency control for the electrical grid.1Some real machine tests and experiments indicate that the unstable operation problems are possible to come into existence when the turbine subjected to S shape charac-teristics (Figure 1). Depending on the specific speed of
1School of Energy Science and Engineering, Harbin Institute of Technology, Harbin, China
2State Key Laboratory of Hydropower Equipment, Harbin Institute of Large Electrical Machinery, Harbin, China
Corresponding author:
Hongjie Wang, School of Energy Science and Engineering, Harbin Institute of Technology, Harbin 150001, China.
Email: wanghongjie@hit.edu.cn
the pump turbine, the discharge-speed as well as torque-speed characteristics at constant guide vane opening can be ‘‘S-Shaped.’’2In this case, the machine operation may become strongly unstable at runaway speed and beyond, with a significant increase in struc-tural vibrations and noise. Moreover, a stable runaway operating point is difficult to be reached and therefore the synchronization with the electrical network in safety conditions becomes impossible.3In this case, one rotational speed may correspond to three discharge val-ues, which will inevitably increase mechanical vibra-tions and noises to a larger extent. Most of all, it is difficult for the hydraulic machine to be synchronous with the power network. The existence of S shape char-acteristic in low head start of a pump turbine is the restriction of the pump turbine development. This will induce large pressure pulsations and vibrations in pump turbines.4–6And this characteristic of reversible pump turbine will lead to severe difficulties in the tran-sition process of generators cut-in.
The hydromechanical mode period depends on the rotating inertias, the penstock water inertia, and on the local gradient of the turbine characteristic in the S shape as it is well described by Martin.7,8To investigate the reason of S shape characteristic, some researches were carried out. Hasmatuchi2found that by numerical simulations the pressure fluctuation in the stay vane zone will increase from turbine status to runaway sta-tus. Anciger et al.9described the rotating stall and cavi-tation inception phenomena, which will lead to the instability of a pump turbine, using computational fluid dynamics (CFD) simulations. Yin et al.10 investigated the possible different flow patterns existing in pump turbine under off-design conditions in pump mode. The simulation result was compared with experimental data and they showed good agreements. Velocity field ana-lyzing in stay vanes and guide vanes found the ‘‘jet-wake’’ flow pattern in the pump turbine. And the S shape characteristic of a pump turbine was predicted
and the results coincided well with the experimental results.11The flow field in the turbine was described as well.12Tani and Okumura13improved the efficiency of the pump turbine under turbine status by applying the CFD method to the turbine design. Blanc-Coquand et al.14 analyzed the influence of blades’ number, flow rate, and vaneless zone area on the rotor–stator interac-tion by introducing unsteady CFD computainterac-tion of the pump turbine under both turbine status and pump sta-tus. Backman15 simulated the three-dimensional (3D) flow field of a pump turbine and studied the rotor– stator interaction through analyzing the flow distribu-tion, amplitude, and frequency of pressure fluctuations. Pettersen and Nielsen16 proposed the mathematical equations of pump turbine complete character curve according to the mathematical theory of pump turbine inner flow character. And ‘‘S’’ character was sketched according to the equation derivation and analysis. Hasmatuchi17found in the experiment that the pressure fluctuation of a turbine in the guide vane region will increase, and the low frequency component in the pres-sure fluctuation will increase evidently when the turbine steps into the ‘‘S’’ region. Gentner et al.18,19has evalu-ated several CFD procedures with different approaches for the calculation of the described instabilities in pump and turbine operation. Sun et al.20Studied the S char-acter of a pump turbine with discrete-event simulation (DES) model. Borresen and Knutsen21 deeply studied the flow character under turbine status; however, the flow character under runaway status and braking status are less studied. The article carefully examined the flow field of a pump turbine under turbine mode, runaway mode, and braking mode at different guide vane open-ings. The mechanism of S shape characteristic of the turbine was analyzed.
Case description
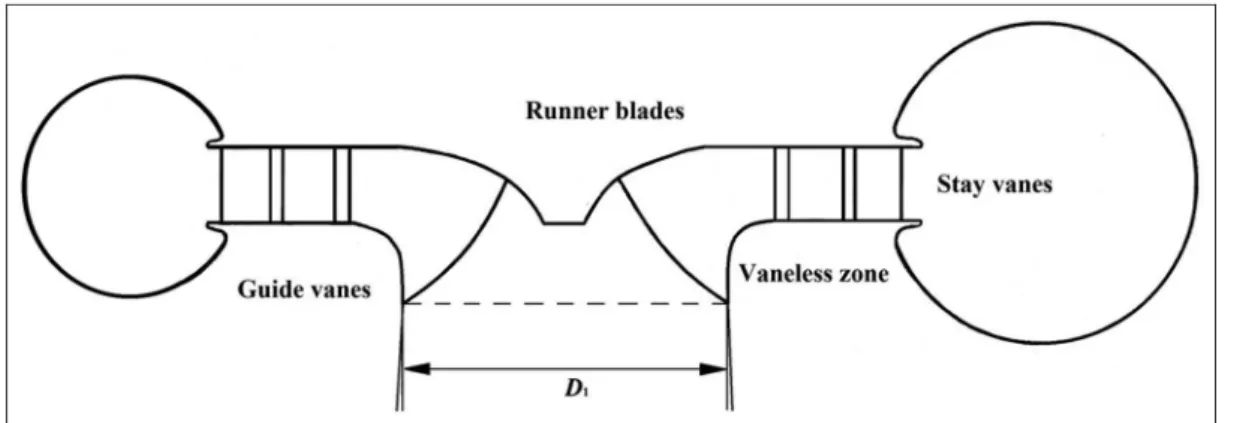
The parameters of pump turbine model studied in the article are shown in Table 1. Figure 2 shows the meri-dional sketch of the turbine runner. The scaled model parameters are provided by Harbin Institute of Large machinery. The specific speed of the scaled model is nq= 29.58 r min21. The whole flow passage of the
scaled turbine is simulated in the article. The scale tur-bine model includes spiral casing, stay vanes, guide vanes, runner, and draft tube (see Figure 3).
Numerical scheme
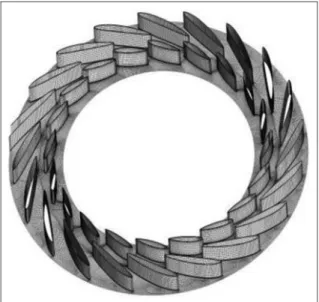
the numerical simulations. The code solves the incom-pressible unsteady time averaged Navier–Stokes equa-tions in a primitive variable form. No-slip condition is assumed on all the solid walls. The effects of turbulence are modeled using the shear stress transport (SST) model.10The flow near the wall area will be calculated by transport equation, and automatic near-wall treat-ment is introduced in the model. Boundary function will shift to the low Reynolds number wall function in the near-wall region, so that the continuity equation and momentum equation can be solved in the sub-layer. The mesh for simulations is generated by ICEM grid generator (see Figures 4–7).
Three different grid densities (fine-G1 with grid number of 9.96 million, medium-G2 with grid number of 6.62 million, and coarse-G3 with grid number of 4.43 million) were used to carry out the grid sensitivity check. The type G3-type mesh was the coarsest mesh in the simulation. The subsequent mesh was updated by 1.53 in the grid number. The grid quality was taken into consideration at each step of grid creation so that the mesh nodes did not correspond exactly to a 1.53 increase. The simulations were performed at the 45.5% guide vane opening, and operating condition n11= 35.529 r m1/2min21
,Q11= 0.3194 m1/2s21 , for all grid types. The grid convergence index (GCI) method was used to evaluate the numerical uncertainties and grid convergence. The extrapolation values and
uncertainty in the grid convergence were estimated using the GCI method:22 the computed flow para-meters are established in Table 2, and Figure 8 shows the grid check results. The approximate and extrapo-lated relative errors are estimated as
e21a = G1G2 G1 ð 1Þ
e21ext= G 21
extG2 G21 ext ð 2Þ Table 1. Geometrical parameters of scaled turbine.
Parameters Value
Runner low pressure diameter,D1(mm) 274
Blades number,Z 9 Guide vanes distribution diameter,D0(mm) 610.46
Guide vanes number,Z0 20
Guide vane height,B0(mm) 45.84
Stay vanes number,Zs 20 Figure 2. Meridional sketch of the turbine runner.
Figure 3. Model of scaled turbine.
G21ext=(r21G1G2)
(r211) ð
3Þ
The GCI from G2 to G1 was very low compared to the GCI from G3 to G2. And the turbine head and effi-ciency with the fine grid are closer to the experimental results. The converged solution with the fine grid Figure 5. Mesh in stay vanes and guide vanes.
Figure 6. Mesh results in runner: (a) mesh in runner and (b) mesh at blade inlet.
Figure 7. Mesh results in draft tube: (a) mesh in draft tube and (b) mesh at the cross section of draft tube.
Table 2. Computed flow parameters.a
Parameter Turbine head (H) Turbine efficiency (h)
r21 1.5 1.5
r32 1.5 1.5
G1 14.89 90.71 G2 14.87 90.78 G3 13.94 91.31 G21
ext 14.890439 90.69935 e21
a 0.0013432 0.000772 e21
ext 0.0000295 0.000117 GCI21
fine 0.0000369 0.000147 GCI32
med 0.0017182 0.001111
a
(G1 with grid number of 9.96 million) was used for fur-ther simulations at different operating conditions.
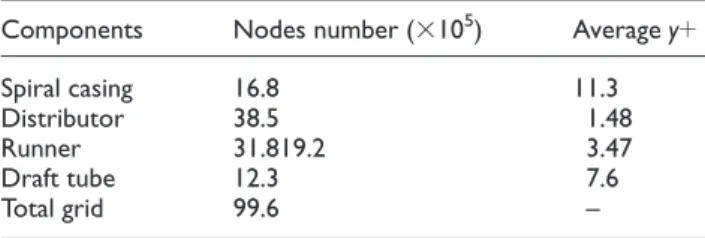
The grids near the wall are specially treated. And the grid information of each part is shown in Table 3. According to the recommendations of Versteeg and Mlalasekera,23y+= 11.63 can be regarded as the edge of boundary layer.
The inlet is set as mass flow inlet, the outlet of the turbine is set as pressure outlet, and the runner speed is set as the experiments. The interface between spiral cas-ing and stay vanes was simulated by general grid inter-face (GGI); the interinter-face between guide vanes and runner was simulated by transient frozen rotor; and the interface between runner and draft tube was simulated by transient frozen rotor.
Swirling strength method is applied to analyze the flow field in the article. Swirling strength method is an analysis method based on the critical point of local velocity gradient. The swirling strength is defined as the imaginary part of complex eigenvalue of velocity gradient tensor
lei= max
0, ∂vx ∂y
∂vy
∂x 1
2 ∂vx
∂x ∂vy
∂y + 1
4 ∂vx
∂x ∂vx
∂x + ∂vy
∂y ∂vy
∂y
ð4Þ
where x, y are x and y coordinates, respectively (m), and vx, vyare velocities in x and ydirections,
respec-tively (m s21 ).
Zhou et al.24,25proposed that the imaginary part of complex eigenvalue of velocity gradient tensor can dis-play the vortex structure and quantize local vortex intensity, and the parameter is defined as the swirling strength. Adrian et al.26 state that the method is a responsible method to identify and count vortexes in flow field.
Results discussion
The computations are carried out at the guide vane opening of 22.7%, 45.5%, and 145.5% (with respect to the best efficiency point guide vane opening, aBEP= 22 mm, set as 100% opening) under the
condi-tion of first quadrant in the turbine character chart. Several operating conditions are simulated under each guide vane opening. During the data process, time averaged results are used for efficiency (h), head (H), torque (T), and flux rate (q). Instantaneous results are attained for contours, streamlines, and pressure profiles.
Experiments are carried out on the hydraulic plat-form of Harbin Institute of Large machinery. The accuracy of the platform is designed to accord with standard of IEC 60193. Figure 9 shows the test rig in Harbin Institute of Large Electrical Machinery.
Figure 10 shows the numerical results and experi-mental results under the guide vane opening of 22.7%, 45.5%, and 145.5%. From the results we know that there is no S shape characteristic at the guide vane opening of 22.7%, that S shape characteristic in the character chart of 45.5% guide vane opening is not very evident or has slight S shape characteristic, and that there is evident S shape characteristic at the guide vane opening of 145.5%.
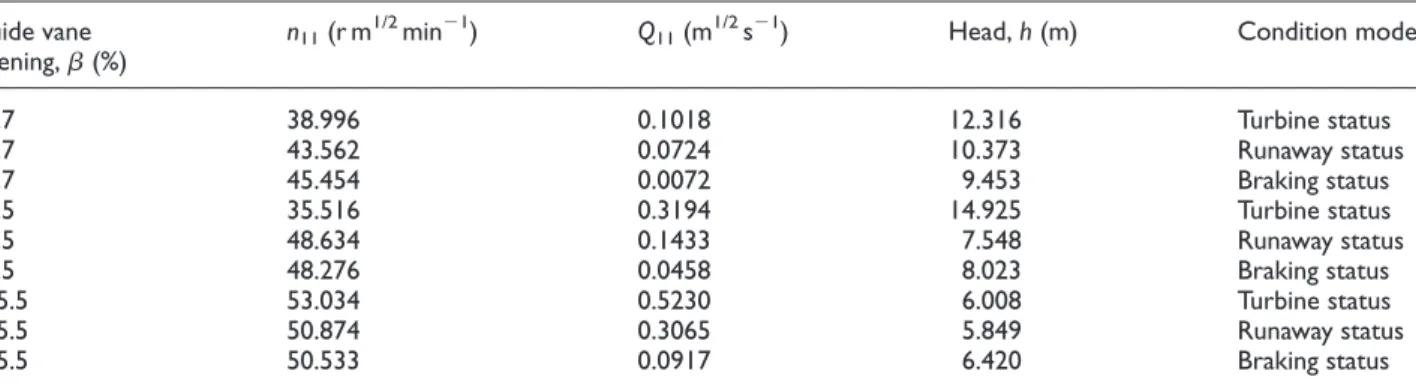
The operating conditions chosen to be analyzed are listed in Table 4. They are selected to be stable state (without S shape characteristic), limit of stability state (with less S shape characteristic), and unstable state (with evident S shape characteristic). The three points are located on the different positions of ‘‘S’’ zone of the Figure 8. Grid sensitivity check.
Table 3. Grid information.
Components Nodes number (3105) Averagey+
Spiral casing 16.8 11.3 Distributor 38.5 1.48 Runner 31.819.2 3.47 Draft tube 12.3 7.6 Total grid 99.6 –
character curve. Runaway conditions are the operating conditions in which the torque of the runner is zero. And breaking conditions are the operating conditions in which the torque of the runner is below zero. The shown results below are instantaneous ones. States with
the same runner phase are selected, for example, the runner at the same position relative to spiral casing and draft tube.
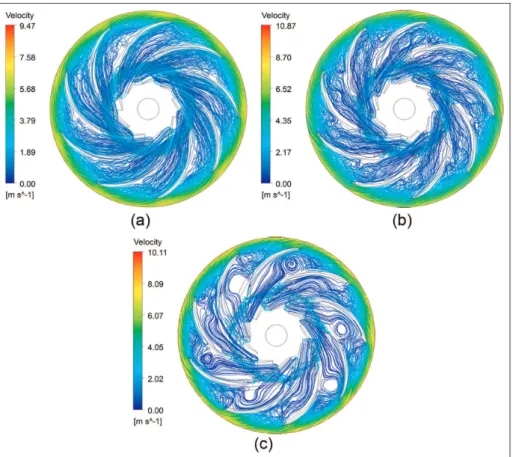
The runner is the components for a turbine to realize the energy transfer, which greatly affects the efficiency and stability of a turbine. Figures 11–13 show the streamline principle in turbine runner at the guide vane opening of 22.7%, 45.5%, and 145.5%, respectively.
There is almost no vortex in the runner under tur-bine operating status. The vortex has emerged in the runner under runaway operating status. There are more vortexes in the runner under braking operating status than under runaway operating status, and the vortex will block up the flow passage. The larger the guide vane opening, the smoother the streamline distribution, and the later the vortex movement emerge under run-away operating status and braking operating status. The vortex intensity will be weaker and the influenced region will be smaller. The reason is that the vanes pro-duce larger prevention to backflow of vaneless zone under smaller guide vane opening, which makes the vortex develop rapidly when the turbine step into run-away or braking operating status. While under larger guide vane opening, backflow in vaneless zone will transfer to the guide vane passage smoothly, which slows down the development of vortex at the runner inlet.
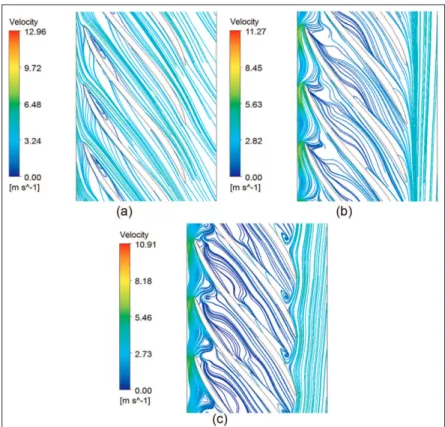
Figure 14 described the pressure surface, suction sur-face, leading edge, trailing edge, and rotational direc-tion of the turbine runner blades in the form of cascade expansion which will be analyzed in Figures 15–20.
Figures 15–17 show the streamlines distribution at the guide vane opening of 22.7%, 45.5%, and 145.5%, respectively. The cutting planes analyzed are the middle stream surface in each condition. At the guide vane opening of 22.7%, two vortexes will be produced at the runner inlet, and the rotational direction of two vor-texes is opposite to each other. Under braking status, the two vortexes at the runner inlet will merge and almost block the flow passage. The fluid at the inlet region cannot flow into the middle and tail part of the Figure 10. First quadrant character of pump turbine under
different guide vane openings: (a)n11–Q11profile and (b)n11–T11
profile.
Table 4. Simulation conditions. Guide vane
opening,b(%)
n11(r m1/2min21) Q11(m1/2s21) Head,h(m) Condition mode
Figure 11. Streamlines in runner at 22.7% guide vane opening: (a) turbine status (t= 0.36 s), (b) runaway status (t= .0352 s), and (c) braking status (t= 0.353 s).
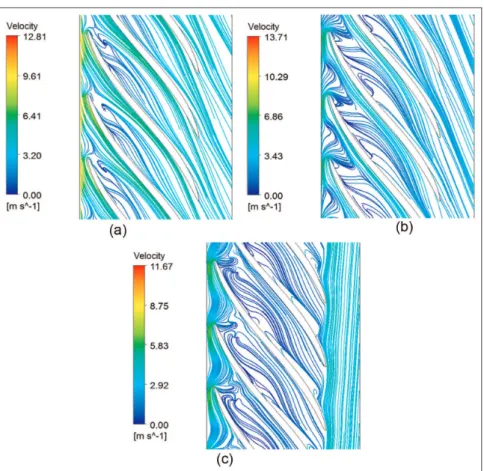
runner because of the blockage of the two vortexes. Contrariously, the fluid will flow back to the vaneless zone. Under turbine status, the flowback area is small and the vortex is weak. The flow is relatively steady and smooth. Under runaway status, the water will flow into the cone spirally because of the influence of two vortexes in the flow passage. Under braking status, the flow passage will be blocked by a vortex at the inlet, and another new vortex at the middle region of the flow passage will emerge. At the guide vane opening of 45.5% and 145.5%, similar principle will appear. The unsteady condition comes later or the turbine flow is more stable under large guide vane opening than that under small guide vane opening.
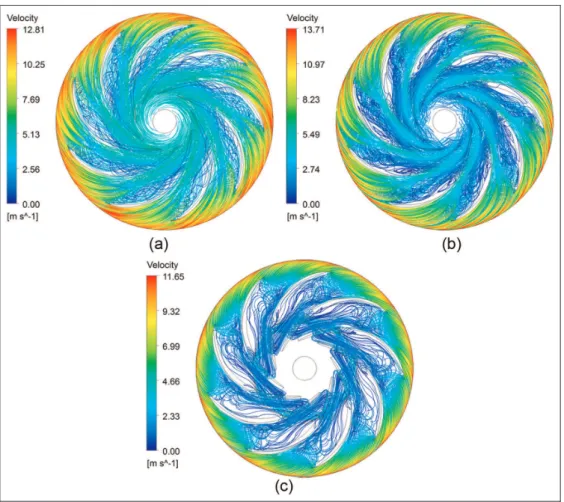
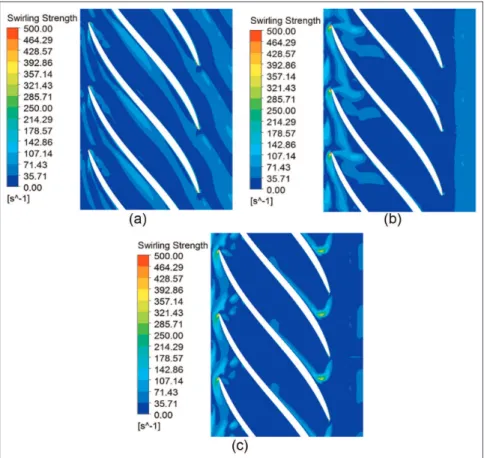
Figures 18–20 show the vortex intensity distributions in runner zone. Vortex with high intensity mainly distri-butes at the inlet and the outlet of the runner. The intensity of vortex at the outlet of the runner is larger than that of the vortex at the runner inlet. The increas-ing of guide vane openincreas-ing will enlarge the flux differ-ence between turbine status and braking status, which leads to a higher flow rate at which the vortexes appear under a larger guide vane opening. The vortex intensity Figure 13. Streamlines on the runner mid-span at 145.5% guide vane opening: (a) turbine status (t= 0.379 s), (b) runaway status (t= 0.401 s), and (c) braking status (t= 0.385 s).
Figure 15. Streamline distribution in the runner at the guide vane opening of 22.7%: (a) turbine status (t= 0.36 s), (b) runaway status (t= .0352 s), and (c) braking status (t= 0.353 s).
Figure 17. Streamline distribution in the runner at the guide vane opening of 145.5%: (a) turbine status (t= 0.379 s), (b) runaway status (t= 0.401 s), and (c) braking status (t= 0.385 s).
Figure 19. Vortex intensity distributions at 45.5% guide vane opening: (a) turbine status (t= 0.359 s), (b) runaway status (t= 0.369 s), and (c) braking status (t= 0.36 s).
will be larger and the vortex region will be wider. The ‘‘misplacement’’ and the difference of flow rate at which the vortex appear may be the reason of S-shaped char-acter. At the guide vane opening of 145.5%, the vortex will appear at the inlet and outlet of runner from run-away status to braking status, and the vortex will be enhanced during the processing. The flow stability will become worse.
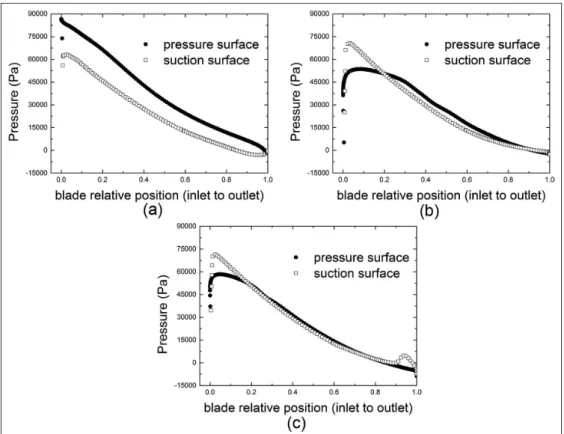
The load on the blades will be influenced a lot by flow profile in the runner. Figures 21–23 show the load on the blades under different conditions. At the inlet and outlet of the runner, the pressure on the pressure surface of a blade is lower than that on the suction sur-face due to the vortex at inlet and backflow at outlet under turbine status with guide vane opening of 22.7% and 45.5%. The fluid will obtain energy from the blades in this region. Some water with increasing energy will flow back to the vaneless zone, which will lead to the pressure increase. At the other location of a blade, the pressure on pressure surface of a blade is higher than that on the suction surface because the blades will obtain energy from fluid. The fluid will obtain energy from blades only at the inlet and there is no backflow at the outlet with the guide vane opening of 145.5%. Under runaway status and braking status, the region where the water receives power by runner blades
develops to the downstream caused by the increase in backflow area, which will lead to the lower pressure drop between pressure surface and suction surface. The torque on the runner is ‘‘0’’ under runaway status, while the torque on the runner is negative under braking status.
Conclusion
Figure 22. Pressure profile on the blade at 45.5% guide vane opening: (a) turbine status (t= 0.359 s), (b) runaway status (t= 0.369 s), and (c) braking status (t= 0.36 s).
runner inlet, and runner outlet. At larger guide vane openings, the vortex and backflow will appear in the runner till the turbine step into runaway status. It is to say that the development of vortex and backflow under large guide vane opening shows hysteresis quality with respect to that under small guide vane openings. The S-shaped characteristic is a natural characteristic for a certain hydro-turbine, it cannot be avoided; however, it can be reduced in the period of designing a turbine. Or we can avoid the turbine operating in the S-type section by controlling the motion principle of guide vane when the working condition of the turbine is adjusted.
Declaration of conflicting interests
The author(s) declared no potential conflicts of interest with respect to the research, authorship, and/or publication of this article.
Funding
The author(s) disclosed receipt of the following financial sup-port for the research, authorship, and/or publication of this article: This work was supported by Foundation for Innovative Research Groups of the National Natural Science Foundation of China (Grant No. 51121004) and the National Natural Science Foundation of China (Grant No. 51176040).
References
1. Kirschner O, Ruprecht A and Gode E. Experimental investigation of pressure fluctuations caused by a vortex
rope in a draft tube. IOP C Ser Earth Env 2013; 15:
062059.
2. Hasmatuchi V. Hydrodynamics of a pump-turbine at off-design operation conditions: numerical simulation. In: Proceedings of the ASME-JSME-KSME 2011 joint fluids engineering conference, Hamamatsu, Japan, 24–29 July 2011. New York: ASME.
3. Widmer C, Staubli T and Ledergerber N. Unstable char-acteristics and rotating stall in turbine brake operation of pump-turbines.J Fluid Eng: T ASME2011; 133: 041101. 4. Xiao R, Sun H, Liu W, et al. Analysis of S characteristics and its pressure pulsation of pump-turbine under pre-opening guide vanes.J Mech Eng2012; 48: 174–179. 5. Nennemann B and Parkinson E. YiXing pump turbine
guide vane vibrations problem resolution with advanced
CFD analysis. In:Proceedings of the 25th IAHR
sympo-sium on hydraulic machinery and systems, Timisoara, 20– 24 September 2010.
6. Braun O, Kueny JL and Avellan F. Numerical analysis of flow phenomena related to the unstable energy-discharge characteristic of a pump-turbine in pump mode. In:Proceedings of the 2005 ASME fluids engineer-ing division summer meetengineer-ing and exhibition, Houston, TX, 19–23 June 2005. New York: ASME.
7. Martin CS. Stability of pump-turbines during transient operation. In:Proceedings of the 5th international confer-ence on pressure surges, Hannover, 22–24 September 1986.
8. Martin CS. Instability of pump-turbines with S-shaped characteristics. In:Proceedings of the 20th IAHR sympo-sium on hydraulic machinery and systems, Charlotte, NC, 6–9 August 2000.
9. Anciger D, Jung A and Aschenbrenner T. Prediction of rotating stall and cavitation inception in pump turbines. IOP C Ser Earth Env2010; 12: 12013.
10. Yin JL, Liu JT, Wang LQ, et al. Performance prediction and flow analysis in the vaned distributor of a pump
tur-bine under low flow rate in pump mode.Sci China Tech
Sci2010; 53: 3302–3309.
11. Yin JL, Wang DZ, Wei XZ, et al. Hydraulic improve-ment to eliminate S-shaped curve in pump turbine.J Fluid Eng: ASME2013; 135: 071105.
12. Wang LQ, Yin JL, Jiao L, et al. Numerical investigation on the ‘‘S’’ characteristics of a reduced pump turbine model.Sci China Tech Sci2011; 54: 1259–1266.
13. Tani K and Okumura H. Performance improvement of pump-turbine for large capacity pumped storage plant in USA.Hitachi Rev2009; 58: 98–202.
14. Blanc-Coquand R, Lavigne S and Deniau JL. Experimen-tal and numerical study of pressure fluctuation in high
head pump-turbine. In: Proceedings of the 20th IAHR
symposium on hydraulic machinery and systems, Charlotte, NC, 6–9 August 2000.
15. Backman G.CFD validation of pressure fluctuations in a pump turbine. Lulea˚: Lulea˚ University of Technology, 2008.
16. Pettersen K and Nielsen TK. An explanation to the steep speed–flow characteristics of RPTs. In:Proceedings of the 22nd IAHR symposium, Stockholm, 26 June–2 July 2004. 17. Hasmatuchi V. Experimental investigation of a
pump-turbine at off-design operating conditions. In: Proceed-ings of the 3rd international meeting of the workgroup on cavitations and dynamic problems in hydraulic machinery and systems, Brno, 14–16 October 2009.
18. Gentner C, Sallaberger M, Widmer C, et al. Numerical and experimental analysis of instability phenomena in pump turbines.IOP C Ser Earth Env2013; 15: 032042. 19. Gentner C, Sallaberger M, Widmer C, et al.
Comprehen-sive experimental and numerical analysis of instability
phenomena in pump turbines.IOP C Ser Earth Env2013;
22: 032046.
20. Sun H, Xiao RF and Wang FJ. Analysis of the pump-turbine S characteristics using the detached eddy simula-tion method.Chin J Mech Eng2015; 28: 115–122. 21. Borresen B and Knutsen S. Numerical computation of
the pump turbine characteristic. In: Proceedings of the 21st IAHR symposium on hydraulic machinery and sys-tems, Lausanne, 9–12 September 2002.
22. Celik IB, Ghia U, Roache PJ, et al. Procedure for estima-tion and reporting of uncertainty due to discretizaestima-tion in
CFD applications. J Fluid Eng: ASME 2008; 130:
078001.
23. Versteeg HK and Mlalasekera W.An introduction to com-putational fluid dynamics: the finite volume method. New York: Wiley, 1995.
a guide vane opening (mm)
B0 guide vane height (mm)
D0 guide vanes distribution diameter (mm)
D1 runner diameter (mm)
e21
a approximate relative error
e21
ext extrapolated relative errors
G21
ext extrapolated value for G1 and G2 grid
type GCI21
fine grid convergence index for the fine grid
(G1) GCI32
med grid convergence index for the medium
grid (G2)
H head (m)
vx velocity inxdirection (m s )
vy velocity inydirection (m s2
1 )
x xcoordinate (m)
y ycoordinate (m)
y+ dimensionless wall distance (–)
Z blades number (–)
Z0 guide vanes number (–)
Zs stay vanes number (–)
b guide vane opening in percentage respect toaBEP(%)
r density (kg m23