A Novel Method for Quantifying the Inhaled
Dose of Air Pollutants Based on Heart Rate,
Breathing Rate and Forced Vital Capacity
Roby Greenwald1,2*, Matthew J. Hayat3, Jerusha Barton2, Anastasia Lopukhin2
1Division of Environmental Health, School of Public Health, Georgia State University, Atlanta, Georgia, United States of America,2Department of Environmental Health, Rollins School of Public Health, Emory University, Atlanta, Georgia, United States of America,3Division of Epidemiology and Biostatistics, School of Public Health, Georgia State University, Atlanta, Georgia, United States of America
Abstract
To better understand the interaction of physical activity and air pollution exposure, it is important to quantify the change in ventilation rate incurred by activity. In this paper, we describe a method for estimating ventilation using easily-measured variables such as heart rate (HR), breathing rate (fB), and forced vital capacity (FVC). We recruited healthy adoles-cents to use a treadmill while we continuously measured HR, fB, and the tidal volume (VT) of each breath. Participants began at rest then walked and ran at increasing speed until HR was 160–180 beats per minute followed by a cool down period. The novel feature of this method is that minute ventilation (V_E) was normalized by FVC. We used general linear mixed models with a random effect for subject and identified nine potential predictor vari-ables that influence eitherV_Eor FVC. We assessed predictive performance with afive-fold cross-validation procedure. We used a brute force selection process to identify the best per-forming models based on cross-validation percent error, the Akaike Information Criterion and the p-value of parameter estimates. We found a two-predictor model including HR and fBto have the best predictive performance (V_E/FVC = -4.247+0.0595HR+0.226fB, mean percent error = 8.1±29%); however, given the ubiquity of HR measurements, a one-predic-tor model including HR may also be useful (V_E/FVC = -3.859+0.101HR, mean percent error = 11.3±36%).
Introduction
The negative health consequences related to air pollution exposure are widely acknowledged and include cardiovascular, respiratory, and nervous system health effects [1–6]. Similarly, obe-sity is associated with many negative health outcomes including cardiovascular disease, type 2 diabetes, several different types of cancer, and many co-morbidities [7]. Physical activity is an important element in reducing the mortality and morbidity risks of obesity and improving overall well-being[8–12]. Physical activity increases the ventilation rate and in the presence of
OPEN ACCESS
Citation:Greenwald R, Hayat MJ, Barton J, Lopukhin A (2016) A Novel Method for Quantifying the Inhaled Dose of Air Pollutants Based on Heart Rate, Breathing Rate and Forced Vital Capacity. PLoS ONE 11(1): e0147578. doi:10.1371/journal. pone.0147578
Editor:Tim S. Nawrot, Hasselt University, BELGIUM
Received:October 14, 2015
Accepted:January 5, 2016
Published:January 25, 2016
Copyright:© 2016 Greenwald et al. This is an open access article distributed under the terms of the Creative Commons Attribution License, which permits unrestricted use, distribution, and reproduction in any medium, provided the original author and source are credited.
Data Availability Statement:All relevant data are within the paper and its Supporting Information files.
Funding:Funding for this work came from NIEHS grant number K25ES020355. The funders had no role in study design, data collection and analysis, decision to publish, or preparation of the manuscript.
air pollution also increases the inhaled dose of air pollution. This issue is of particular concern in the field of active transportation (i.e., walking or bicycling), but also has implications for occupational or recreational activity in places of poor air quality. In order to better understand the interaction of physical activity with air pollution exposure, it is important to improve exist-ing methods of quantifyexist-ing the change in inhaled dose related to physical activity.
Numerous previous studies have examined the topic of ventilation rate and physical activity in the context of air pollution exposure. An early investigation by Samet et al. [13,14] used heart rate (HR) to predict minute ventilation (the rate of expired ventilation,V_E) in a panel of 58 adults and children in New Mexico who were engaged in three types of activities. They found that though the regression ofV_Eto HR produced approximately parallel curves for all subjects, there was as much as a 2–3 fold difference inV_Eat the same HR between subjects. Zuurbier et al. [15] performed the same measurements on a panel of commuters in the Nether-lands in order to estimate differences in exposure between commute types and had very similar
findings. Bernmark et al. [16] performed these measurements on a panel offive bicycle messen-gers in Stockholm and also found large inter-subject variability. Each of these studies demon-strated the need to regressV_Eto HR for each subject independently in order to obtain an equation that could then be used to estimate the inhaled volume of air in an ambulatory setting. Van Wijnen et al. [17] used a different approach to assess inhaled dose in a panel of cyclists, drivers and pedestrians in Amsterdam: they directly measured ventilation by having subjects exhale through a face mask connected to a gas meter. This study also found a variety of ventila-tion rates, but the mask employed to obtain these measurements is not conducive to large-scale
field studies of persons in natural settings. Beals et al. [18] examinedV_Ein 160 children and adults in California with a goal of quantifying the variability ofV_Eacross the population. They determined the distribution of ventilation rates for different types of activities and concluded there was a large amount of inter-subject variability in ventilation rates based on factors such as age, sex, and the amount of physical activity.
Two recently published studies have examined the air pollution inhaled dose in various set-tings using similar methodology: performing measurements ofV_Eand HR in a controlled set-ting, developing a regression model for each subject, then using ambulatory HR measurements to estimateV_Eand inhaled dose in a natural setting. Ramos et al. [19] estimatedV_Eand inhaled dose in 20 volunteers participating in indoor physical activities by performing theV_Eand HR regression for each subject individually. Cozza et al. [20] estimatedV_Eand inhaled dose in an occupational setting for two groups of participants, one group in a city street setting and the other in a forest park setting. In this study, a linear mixed effects model with random intercepts and slopes was developed for each group and again demonstrated the limitations of inter-sub-ject variability in the relationship ofV_Eand HR.
A third recent study by Faria et al. [21] used a unique approach to estimateV_Eand inhaled dose in pedestrians with a regression model based on power expenditure. This model requires information pertaining to pedestrian velocity and the incline gradient. Both of these predictors must be measured using dedicated equipment. It was validated in three subjects with a percent difference between predictions and observations ranging from 3–34%.
though still easily-measured breathing rate (or breath frequency, fB). The key novel feature of
this method is thatV_Eis normalized to forced vital capacity (FVC), an easily measured or esti-mated value closely related to an individual’s functional lung volume. Since FVC is largely determined by a person’s age, height, sex, and race, this normalization procedure facilitates comparison of data from persons of various body morphologies and lung sizes.
Methods
Study Design
This study was approved by the Emory University Institutional Review Board. Written consent was obtained from all participants. For participants under 18 years of age, this consisted of written parental consent along with written assent by the subject. Subjects 18 years or older provided their own written consent. A repeated measures study design was used. This study was nested within a larger ongoing project examining air pollution exposure in adolescent ath-letes, and therefore, in order to match the population of the parent study, we recruited a panel of 15 healthy adolescents who participate in extracurricular athletic activities from a high school in Atlanta, Georgia.
Data collection
Study participants engaged in physical activity in the form of walking and running on a tread-mill in the high school’s indoor sports facility. A treadtread-mill test was selected over a stationary cycling test in the interest of similarity to the types of activities performed in the main study. The treadmill test consisted of about a minute at rest, a minute of walking, and 4–5 minutes of running at gradually increasing speed until HR reached 160–180 beats per minute. At this point, subjects decreased to a jog and then a walk for a cool down period of 3–4 minutes.
During the entire treadmill test, subjects wore a chest strap with an integrated electronic device for the continuous measurement of HR and fBas well as an accelerometer for measuring
motion (BioHarness 3, Zephyr Technology Corp.). This device measures the electrocardiogram through two leads, and fBis measured by a chest expansion sensor, both embedded in the
strap. The BioHarness is equipped with a Bluetooth1transmitter, and HR and fBwere
moni-tored in real-time during the treadmill test by study personnel using a laptop computer. We measured the tidal volume (VT) of each exhalation throughout the entire treadmill test
by connecting the exhalation port on a face mask (Training Mask 2.0, Training Mask) to a res-pirometer (Wright Mark 8, nSpire Health Inc.). This model of mask fits tightly against the face and is designed to be worn during intense physical activity. We saw no evidence of air flow leakage around the mask even at high inspiratory or expiratory flow. We removed the resis-tance valves that are used with this mask for training purposes, and during pre-test evaluation, we detected little resistance to either inspiratory or expiratory flow using the mask and respi-rometer set-up, even at high ventilation rate. Subjects were instructed to stop the test and remove the mask immediately if they experienced difficulty breathing, though this did not hap-pen in practice.
Both before and after the treadmill test, subjects performed three spirometry maneuvers using a handheld spirometer (EasyOne Plus, ndd Medical Technologies Inc.) under the direc-tion of trained study staff following the recommended procedures of the American Thoracic Society. The forced vital capacity maneuver (FVC) was used, and measurements used for data analysis were FVC, forced expiratory volume in one second (FEV1), and the FEV1/FVC ratio.
Data processing
The BioHarness proprietary software creates a summary file containing data with 1-second time resolution, including HR (beats per minute), fB(breaths per minute) and an activity
parameter (ACT) equal to the vector addition of three-dimensional acceleration expressed as a fraction of standard gravity. We then examined the respirometer data, and each time an exha-lation was observed, the total volume of that breath (VT) was added to the summary file at the
time the exhalation began. This resulted in a new data file with 1-second time resolution con-taining HR, fB, ACT and VTdata. From this compilation, we created four time-averaged data
sets: 60-, 30-, and 15-second averages, and an“individual breath”data set of averages since the previous breath (typically 1–7 seconds). For all data sets, each row contained the corresponding average of HR, fB, and ACT as well as VTdata. We then added several additional columns of
calculated values to the data sets, namelyV_E, bothV_Eand VTnormalized to FVC, and a
dichot-omous indicator variable labeled“warm”(for warm up or cool down) equal to zero if HR was increasing and one if decreasing. Due to the design of the treadmill test, in most cases, HR monotonically increased to the maximum value and then decreased during the cool down period. It is important to point out thatV_Ein these data sets is calculated as VTtimes fBand
therefore represents the mean volumetricflow rate during the averaging period rather than the literal volume of air inhaled in one minute.
Statistical methods
We used general linear mixed models to model the multipleV_E/FVC measurements taken on each participant. This is an appropriate statistical model to use with repeated measures data [22]. We included a random effect for subject to account for the multiple measurements taken over time on each subject. To explore the sensitivity of model estimates to within-subject covariance structure, we ran all models using variance components, compound symmetry, unstructured, andfirst order heterogeneous autoregressive covariance structures. One subject in particular appeared to exhibit increased variance inV_Eat higher values, and consequently the unstructured covariance matrix was unable to produce parameter estimates when this sub-ject was included. Otherwise, parameter estimates were not found to be sensitive to covariance structure. We used the PROC MIXED procedure of SAS v9.3 (SAS Institute Inc, Cary, NC) and the lme4 package for R v3.2.0 (R Foundation for Statistical Computing) to take advantage of both package’s respective features. Specifically, R was used to construct programming loops to evaluate hundreds of models in a single pass during the model selection process while SAS was used for the evaluation of covariance structures and calculation of p values for parameter estimates. All presented model results are from SAS using the variance components structure. The level of significance was seta prioriat 0.05.
We employed a brute force method of model selection wherein all possible combinations of predictors were evaluated. We included in the full model all measurements that could plausibly influenceV_E, namely HR, fB, ACT, warm, age, sex, body mass index (BMI), FEV1/FVC, and
a training set of 12 subjects and a validation set of three. Parameter estimates were calculated based on the training sets, predictions were made for the validation sets, and then the predic-tions from all five validation sets were assembled and compared with observapredic-tions. The cross-validated percent error was calculated as (predictions-observations)/observations.
Results and Discussion
Subject characteristics
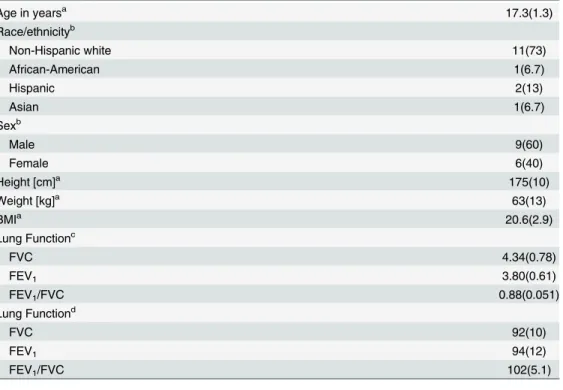
Subject information is provided inTable 1. Participants were 15–18 years of age and in good health as might be expected of adolescents who engage in athletic training and sporting activities. Height, weight, and BMI were normal for this age range. Three subjects reported having received a physician’s diagnosis of asthma in their lifetime, but only one of these reported asthma symp-toms in the previous year, and none were currently experiencing sympsymp-toms or taking asthma medication. Lung function measurements were compared to the standards established by the third National Health and Nutrition Examination Survey (NHANES III) [23] for the prediction of lung function values based on age, height, sex, and race. With the exception of two subjects (one of whom reported asthma symptoms in the previous year), FVC and FEV1were well above
the lower limit of normal values and were 85–115% of the NHANES III predicted values.
Selection of time-base for averaged values
As oxygen demand increases during physical activity,V_Eis elevated by increasing both fBand
VT. In addition, airways may begin to dynamically compress during rapid exhalation, and this
Table 1. Subject characteristics.
Age in yearsa 17.3(1.3)
Race/ethnicityb
Non-Hispanic white 11(73)
African-American 1(6.7)
Hispanic 2(13)
Asian 1(6.7)
Sexb
Male 9(60)
Female 6(40)
Height [cm]a 175(10)
Weight [kg]a 63(13)
BMIa 20.6(2.9)
Lung Functionc
FVC 4.34(0.78)
FEV1 3.80(0.61)
FEV1/FVC 0.88(0.051)
Lung Functiond
FVC 92(10)
FEV1 94(12)
FEV1/FVC 102(5.1)
aValues are mean(SD)
bValues are frequency(percentage)
cValues are mean(SD) of the measured values (in L) or ratios
dValues are mean(SD) of the percent of the NHANES III predicted values
stimulates termination of exhalation and initiation of the following breath [24]. This phenome-non may manifest itself as a comparatively shallow breath followed rapidly by a larger breath. Given thatV_Eis calculated as the product of VTand fB, on time scales of a few breaths or less,
this may result in a noisyV_Esignal. Longer averaging times will reduce this noise, but at the same time, true changes in HR andV_Eoccur on a time scale comparable to changes in activity level and oxygen demand. Therefore, choosing an averaging time that is too long may obscure intermediate data points and reduce statistical power. We evaluated selected models at all four averaging times and obtained similar parameter estimates. Estimates for a model containing HR and fBas predictors are shown inTable 2. As can be seen from these results, predictive
per-formance as assessed by cross-validation improves with longer averaging times while confi -dence intervals broaden due to reduced statistical power, although all estimates presented in
Table 2have p<0.0001. Given the similarity in model results across time-bases, we chose to
focus on the 30-second average data set as a compromise between the extremes, and all the fol-lowing results are from this data set.
Model selection
UsingV_E/FVC as the dependent variable, we followed a brute force process for the selection of predictors by evaluating all 511 possible models containing from one to nine of the full set of pre-dictors, including HR, fB, ACT, warm, age (years), sex (coded 0 for male and 1 for female), BMI,
FEV1/FVC, and height (cm). For a given number of predictors, the best model was selected based
on the cross-validated percent error, AIC values, and the p-value of parameter estimates, and the results for models using 30-second averaged data are shown inTable 3. For models containing between three and eight predictors, the model with the lowest percent error was not the same as the one with the lowest AIC. In this situation, we examined the p-value of the parameter esti-mates to determine if there was a higher degree of confidence in the estimates of a particular model based on the cumulative p-values. In all cases, we unambiguously identified one model as surpassing the other models for that number of predictors. By using all three of these criteria, the brute force selection process produced a pattern identical to both a forward and backward step-wise selection process; however, if only cross-validation percent error or AIC were independently used as model selection criteria, both stepwise selection processes would have produced predictor selection patterns different from each other as well as what is shown inTable 3.
This discussion of the predictor selection process is essentially moot however since, as can be seen from the results inTable 3, addition of predictors beyond HR and fBdid not improve
Table 2. Influence of averaging time on parameter estimates. For parameter estimates, the first row is the estimate, and the second row is the 95% confi-dence interval. All have p<0.0001. Percent error refers to the difference between predictions and observations from cross validation, and values are mean (standard deviation).
IBa 15 sec. 30 sec. 60 sec.
Intercept -4.28 -4.20 -4.25 -4.34
-5.40,-3.16 -5.35,-3.05 -5.49,-3.00 -5.73,-2.95
HR 0.057 0.060 0.063
0.054,0.062 0.051,0.064 0.051,0.068 0.051,0.075
fB 0.24 0.24 0.23 0.21
0.22,0.26 0.21,0.26 0.19,0.26 0.16,0.26
Percent error 12.3(54)% 8.9(31)% 8.1(29)% 7.2(26)%
aIndividual Breath: HR, f
predictive performance. While the addition of ACT, warm, age, sex and BMI to the model low-ered the AIC value, it actually worsened the cross-validated percent error. In all models con-taining both HR and fB, the p-value for these parameter estimates was less than 0.0001, and in
the case of fB, the magnitude of the parameter estimate was practically unchanged by additional
predictors. Since the dependent variable isV_Enormalized by FVC, it was not surprising that factors with a strong influence on FVC (specifically height, sex, and age) would not be effective predictors ofV_E/FVC.
The rate of change of both fBor VTmay be sensitive to whether activity intensity is
increas-ing or decreasincreas-ing [25]. We parameterized this effect by using the dichotomous indicator vari-able“warm”. In a 4-parameter model, the estimate for warm was 7, suggesting that for the same HR, fBand ACT,V_E/FVC would be a little more than half a unit higher in the cool-down period than in the warm-up period. Although this estimate was nominally significant with a p-value of 0.02, addition of this variable to the model slightly worsened cross-validated percent error compared to a 3-parameter model containing just HR, fB, and ACT. In a 3-parameter
model with HR, fB, and warm, the estimate for warm is quite small (0.015) with a highly
non-significant p-value of 0.92. For these reasons, we conclude that information concerning the direction of change of HR is not useful for predictingV_Ein this population.
We additionally evaluated two other parameters that could plausibly influenceV_E/FVC: BMI and FEV1/FVC. Since it is well-known thatfitness level improves lung function [26,27],
we explored its effect onV_E/FVC by using BMI as a proxy. Without exception, including BMI as a predictor worsened predictive performance. In a 3-parameter model including HR, fB, and
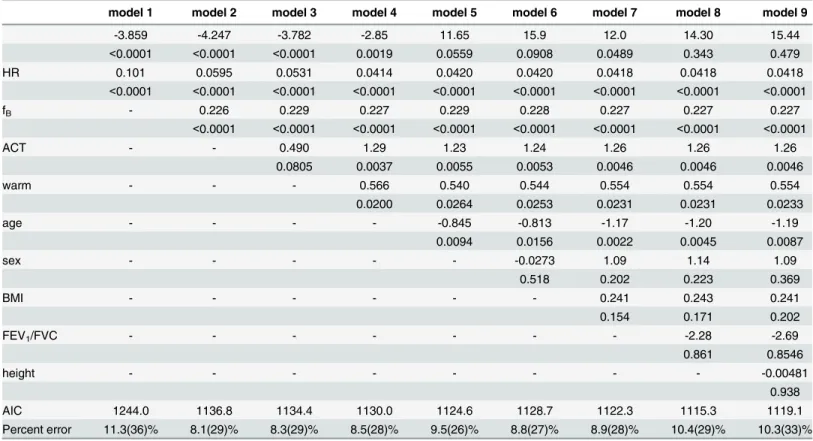
Table 3. Results of general linear mixed models, displaying predictors included in each model, parameter estimates, p-values, model AIC values, and percent error.In all models, the dependent variable isV_
E/FVC. For parameter estimates, thefirst row is the estimate, and the second row is the p-value. Percent error refers to the difference between predictions and observations from cross validation, and values are mean(standard deviation).
model 1 model 2 model 3 model 4 model 5 model 6 model 7 model 8 model 9
-3.859 -4.247 -3.782 -2.85 11.65 15.9 12.0 14.30 15.44
<0.0001 <0.0001 <0.0001 0.0019 0.0559 0.0908 0.0489 0.343 0.479
HR 0.101 0.0595 0.0531 0.0414 0.0420 0.0420 0.0418 0.0418 0.0418
<0.0001 <0.0001 <0.0001 <0.0001 <0.0001 <0.0001 <0.0001 <0.0001 <0.0001
fB - 0.226 0.229 0.227 0.229 0.228 0.227 0.227 0.227
<0.0001 <0.0001 <0.0001 <0.0001 <0.0001 <0.0001 <0.0001 <0.0001
ACT - - 0.490 1.29 1.23 1.24 1.26 1.26 1.26
0.0805 0.0037 0.0055 0.0053 0.0046 0.0046 0.0046
warm - - - 0.566 0.540 0.544 0.554 0.554 0.554
0.0200 0.0264 0.0253 0.0231 0.0231 0.0233
age - - - - -0.845 -0.813 -1.17 -1.20 -1.19
0.0094 0.0156 0.0022 0.0045 0.0087
sex - - - -0.0273 1.09 1.14 1.09
0.518 0.202 0.223 0.369
BMI - - - 0.241 0.243 0.241
0.154 0.171 0.202
FEV1/FVC - - - -2.28 -2.69
0.861 0.8546
height - - - -0.00481
0.938
AIC 1244.0 1136.8 1134.4 1130.0 1124.6 1128.7 1122.3 1115.3 1119.1
Percent error 11.3(36)% 8.1(29)% 8.3(29)% 8.5(28)% 9.5(26)% 8.8(27)% 8.9(28)% 10.4(29)% 10.3(33)%
BMI, the estimate for BMI was -0.064 (p = 0.71), leading us to the conclusion that BMI is not a useful predictor ofV_E/FVC in this population. A reduction in FEV1/FVC is associated with
air-way obstructions whereas airair-way restrictions tend to reduce both FEV1and FVC[28].
Individu-als with a low ratio could experience reduced VTat high fBcompared to individuals with a
normal or high ratio; however, our model results do not suggest an association between FEV1/
FVC andV_E/FVC. With respect to both BMI and FEV1/FVC, an obvious limitation of this
study is that all subjects were healthy adolescent athletes with BMI and FEV1/FVC well within
the normal range, and our results therefore do not preclude the possibility thatV_E/FVC may in other populations be influenced byfitness level or airway obstructive disease. As an alternative method for investigating the influence of FEV1, we evaluated all models usingV_Enormalized to FEV1as the dependent variable rather thanV_E/FVC. The cross-validation results for these models were essentially the same as forV_E/FVC, as might be expected since there was a very narrow range of FEV1/FVC ratios amongst our study subjects.
Recommended model
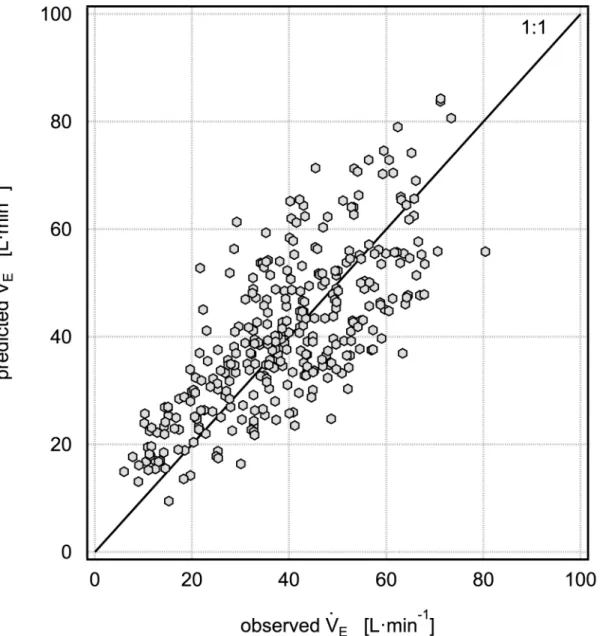
Given these considerations, our best or most practical predictive models are model 1:V_E/FVC = -3.859+0.101HR (with a mean percent error of 11.3±36% as shown inFig 1) and model 2:
_
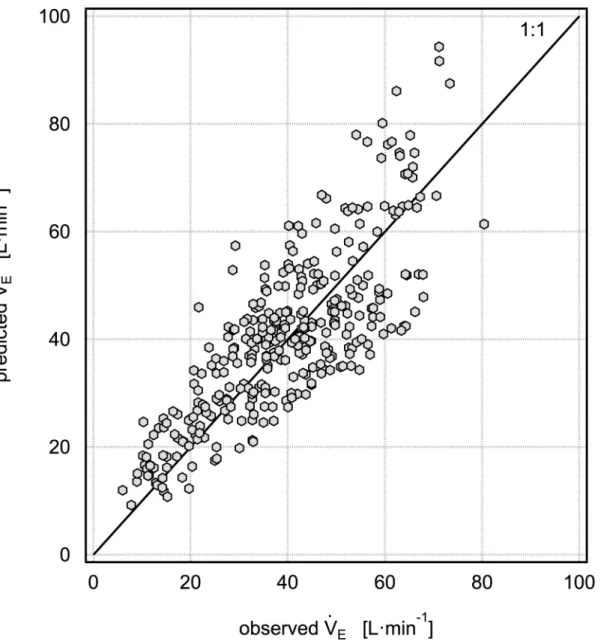
VE/FVC = -4.247+0.0595HR+0.226fB(with a mean percent error of 8.1±29% as shown inFig 2).
Although the mean cross-validated percent error is higher for model 1 than model 2, it has the advantage of only using one predictor, HR, which is very easily measured in thefield using a wide variety of inexpensive consumer devices. Model 2 additionally requires independent mea-surement of fB, which is easily obtained with unobtrusive devices in research studies but is
unlikely to be available in studies without dedicated equipment. As HR increases from baseline to modest levels of physical activity, both VTand fBincrease in an approximately linear fashion
with respect to HR. In this scenario, it would seem that HR alone would be sufficient to predict
_
VE/FVC. As HR continues to increase during more vigorous activity, VTplateaus andV_Emay only be increased by increasing fB[24]. We examined the possibility that a one-predictor model
with HR would have a higher predictive performance at HR<120, 130 or 140; however, we did
notfind this to be the case. We also examined the possibility that a one-predictor model with fB
would be advantageous, but we did notfind this to be true. The results for this model are
_
VE/FVC = -1.913+0.439fB(with a mean percent error of 9.7±38%). While this is marginally
bet-ter than model 1, it is not betbet-ter than model 2, and it is unlikely that there will be a situation in a
field campaign where fBdata is available while HR data is not.
Both models 1 and 2 require measurements of FVC in order to calculate V
:
Eand inhaled dose; however, in the absence of spirometry, reasonable estimates of FVC may be calculated for healthy individuals using the NHANES III [23] coefficients and subject height, age, sex, and race information.Fig 3shows the equivalent model 2 normalized to NHANES III predicted FVC. Although the mean cross-validated percent error is lower in this model than for model 2 normalized to measured FVC, this result is dependent on the degree to which measured FVC matched predicted FVC in this study population.
Use for estimation of inhaled dose
location, and air pollution measurements were performed with 1-minute time resolution, including the mass of particular matter less than 2.5μm (PM2.5).Fig 4shows the time series of
PM2.5inhaled dose for a soccer player and a sprinter on the track team. Both subjects were
males of the same age with approximately the same height and FVC. Some minute-to-minute changes in inhaled dose were related to changes in the PM2.5concentration, but most were
related to changes inV_Ein response to physical activity. The exposure periods were overlap-ping, and the mean PM2.5concentration was 3.9μgm-3during the sprinter’s 105-minute
expo-sure period and 3.4μgm-3during the soccer player’s 90-minute exposure period. The corresponding exposures (concentrationtime) were 413 and 420μgminm-3respectively.
Although the exposures were nearly the same, the sprinter inhaled 4.3 m3of air while the soc-cer player inhaled 3.4 m3, and the corresponding inhaled doses were 16.6μg (0.19μg/kg body
mass) and 12.3μg (0.22μg/kg body mass) respectively. These subjects were very active during
this period with both HR and fBat times approaching their maximum values; however, if the
Fig 1. Five-fold cross validation results for the modelV :
E/FVC = -3.859 + 0.101HR.The mean percent error for this model is 11.3±36%.
subjects had remained at rest during the exposure period with baselineV_E, their inhaled dose of PM2.5would have been 5.0 and 4.8μg respectively, or about a third of the dose during
activ-ity. There were only slight differences in dose estimates using model 1 (with HR as the only predictor). The model 1 inhaled dose estimate was found to be 0.6% lower for the sprinter and 2.4% higher for the soccer player.
Limitations
This study involved a panel of healthy adolescents, and therefore our results may not be gener-alizable at the population level. Although age was not found to be an important predictor of
_
VE/FVC, this may be due to the narrow age range of study participants, none of whom had yet reached adulthood. Given that FVC steadily declines with age once adulthood is reached, it is possible thatV_E/FVC may also be affected by age in adults. Similarly, these results may not be Fig 2. Five-fold cross validation results for the modelV
:
applicable to pre-adolescent children. Although three subjects reported a history of asthma, none were currently experiencing symptoms, and no subjects had obstructive airway disease. In an exploratory analysis, we excluded the three subjects with a history of asthma, and the result was not significantly different than excluding at random three subjects without a history of asthma. Consequently, our results do not offer any insight into the role of airway disease onV_E/FVC.
Conclusion
We describe a novel method to estimateV_Efor healthy adolescents using only measurements of HR and fB. Since individuals of various sizes andfitness levels have widely varying lung
capacities, the key feature of this method is to normalizeV_Eby FVC. It is preferable to have accurate and recent spirometric measurements of FVC, but in their absence, we found little
Fig 3. Five-fold cross validation results for the modelV :
E/(predicted FVC) = -4.148 + 0.0535HR + 0.221fB, where predicted FVC is calculated using
NHANES III coefficients.The mean percent error for this model is 6.0±28%.
difference in model predictions when using FVC predicted using NHANES III coefficients for healthy subjects with normal lung function. Afive-fold cross-validation procedure found a mean percent error of 8.1% for a two-predictor model including HR and fBand 11.3% for a
model using HR as the sole predictor. Although additional work is needed to refine these esti-mates and examine these associations in other populations, the method described here is a sub-stantial improvement over existing methods for estimatingV_Ein natural settings. When coupled with time-resolved air pollution measurements, this method allows estimation of the inhaled dose of air pollution and may be particularly useful in estimating changes in inhaled dose resulting from physical activity.
Supporting Information
S1 File. The dataset of 30-second averaged data is included in an online supplement. (ZIP)
Author Contributions
Conceived and designed the experiments: RG. Performed the experiments: AL RG. Analyzed the data: RG MH JB. Wrote the paper: RG.
Fig 4. Time-resolved inhaled does of PM2.5for a sprinter (black line) and a soccer player (gray line) during after-school practice.The cumulative inhaled dose was 16.6μg for the sprinter, and 12.3μg for the soccer player.
References
1. Brook RD (2008) Cardiovascular effects of air pollution. Clinical Science 115: 175–187. doi:10.1042/ CS20070444PMID:18691154
2. Curtis L, Rea W, Smith-Willis P, Fenyves E, Pan Y (2006) Adverse health effects of outdoor air pollut-ants. Environment International 32: 815–830. PMID:16730796
3. Dockery DW (2001) Epidemiologic evidence of cardiovascular effects of particulate air pollution. Envi-ronmental Health Perspectives 109: 483–486. PMID:11544151
4. Dockery DW, Pope CA, Xu X, Spengler JD, Ware JH, et al. (1993) An association between air pollution and mortality in six U.S. cities. New England Journal of Medicine 329: 1753–1759. PMID:8179653
5. Peters A, Dockery DW, Muller JE, Mittleman MA (2001) Increased particulate air pollution and the trig-gering of myocardial infarction. Circulation 103: 2810–2815. PMID:11401937
6. Mirowsky J, Gordon T (2015) Noninvasive effects measurements for air pollution human studies: meth-ods, analysis, and implications. Journal of Exposure Science and Environmental Epidemiology 25: 354–380. doi:10.1038/jes.2014.93PMID:25605444
7. Haslam DW, James WPT (2005) Obesity. The Lancet 366: 1197–1209.
8. Nayor M, Vasan RS (2015) Preventing heart failure: the role of physical activity. Current Opinion in Car-diology 30.
9. Stewart RAH, Benatar J, Maddison R (2015) Living longer by sitting less and moving more. Current Opinion in Cardiology 30.
10. Teychenne M, Costigan SA, Parker K (2015) The association between sedentary behaviour and risk of anxiety: a systematic review. BMC Public Health 15: 513. doi:10.1186/s12889-015-1843-xPMID:
26088005
11. Liu M, Wu L, Ming Q (2015) How does physical activity intervention improve self-esteem and self-con-cept in children and adolescents? Evidence from a meta-analysis. PLoS ONE 10: e0134804. doi:10. 1371/journal.pone.0134804PMID:26241879
12. Hupin D, Roche F, Gremeaux V, Chatard J-C, Oriol M, Gaspoz J-M, et al. (2015) Even a low-dose of moderate-to-vigorous physical activity reduces mortality by 22% in adults aged60 years: a system-atic review and meta-analysis. British Journal of Sports Medicine epub.
13. Samet JM, Lambert WE, James DS, Mermier CM, Chick TW (1993) Assessment of heart rate as a pre-dictor of ventilation. Health Effects Institute. 59 59.
14. Mermier CM, Samet JM, Lambert WE, Chick TW (1993) Evaluation of the relationship between heart rate and ventilation for epidemiologic studies. Archives of Environmental Health 48: 263–269. PMID:
8357278
15. Zuurbier M, Hoek G, van den Hazel P, Brunekreef B (2009) Minute ventilation of cyclists, car and bus passengers: an experimental study. Environmental Health 8: 1–10.
16. Bernmark E, Wiktorin C, Svartengren M, Lewné M,Åberg S (2006) Bicycle messengers: energy expen-diture and exposure to air pollution. Ergonomics 49: 1486–1495. PMID:17050389
17. van Wijnen JH, Verhoeff AP, Jans HWA, van Bruggen M (1995) The exposure of cyclists, car drivers and pedestrians to traffic-related air pollutants. International Archives of Occupational and Environmen-tal Health 67: 187–193. PMID:7591177
18. Beals JA, Funk LM, Fountain R, Sedman R (1996) Quantifying the distribution of inhalation exposure in human populations: distribution of minute volumes in adults and children. Environmental Health Per-spectives 104: 974–979. PMID:8899377
19. Ramos CA, Reis JF, Almeida T, Alves F, Wolterbeek HT, Almeida SM. (2015) Estimating the inhaled dose of pollutants during indoor physical activity. Science of The Total Environment 527–528: 111–
118. doi:10.1016/j.scitotenv.2015.04.120PMID:25958360
20. Cozza IC, Zanetta DMT, Fernandes FLA, da Rocha FMM, de Andre PA, Bueno Garcia ML. (2015) An approach to using heart rate monitoring to estimate the ventilation and load of air pollution exposure. Science of The Total Environment 520: 160–167. doi:10.1016/j.scitotenv.2015.03.049PMID:
25813969
21. Faria M, Duarte G, Vasconcelos A, Farias T (2014) Evaluation of a numerical methodology to estimate pedestrians’energy consumption and PM inhalation. Transportation Research Procedia 3: 780–789.
22. Diggle PJ, Heagerty P, Liang K-Y, Zeger SL (2002) Analysis of Longitudinal Data. Oxford: Oxford Uni-versity Press. 400 p.
24. Babb TG (2013) Exercise ventilatory limitation: the role of expiratory flow limitation. Exercise and Sport Sciences Reviews 41: 11–18. doi:10.1097/JES.0b013e318267c0d2PMID:23038244
25. Morton AR (1999) Exercise Physiology. In: Taussig LM, Landau LI, Le Souëf PN, Morgan WJ, Martinez FD et al., editors. Pediatric Respiratory Medicine. St. Louis: Mosby, Inc. pp. 111–121.
26. MacAuley D, McCrum E, Evans A, Stott G, Boreham C, Trinick T. (1999) Physical activity, physical fit-ness and respiratory function—Exercise and respiratory function. Irish Journal of Medical Science 168: 119–123. PMID:10422393
27. Jakes RW, Day NE, Patel B, Khaw K- T, Oakes S, Luben R, et al. (2002) Physical inactivity is associ-ated with lower forced expiratory volume in 1 second: European prospective investigation into Cancer-Norfolk Prospective Population study. American Journal of Epidemiology 156: 139–147. PMID:
12117705