1031
IMPROVED VIBRATION CHARACTERISTICS OF FLEXIBLE POLYURETHANE FOAM VIA COMPOSITE FORMATION
Chan Wen Shan1, Mohd Imran Ghazali1 and Maizlinda Izwana Idris2
1
Department of Engineering Mechanics
Faculty of Mechanical and Manufacturing Engineering Universiti Tun Hussein Onn Malaysia (UTHM)
86400 Parit Raja, Batu Pahat, Johor, Malaysia Email: [email protected]
2
Department of Materials and Design Engineering Faculty of Mechanical and Manufacturing Engineering
Universiti Tun Hussein Onn Malaysia (UTHM) 86400 Parit Raja, Batu Pahat, Johor, Malaysia
ABSTRACT
Flexible polyurethane (PU) foam is used as cushioning material in automotive seating for load bearing. Owing to the demand for more comfortable compartments, seat cushions are now designed for better ride comfort, which is linked to the damping of seating foam. In this paper, PU polymer was mixed with short treated coir fibers (F) and recycled tires (P) to enhance damping and improve the vibrational characteristics of seating foam. Five samples with 2.5wt% filler loading were developed. The vibration characteristics of foam composites were examined by transmissibility tests generated at 1 and 1.5 mm peak amplitude in the frequency range of 2–20 Hz, using a shaker, shaking table, and a foam-block system. The foam-block system was fabricated by simulating the seat/occupant system in an automobile. The damping properties of foam composites were calculated from the transmissibility data obtained. The results showed that more vibration was dissipated by the developed foam composites after the fillers were added. System inserts with PU+2.5wt%P gave the lowest resonance peak: 2.460 and 2.695 at 1 and 1.5 mm base excitation, respectively, compared with 2.788 and 2.878 obtained from system inserts of pure PU foam. This is because a higher damping ratio (ξ foam) was found in PU+2.5wt%P, which is 36.47% and 19.23% higher than pure PU foam. In addition, other composites, such as PU+2.5wt%F, PU+2.5wt% (50F50P), PU+2.5wt% (80P20F), and 2.5wt% (80F20P) also showed favorable vibration and damping characteristics in the experiments. When compared with the conventional seat cushions used in the Proton car, foam composites could offer better vibration dampening at resonance.
Keywords: Vibration characteristic; flexible polyurethane foam; composite; coir fibers;
recycled tires; damping; cushioning material.
INTRODUCTION
1032
2011). Through proper choice of raw materials, additives and manufacturing technology, the properties of flexible PU foam can be changed to satisfy the desired application. Flexible PU foam is used commonly in automotive seating for load bearing. However, in recent years, users demand a more comfortable compartment experience; thus, seat cushions are now designed for better ride comfort, sound absorption, and longer service life (Broos et al., 2000). With respect to the improvement of ride comfort, the focus is on improving the vibration characteristics of PU foam in the application (Broos et al., 2000; Bachtiar et al., 2010; Bhaskar and Sharief, 2012; Koshute et al., 2001; Murakami et al., 2001).
Damping plays an important role for kinetic energy absorption. It helps convert vibration energy to other forms, such as heat, via the dissipative mechanism of the composite (Chandra et al., 1999; Balachandran and Magrab, 2004; Ibrahim et al., 2012). For seat cushions, superior damping is required to (i) isolate the vibration from the seating base (floorboard) to passenger at low frequency, and (ii) attenuate high-frequency vibration to the passenger from the running engine, irregular road surface, and other sources (Broos et al., 2000). Human sensitivity to vibration is greatest in the frequency range of 2–20 Hz (Broos et al., 2000; Koshute et al., 2001; Murakami et al., 2001). Adding coconut coir fibers or rubber particles to pure polymer have been proven to enhance the damping performance of the polymer (Geethamma et al., 2005; Sankar et al., 2010). The presence of waste rubber particles in the foam could develop a cellular-structure, which is beneficial to damping performance (Xin et al., 2010). Hence, it is desirable to incorporate coir fibers and rubber particles into flexible PU foam for seating foam production, because higher damping capability is offered when the composite is formed.
The idea of mixing natural fibers or waste rubber with flexible PU foam has been presented previously by McClellan & Viejo (1995) and Clausi & Diloreto (2005) in US patents, but no related research has been performed on the combination of natural fibers and waste rubber added to flexible PU foam for improvement of its intrinsic properties. The previous inventions do not investigate the vibration properties of foam materials (Sankar et al., 2010; Xin et al., 2010). Therefore, the purpose of this work is to determine the vibration characteristics of developed foam composites, when is simulating an automotive seat/occupant system by the foam-block system. The effects of foam composites on the vibrational characteristics of the system will be discussed and analyzed. The vibration damping offered by foam composites was determined to identify the effects of fillers on damping and vibration absorption in foams. The potential of these foam composites as cushioning materials were analyzed by comparing them with seat cushions currently available in the automotive market.
EXPERIMENTAL DETAILS
1033
then dried in an oven at 70 °C for 24 hours. Finally, the treated fibers were chopped into lengths of 0.1–5 mm. There was no surface modification performed on the recycled tires. The foam composites were produced by using a closed mold with core-size 100 × 100 × 60 mm at room temperature. Table 1 shows the formulation of the pure and filler-filled flexible PU foams (percentage by weight, wt %) of the samples.
Table 1. Formulation of pure and filler-filled flexible PU foams (percentage by weight, wt %).
Sample Composites Formation PU Content [wt %]
Fillers [wt %]
A Pure PU (as reference) 100 -
B With treated coir fibers (F)
97.5 2.5
C With tire particles (P) D With 50%F50%P (50F50P) E With 80%F20%P (80F20P) F With 80%P20%F (80P20F)
Note: The blend ratio of PU formation was 100:60:3 (polyol:isocyanate:distilled water).
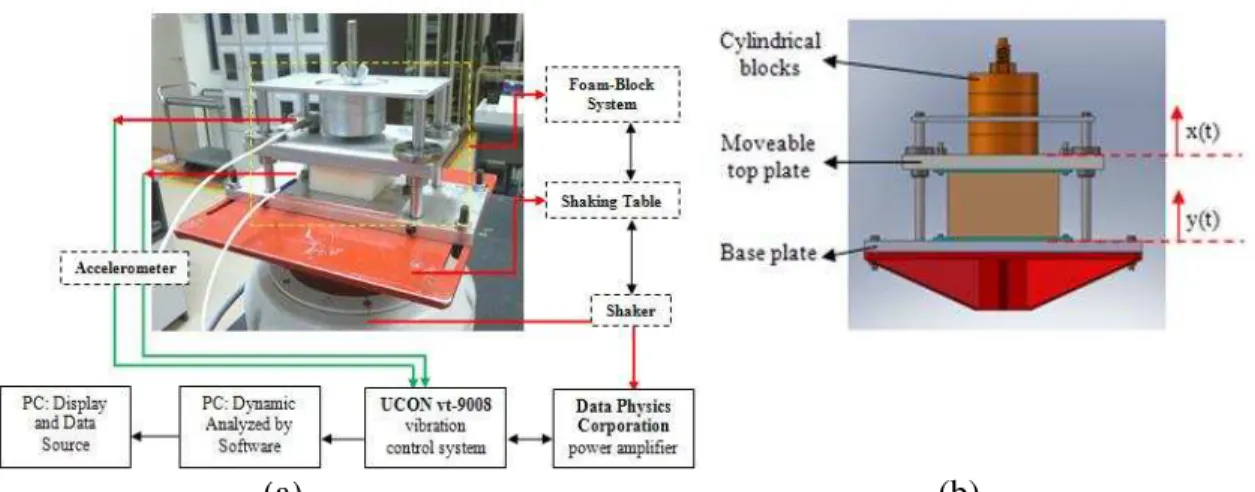
Testing Method. The vibration characteristics of the developed samples were assessed by a transmissibility test (Figure 1(a)). The foam-block system used in this test was designed and developed according to White et al. (2000) for the identification of PU foam properties. As shown in Figure 1(a), the foam cube was placed between the base plate and a moveable block, where the block is guided by four verticle shafts that vibrate in the vertical direction. The foam cube was bolted to the base plate and top block during testing. Low-friction linear bearings were used to guide the block and to minimize the friction between the top plate and guide shaft. The testing rig, which was screwed to the shaking table, was connected to a vibration shaker. Two accelerometers were used to measure the vibration amplitude of the base plate and the response of the blocks to a single frequency excitation. The transmissibility curve between two amplitude signals at the driving frequency was obtained from the data acquisition system and analysis package (VSC software).
(a) (b)
1034
The schematic diagram of the foam-block system is shown in Figure 1(b). Based on this figure, the equation of motion and the transmissibility of the system from the base to the moveable top plate can be defined as Eqs. (1) and (2), where M is the total mass of blocks, x is the amplitude from the top plate, y is the amplitude from the base, z is equal to (x-y), ξ is the total damping in the system, and r is the frequency ratio. It has been reported that flexible foam could be represented by a model with unit nonlinear stiffness (K) and damping (C) owing to its nonlinear and viscoelastic behavior (Wang and Low, 2005). In this work, Eq. (2) was used to calculate the total damping (ξ total)
that occurred in system at resonance.
(1)
Transmissibility = =
√ (2)
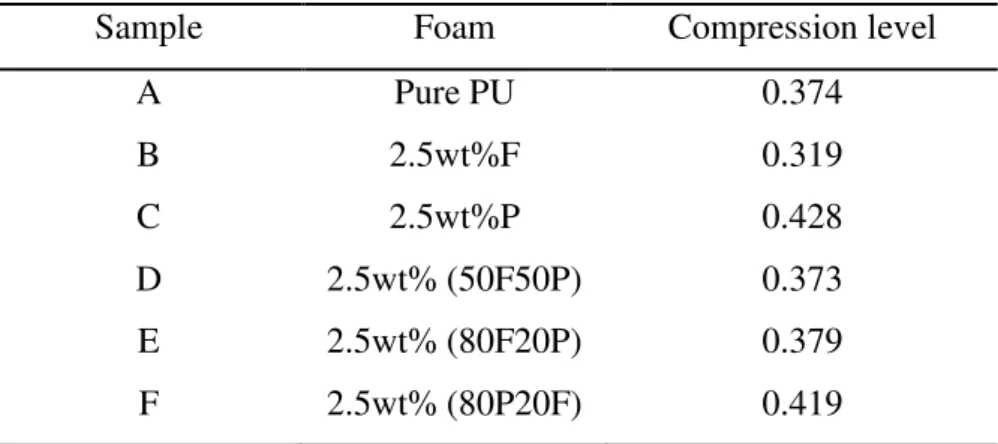
The transmissibility test was generated at 1 and 1.5 mm base excitation in the frequency range 2–20 Hz. This is because the stiffness nonlinearities of foams were assumed having minimal effect on the dynamic response of the system with these low base excitation levels (White et al., 2000). Thus, the system can be assumed working as a linear system. In this work, only two blocks weighing 483.12 g were loaded to the moveable top plate in addition to the foam cube (50 × 50 × 40 mm). The compression levels of samples with two blocks loaded are shown in Table 2. The samples were extracted from the inner layer of the developed molded foams. Three specimens were prepared for each sample and the mean value from the measured data was used to analyze the vibration characteristic of the samples.
Table 2. Compression levels of foams when loaded with two blocks.
Sample Foam Compression level
A Pure PU 0.374
B 2.5wt%F 0.319
C 2.5wt%P 0.428
D 2.5wt% (50F50P) 0.373
E 2.5wt% (80F20P) 0.379
F 2.5wt% (80P20F) 0.419
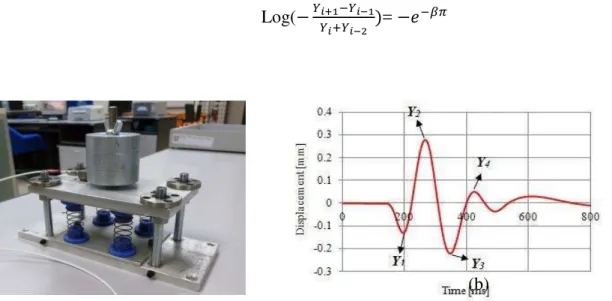
Friction losses (linear bearing) would influence the actual damping of the developed samples were they not taken into account. Hence, a free-vibration test was conducted, as according to Liang and Feeny (1998), in order to determine the frictional losses occurring in the foam-block system. In this test, the foam cube was replaced by a metal spring mechanism (Figure 2(a)). The system was then loaded with two blocks on the moveable top plate, to which a small impulse was given. The resulting decaying oscillation from moveable top plate was measured and analyzed by the DEWESOFT
package (Figure 2(b)). The frictional damping (ξfrictional losses) was calculated using Eq. 3,
1035
/√ (Liang and Feeny, 1998). The result shows that 0.107 frictional damping occurred in this developed foam-block system. It was observed that a similar value (0.12) of frictional damping was measured by Zhang & Dupuis (2010) using the same system and experiment method.
Log(
=
(3)
(a) (b)
Figure 2. (a) Mass-spring dashpot system and (b) oscillation captured from free vibration test.
RESULTS AND DISCUSSION
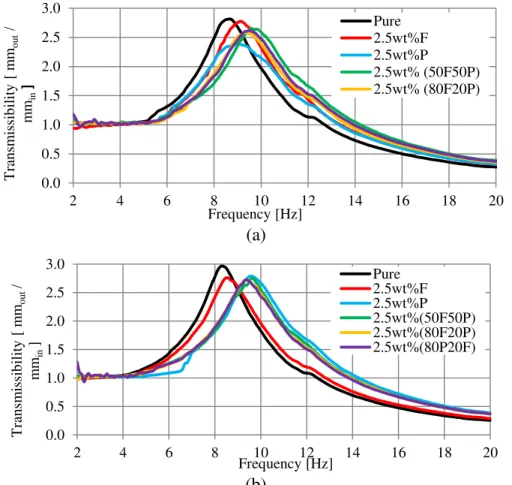
Vibration Transmissibility: Figure 3 shows the transmissibility curves of the foam-block system when base excitations of 1 and 1.5 mm were applied. There was only one resonance peak that occurred over the testing frequency of 2–20 Hz, for all systems.
1036 (a)
(b)
Figure 3. Displacement transmissibility from base to moveable top plate for: (a) 1 mm and (b) 1.5 mm base excitation.
Table 3. Vibrational characteristics of samples for 1 and 1.5 mm base excitation.
Sample Resonance Frequency [Hz]
Resonance Peak Attenuation Frequency [Hz]
Base Excitation 1 mm 1.5 mm 1 mm 1.5 mm 1 mm 1.5 mm
Pure PU 9.100 8.900 2.788 2.878 13.200 12.900
2.5wt%F 9.067 8.800 2.628 2.836 13.067 13.000
2.5wt%P 9.067 9.267 2.460 2.695 13.167 13.500
2.5wt% (50F50P) 9.600 9.333 2.600 2.699 13.833 13.600 2.5wt% (80F20P) 9.467 9.367 2.661 2.747 13.633 13.700 2.5wt% (80P20F) 9.867 9.767 2.693 2.732 14.367 14.233
An increase in the damping of the foam in the seat/occupant system would reduce the transmissibility at resonance, but, it would also broaden the resonance peak; thus, delaying the vibration isolation of the system when compared with those having low damping foam (Broos et al., 2000). The attenuation frequencies obtained in the systems agree with this explanation, where increased damping in the system because of the foam composite inserts, meant that the attenuation frequency was delayed compared with the system with pure PU foam inserts. However, the delay is considered minimal because the maximum variation is less than 2 Hz (Table 3) compared with the systems with pure PU foam inserts. When the base excitation increases from 1 to 1.5 mm, the resonance and attenuation frequency shift to lower values, but the resonance peak
0.0 0.5 1.0 1.5 2.0 2.5 3.0
2 4 6 8 10 12 14 16 18 20
T ran sm is sib ilit y [ m mout / mm in ] Frequency [Hz] Pure 2.5wt%F 2.5wt%P 2.5wt% (50F50P) 2.5wt% (80F20P) 0.0 0.5 1.0 1.5 2.0 2.5 3.0
2 4 6 8 10 12 14 16 18 20
1037
increases, although some fluctuation in the data is observed. This is due to decreases of the damping in the foams when the base excitation increases. A similar observation was reported by White et al. (2000) and Joshi et al. (2010), following examinations of the transmissibility of foam-block systems at 0.1, 0.15, 0.2, and 0.25 g base excitation.
Damping of Foams. During the resonance, the frequency ratio (r) is equal to 1. From
Eq. 2, the total damping ratio (ξtotal) of the foam-block system can be determined using
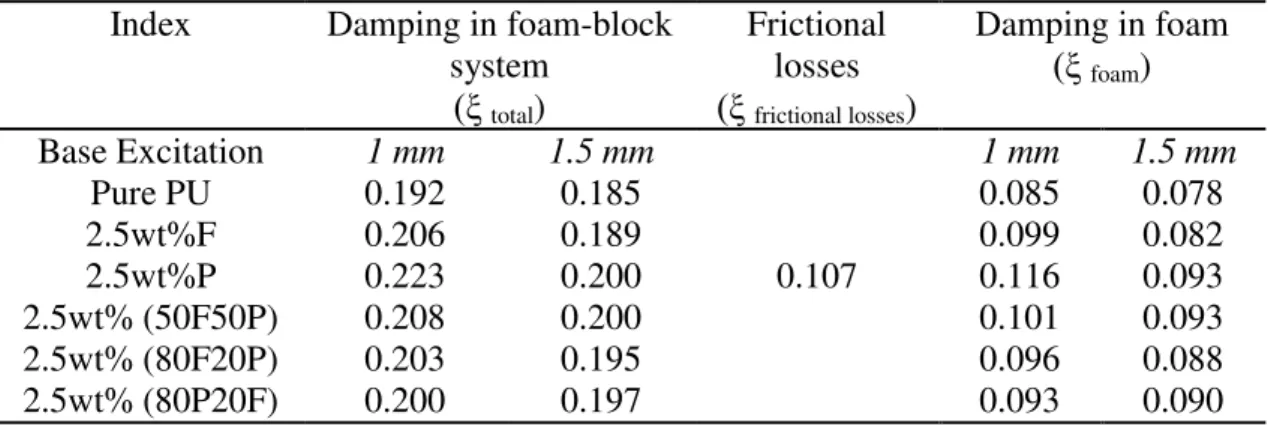
the resonance peak shown in Table 3. Table 4 presents the average damping ratio of the foam-block system (ξtotal) and foam composites (ξfoam). It is assumed that the damping
generated in the system is caused by: (i) frictional losses from bearings during the vertical movement of the top plate, and (ii) the foam cube insert. Hence, the deduction
of ξ frictional losses from ξ total gives the total damping found in the foams. From Table 4, ξtotal is increased in those systems with foam composite inserts. Of them all, PU+2.5wt%P gave excellent ξfoam to absorb vibration at resonance at low frequency for
1 and 1.5 mm base excitation. Damping in PU+2.5wt%P is 36.47% and 19.23% higher than damping in pure PU foam at 1 and 1.5 mm base excitation, respectively. The
results show that all the composites have higher ξfoam when compared with pure PU
foam. In this study, PU+2.5wt%F gave the lowest damping among all the composites developed.
Table 4. Damping of developed foam composites.
Index Damping in foam-block system
(ξ total)
Frictional losses
(ξ frictional losses)
Damping in foam
(ξ foam)
Base Excitation 1 mm 1.5 mm 1 mm 1.5 mm
Pure PU 0.192 0.185
0.107
0.085 0.078
2.5wt%F 0.206 0.189 0.099 0.082
2.5wt%P 0.223 0.200 0.116 0.093
2.5wt% (50F50P) 0.208 0.200 0.101 0.093
2.5wt% (80F20P) 0.203 0.195 0.096 0.088
2.5wt% (80P20F) 0.200 0.197 0.093 0.090
1038
of the the walls increases (Sung et al., 2007). For PU+2.5wt% (80F20P), the vibrational damping effect is caused by its cellular-structure, which comprises smaller cell size and higher cell density (Dai et al., 2005). With this morphology, foam can dissipate the vibration through expelled air (fluid) inside the smaller cells when the moveable top plate vibrates (Gibson and Ashby, 1997). Higher dissipation is generated owing to the resistance of fluid flow by the morphology of the foam. For PU+2.5wt%F, the damping effect is caused by the reinforcing effect of the fibers and the cellular structure formed.
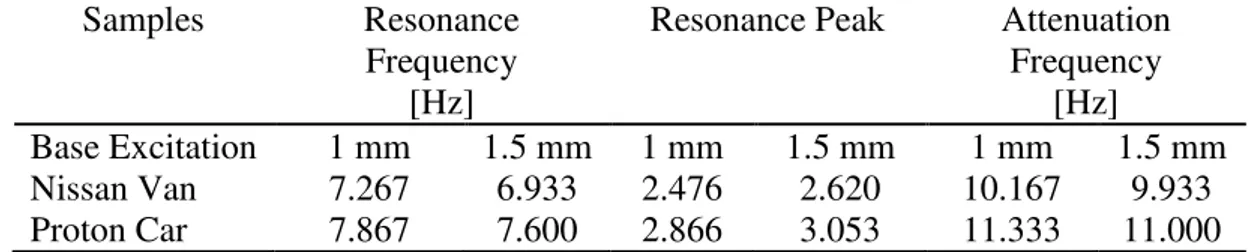
Comparison with Seat Cushions on the Market. Table 5 presents the vibrational characteristics of seat cushions when there are two blocks loaded, and with displacement (1 mm, 1.5 mm) caused by base excitation in the foam-block system. The results show that the seat cushion from Nissan gave the lowest resonance peak compared with foam composites in the testing condition of 1.5 mm base excitation. It is the second lowest in the testing condition of 1 mm base excitation when compared with 2.5wt%P reinforced foams. This indicates that seat cushions from Nissan can provide more damping in absorbing vibration during resonance, because the lower the resonance peak, the lower the vibration transmitted from the base seating to the passenger. However, it was noted that the seat cushion from Nissan has different density compared with the foam composites, which have an average density within 52–54 kg/m3. In this work, the seat cushion from Nissan has average density of 45.5 kg/m3. It is common that the lower the density of foam, the lower the elastic strength, i.e., softer (lower K) foam would be obtained (Broos et al., 2000). In the theoretical case, a lower resonance peak would be observed due to the higher damping that would occur for lower K, as given in the equation: ξ = C/2√ . It was noted that similar observations were obtained in the study of Koshute et al. (2001). In addition, the unknown polymer technologies of seat
cushions also affect its damping property (ξfoam) (Broos et al., 2000; Koshute et al.,
2001; Murakami et al., 2001).
Table 5. Vibrational characteristics of seat cushions for 1 and 1.5 mm base excitation.
Samples Resonance
Frequency [Hz]
Resonance Peak Attenuation Frequency
[Hz]
Base Excitation 1 mm 1.5 mm 1 mm 1.5 mm 1 mm 1.5 mm Nissan Van 7.267 6.933 2.476 2.620 10.167 9.933 Proton Car 7.867 7.600 2.866 3.053 11.333 11.000
Seat cushions from the Proton showed the highest peak value compared with foam composites under the same testing conditions. With similar density (seat cushion from the Proton has density of 54.703 kg/m3), the higher resonance peak may be due to its higher resilience property; thus, a lower damping ratio (ξfoam) is obtained compared
1039
The system with seat cushions with inserts showed lower values at resonance and attenuation frequency. This means that the resonance of the system will be reached earlier, but will not coincide with the sensitive range of humans, which is at 6 Hz when compared with the system with foam composite inserts. It is better to achieve vibration isolation (occurring after resonance at Tr = 1) earlier (< 5 Hz), such that the vibrations transmitted to the passenger are lower than the input from the seating base in actual practical cases (Broos et al., 2000). However, in laboratory tests, the vibrational characteristics of foams are influenced by the type of test plate, type of excitation, and sample thickness used in the testing (Koshute et al., 2001). Hence, the results may vary when testing the fabricated foam composites, based on the standard procedure, developed to evaluate automotive seat cushioning. In this study, the vibrational isolation of the tested foams (including the seat cushions from Nissan and the Proton) are within the frequency range 10–14 Hz, according to the attenuation frequency measured.
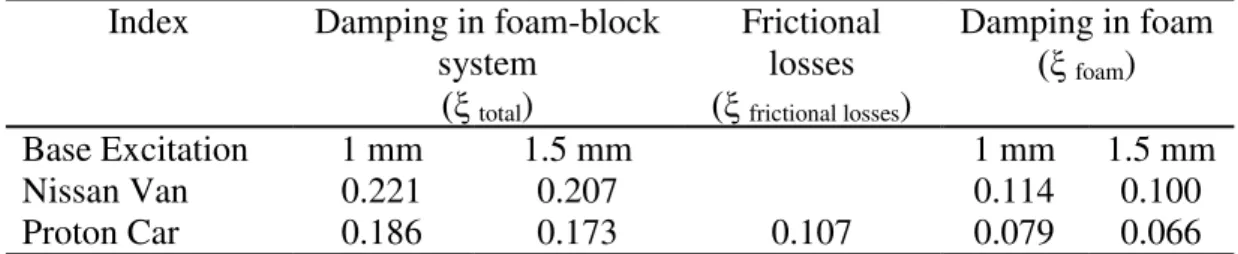
Table 6. Damping of seat cushions
Index Damping in foam-block system
(ξ total)
Frictional losses
(ξ frictional losses)
Damping in foam
(ξ foam)
Base Excitation 1 mm 1.5 mm 1 mm 1.5 mm
Nissan Van 0.221 0.207
0.107
0.114 0.100
Proton Car 0.186 0.173 0.079 0.066
Table 6 shows the average damping obtained in the foam-block system and the seat cushion when there was a 1 or 1.5 mm base excitation. As expected, the seat
cushion from Nissan showed a higher ξfoam at resonance, compared with the seat
cushion from the Proton as well as the foam composites, except for PU+2.5wt%P. Foam
reinforced with 2.5wt%P gave the highest ξfoam among all the systems for 1 mm base
excitation, whereas the seat cushion from Nissan gave the highest at 1.5 mm base excitation. Figure 4 illustrates the comparison of the damping (ξfoam) of foam
composites and automotive seat cushions.
Figure 4. Comparison of damping ratios of foam composites with seat cushions.
As discussed, with similar thickness, the enhancement of the damping ratio in the foam composites is due to the effect of the fillers, the filler-matrix interaction, and
0.000 0.020 0.040 0.060 0.080 0.100 0.120 0.140
Pure 2.5wt% F 2.5wt% P 2.5wt% (50F50P)
2.5wt% (80F20P)
2.5wt% (80P20F)
Nissan Van
Proton Car
Dam
p
in
g
R
atio
(
ξfoam
)
1040
the morphology (cellular-structure) generated. On the other hand, the damping ratios obtained in pure PU foam, as well as the seat cushions, are because of the viscoelastic nature of the PU polymer, the resilience properties, and the lower density found in the seat cushion from Nissan. Within a similar density range, the developed foam composite could be used to replace the conventional seat cushion from the Proton because it achieved the highest damping compared with this cushioning material. This means that these foams could provide better vibration absorption at resonance and at low frequency. The highest value was obtained for PU+2.5wt%P, which is 46.84% and 40.91% higher than the damping obtained in the seat cushions from the Proton, at 1 and 1.5 mm base excitation, respectively. Although the seat cushion from Nissan can achieve higher damping than PU+2.5wt%P because of its low density, the mechanical performance of this cushioning material should be considered in accordance with the static and dynamic comfort of automotive seating. This depends on the requirements of the seating application, such as seating designed for a sports car or a luxury car (Patten et al., 1998).
CONCLUSIONS
The addition of treated coir fibers and recycled tires to flexible PU foam makes these cushioning materials absorb more vibrations at low frequency and in particular, at resonance frequency. This is actually caused by the enhanced vibration damping in the flexible PU foam because of the added fillers, which improves the transmissibility of the base excitation to the top moveable plate. The foams reinforced with 2.5wt%P gave the best vibration absorption (damping) at resonance compared with the other foam composites, pure PU foam, and the seat cushion from the Proton. However, the resonance and attenuation frequency of the system with foam composite inserts would shift to higher values compared with pure PU foam and seat cushions available from the market.
REFERENCES
Adebisi, A.A., Maleque, M.A. and Rahman, M.M. 2011. Metal matrix composite brake rotor: historical development and product life cycle analysis. International Journal of Automotive and Mechanical Engineering, 4: 471-480.
Bachtiar, D., Sapuan, S.M. and Hamdan, M.M. 2010. Flexural properties of alkaline treated sugar palm fibre reinforced epoxy composites. International Journal of Automotive and Mechanical Engineering, 1: 79-90.
Balachandran, B. and Magrab, E.B. 2004. Vibrations. California: Thomson.
Bhaskar, H.B. and Sharief, A. 2012. Effect of solutionizing on dry sliding wear of Al2024-Beryl metal matrix composite. Journal of Mechanical Engineering and Sciences, 3: 281-290.
Broos, R., Sonney, J.M., Thanh, H.P. and Casati, F.M. 2000. Polyurethane foam molding technologies for improving total passenger compartment comfort. Proceedings of the 2000 API Polyurethane Conference, Technomic, Lancaster, pp. 341-353.
Chandra, A., Singh, S.P. and Gupta, K. 1999. Damping studies in fiber-reinforced composites-a review. Composite Structures, 46(1): 41-51.
1041
Dai, X.H., Liu, Z.M., Wang, Y., Yang, G.Y., Xu, J. and Han, B.X. 2005. High damping property of microcellular polymer prepared by friendly environmental approach. The Journal of Supercritical Fluids, 33: 259-267.
Geethamma, V.G., Kalaprasad, G., Groeninckx, G. and Thomas, S. 2005. Dynamic mechanical behaviour of short coir fiber reinforced natural rubber composites. Composites, Part A, 36: 1499-1506.
Gibson, L.J. and Ashby, M.F. 1997. Cellular solids: structure and properties. 2nd. ed., Cambridge: Cambridge University Press.
Ibrahim, M.S., Sapuan, S.M. and Faieza, A.A. 2012. Mechanical and thermal properties of composites from unsaturated polyester filled with oil palm ash. Journal of Mechanical Engineering and Sciences, 2: 133-147.
Inman, D.J. 2001. Engineering vibration. 2nd. ed. New Jersey: Prentice-Hall.
Jeffrey, K.J.T., Tarlochan, F. and Rahman, M.M. 2011. Residual strength of chop strand mats glass fiber/epoxy composite structures: effect of temperature and water absorption. International Journal of Automotive and Mechanical Engineering, 4: 504-519.
Joshi, G., Bajaj, A.K. and Davies, P. 2010. Whole-body vibratory response study using nonlinear multi-body model of seat-occupant system with viscoelastic flexible polyurethane foam. Indian Health, 48(5): 663-674.
Klempner, D. and Sendijarevic, V. 2004. Polymeric foams and foam technology. 2nd ed. Cincinnati: Hanser.
Koshute, M.A., Blaszkiewics, M. and Neal, B.L. 2001. Benchmarking of polyurethane technilogies for automotive seat cushions. Polyurethane Expo 2001, Columbus, pp. 247-254.
Liang, J.W. and Feeny, B.F. 1998. Identifying coulomb and viscous friction from free-vibration decrements. Nonlinear Dynamics, 16(4): 337-347.
McClellan, T.R. and Viejo, M. 1995. U.S. Patent 5,385,953.
Murakami, S., Saiki, K., Hayashi, M., Satou, T. and Fukami, T. 2001. A newly developed mdi-based polyurethane flexible foam for automotive seat cushion having both superior static and dynamic properties. Journal of Cellular Plastics, 37(3): 249-261.
Patten, W.N., Sha, S. and Mo, C. 1998. A vibration model of open polyurethane foam automotive seat cushion. Journal of Sound and Vibration, 217(1): 145-161. Sankar, H.R., Krishna, P.V., Rao, V.B. and Babu, P.B. 2010. The effect of natural
rubber particle inclusions on the mechanical and damping properties of epoxy-filled glass fibre composites. Journal of Materials: Design and Applications, 224(2): 63-70.
Sung, C.H., Lee, K.S., Oh, S.M., Kim, J.H., Kim, M.S. and Jeong, H.M. 2007. Sound damping of a polyurethane foam nanocomposite. Macromolecular Res. 15(5): 443-448.
Ting, L., Liang, M., Fuwei, L., Wuzhou, J., Zhaobo, H. and Pengfei, F. 2011. Preparation, structure, and properties of flexible polyurethane foams filled with fumed silica. Journal of Natural Sciences, 16(1): 29-32.
Umar, A.H., Zainudin, E.S. and Sapuan, S.M. 2012. Effect of accelerated weathering on tensile properties of kenaf reinforced high-density polyethylene composites. Journal of Mechanical Engineering and Sciences, 2: 198-205.
1042
polyurethane foams filled with carbon nanotubes. Composites Science and Technology, 69 : 1564-1569.
Wang, Y. and Low, K.H. 2005. Damped response analysis of nonlinear cushion systems by a linearization method. Computers and Structures, 83(19-20): 1584-1594. White, S.W., Kim, S.K., Bajaj, A.K. and Davies, P. 2000. Experimental techniques and
identification of nonlinear and viscoelastic properties of flexible polyurethane foam. Nonlinear Dynamics, 22(3): 281-313.
Xin, Z.X., Zhang, Z.X., Pal, K., Byeon, J.U., Lee, S.H. and Kim, J.K. 2010. Study of microcellular injection-molded polypropylene/waste ground rubber tire powder blend. Materials and Design, 31: 589-593.