Comparison of human brain metabolite
levels using 1H MRS at 1.5T and 3.0T
Fernando Fernandes Paiva1, Maria Concepcion Garcia Otaduy2,
Ricardo de Oliveira-Souza3, Jorge Moll4, Ivanei Edson Bramati5,
Luciane Oliveira6, Andrea Silveira de Souza7, Fernanda Tovar-Moll7
ABSTRACT. Proton magnetic resonance spectroscopy (MRS) of the human brain has proven to be a useful technique in several neurological and psychiatric disorders and benefits from higher field scanners as signal intensity and spectral resolution are proportional to the magnetic field strength. Objective: To investigate the effects of the magnetic field on the measurement of brain metabolites in a typical routine clinical setting. Methods: Single voxel spectra were acquired from the posterior cingulate cortex in 26 healthy subjects. Each subject was scanned consecutively at 1.5T and 3.0T in a randomly distributed order. Results: SNR and peak width improvements were observed at higher fields. However, SNR improvement was lower than the theoretical two-fold improvement. Other than the values obtained for creatine (Cre) and myo-Inositol (mI), which were both higher at 3.0T, all metabolite concentrations obtained were roughly the same at both field strengths. All the metabolite concentrations were estimated with a Cramer Rao lower bounds (CRLB) lower than 15% of the calculated concentrations. Conclusions: Even though the present study supports the expected benefits of higher field strength for MRS, there are several factors that can lead to different quantitative results when comparing 1.5T to 3.0T MRS. Future comparative studies are necessary to refine the metabolite thresholds for early detection and quantification of distinct neurological and psychiatric disorders using 3.0T MRS.
Key words: brain, magnetic resonance spectroscopy, 1.5T, 3.0T.
COMPARAÇÃO DOS NÍVEIS DE METABÓLITOS CEREBRAIS UTILIZANDO ESPECTROSCOPIA DE PRÓTONS POR RESSONÂNCIA MAGNÉTICA EM 1.5T E 3.0T.
RESUMO. Espectroscopia de prótons por ressonância magnética (MRS) tem se mostrado uma técnica bastante útil em diversas doenças neurológicas e psiquiátricas. A utilização de sistemas de mais alto campo magnético favorece essa técnica uma vez que a intensidade do sinal e a resolução espectral são proporcionais à intensidade do campo. Objetivo: Avaliar o efeito do campo magnético sobre a medida dos níveis dos metabólitos cerebrais em uma típica rotina clínica. Métodos: Os dados foram obtidos em 26 indivíduos saudáveis nos sistemas de 1.5T e 3.0T. As aquisições foram feitas sequencialmente e a ordem foi distribuida randomicamente. Resultados: Foram observadas melhoras na relação sinal-ruído (SNR) e na largura de linha dos picos nos dados obtidos em campo maior. No entanto, a melhoria na SNR foi menor que o esperado teoricamente que seria o dobro da obtida em 1.5T. Exceto pelos valores obtidos para creatina e mio-inositol, que foram maiores em 3.0T, todas as concentrações de metabólitos obtidas foram aproximadamente a mesmo em ambos os campos. Todas as concentrações de metabólitos foram estimadas com Cramer Rao lower bounds (CRLB) inferior a 15% das concentrações calculadas. Conclusões: Apesar de o presente estudo dar suporte aos benefícios gerados pelo aumento do campo para a técnica de MRS, existem fatores que podem levar a diferentes resultados quantitativos quando se compara espectroscopia em 1.5T e 3.0T. Estudos comparativos serão necessários para refinar os limiares dos níveis de metabólitos para melhorar a acurácia da detecção de doenças neurológicas utilizando espectroscopia em 3.0T.
Palavras-chave: cérebro, espectroscopia por ressonância magnética, 1.5T, 3.0T.
1PhD, Magnetic Resonance Imaging and In Vivo Spectroscopy Center (CIERMag), Physics Institute of São Carlos, University of São Paulo, São Carlos SP, Brazil. 2PhD, Magnetic Resonance Department, LIM44, InRad-Hospital das Clínicas, Faculty of Medicine of the University of São Paulo, São Paulo SP, Brazil. 3PhD, Gaffreé
e Guinle University Hospital, University of the State of Rio de Janeiro, Rio de Janeiro RJ, Brazil. D’Or Institute for Research and Education (IDOR), Rio de Janeiro RJ, Brazil. 4PhD, D’Or Institute for Research and Education (IDOR), Rio de Janeiro RJ, Brazil. 5D’Or Institute for Research and Education (IDOR), Rio de Janeiro RJ,
Brazil. 6MD, D’Or Institute for Research and Education (IDOR), Rio de Janeiro RJ, Brazil. 7PhD, D’Or Institute for Research and Education (IDOR), Rio de Janeiro RJ,
Brazil. Biomedical Sciences Institute, Federal University of Rio de Janeiro, Rio de Janeiro RJ, Brazil.
Fernando F. Paiva. Magnetic Resonance Imaging and In Vivo Spectroscopy Center (CIERMag) – Av. Trabalhador São-Carlense, 400 – 13566-590 São Carlos SP – Brazil. E-mail: [email protected]
Disclosure: The authors report no conflicts of interest.
INTRODUCTION
P
roton magnetic resonance spectroscopy (MRS) has proven to be a useful non-invasive technique to ob-tain information regarding the normal and abnormal neurochemistry of the human brain.1,2 In someclini-cal settings, MRS may show early metabolic changes in apparently anatomically-normal tissue.3 MRS beneits
from higher ield scanners because signal intensity and spectral resolution (chemical shift) are theoretically proportional to the strength of the magnetic ield.4,5
An-other consequence is the increased J-coupling splitting. For example, the metabolite myo-Inositol (mI) is repre-sented as a single peak at 3.56 ppm at 1.5T, while at 3.0T it appears to be split mainly into two peaks at 3.56 and 3.64 ppm, making its visual detection and quantiica-tion harder. Moreover, susceptibility efects are stron-ger at higher ield strengths, resulting in larstron-ger peak linewidths. Transverse relaxation times (T2) also tend to decrease at higher ields, resulting in lower metabo-lite signals for a given echo time (TE) when compared to lower ield strengths. hese higher-ield efects may have some clinical implications insofar altered levels of mI are associated with prevalent neurological disorders, such as Alzheimer’s disease.
An accurate clinical interpretation of individual spectra requires the knowledge of the normal range of relative metabolite levels (or absolute concentrations), as well as an understanding of how the measured values depend on diferent aspects, such as patient age, region of interest, metabolic conditions, speciic MRS tech-nique and ield strength. Even though some quantitative studies have been reported at diferent ield strengths,6-9
most comparisons between the widespread 1.5T and 3.0T systems, which are becoming increasingly common in clinical settings, have focused on the evaluation of SNR and spectral resolution at higher ields.10 However,
these studies have not systematically compared the me-tabolite concentrations and ratio estimates across dif-ferent ield strengths. hus, quantitative comparisons between both ield strengths are needed in order to es-tablish reference data at 3.0T as well as to determine if the normal ranges previously established for 1.5T can be directly adopted in any system. In the present study, metabolite levels at 1.5T and 3.0T were assessed in healthy volunteers and the inluence of ield strength on the measured values, and on calculated metabolite ratios used for diagnostic purposes, were evaluated.
METHODS
1H MRS Methods. Healthy adult volunteers (N=26, seven males and nineteen females, mean age 53±22 years)
were scanned under an Institutional Review Board (IRB)-approved protocol on a 3.0T Philips Achieva sys-tem equipped with gradients capable of 80 mT/m ampli-tude and 200 mT/m/ms slew rate and on a 1.5T Philips Gyroscan system equipped with gradients capable of 23 mT/m amplitude and 105 mT/m/ms slew rate (Philips Medical Systems, he Netherlands). All subjects were free of neurological and neuropsychiatric disorders. A standard transmit body coil and an eight-channel receive-only head coil were used for data acquisition in both systems. Each subject was scanned consecutively at 1.5T and 3.0T in a randomly distributed order, such that half of the volunteers were scanned initially on the 1.5T system and the other half on the 3.0T system.
At both ield strengths, single voxel spectroscopy was performed using a point-resolved spectroscopy sequence (PRESS). Before obtaining the spectra, auto-matic shimming and water suppression were conducted by the scanner. At 1.5T, spectra were acquired using the following parameters: TE=31 ms, TR=1500 ms, 512 spectral points and 1 kHz receiver bandwidth. At 3.0T, a TE=31 ms, TR=2000 ms, 2048 spectral points and 2 kHz receiver bandwidth was used. he repetition time was optimized at both ield strengths for optimal signal-to-noise ratio (SNR) for the metabolites of interest. For each spectrum, a total of 128 measurements were av-eraged at 1.5T and 96 measurements at 3.0T resulting in the same acquisition time at both ield strengths. In both cases, a voxel size of 25 x 25 x 25 mm³ positioned using a T1- and a T2-weigthed scout image at the poste-rior cingulate gyrus and aligned according to the parie-to-occipital sulcus was used, as illustrated in Figure 1A.
Data analysis and statistics. All spectroscopic data were processed using LCModel.11 An automatic adjust of
the phase and eddy current correction was applied to all spectra. Relative metabolite concentrations and their uncertainties were estimated by itting the spec-trum to a basis set of spectra acquired from individual metabolites in solution and referencing to the unsup-pressed water peak, and are exunsup-pressed in institutional units. Out of the basis set of spectra, a few metabolites and metabolite combinations were selected for further analysis: N-acetylaspartate and other N-acetyl-contain-ing compounds (NAA), glutamine and glutamate (Glx), creatine and phosphocreatine (Cre), choline-containing compounds (Cho) and myo-Inositol (mI).
obtained at both ield strengths, were tested using a non-parametric analysis (Wilcoxon signed-rank test) performed with SPSS 16 (SPSS Inc., Chicago, IL, USA). All data are expressed as mean and standard deviation and results were considered statistically signiicant when p<0.05.
RESULTS
Figure 1A shows the voxel location used for data acquisi-tion, which is, given chemical shift efects, a represen-tation of the voxel location for the NAA signal. Figure 1B shows typical spectra obtained from a representative volunteer at 1.5T and 3.0T. Results show a better spec-tral resolution and SNR at 3.0T. his can be better visu-alized for instance in the Glx region of the spectra where better resolved peaks at 3.0T are evident compared to 1.5T.
As expected, the averaged calculated SNR at 3.0T (23±6) was signiicantly higher than the calculated val-ue for 1.5T (15±4, p<0.0001). he linewidths were also statistically diferent at the two ield strengths (3.1±0.7 Hz at 1.5T and 5.6±0.9 Hz at 3.0T, p<0.05).
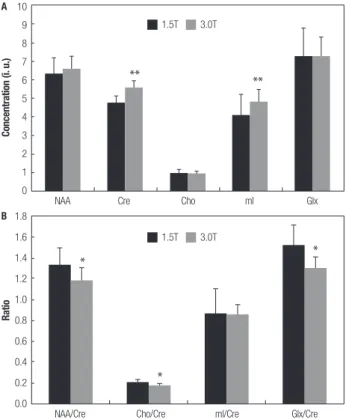
Figure 2A shows the average concentration of the analyzed metabolites. All the metabolite concentra-tions were estimated with a Cramer Rao lower bounds (CRLB) lower than 15% of the calculated concentrations and the mean CRLB values obtained at 3.0T (2.8±0.5%, 2.3±0.5%, 4.4±0.8%, 5.2±0.9%, 9.5±2.0% for NAA, Cre, Cho, mI and Glx, respectively) were statistically lower than their respective values at 1.5T (6.7±1.4%, 7.2±1.9%, 10.3±2.4%, 9.5±2.0%, 14.8±2.9% for NAA, Cre, Cho, mI and Glx, respectively, p<0.001) for all me-tabolites. he mean concentration obtained for NAA (6.3±0.8), Glx (7.2±1.5), and Cho (1.0±0.2) at 1.5T were not statistically diferent from the values obtained at 3.0T (6.6±0.7, 7.3±1.0, 0.9±0.1, respectively). However, the values obtained for Cre and mI at 1.5T (4.8±0.4 and 4.1±1.1, respectively) were both lower than their respec-tive values at 3.0T (5.6±0.3 and 4.8±0.7, respecrespec-tively, p<0.005).
Figure 2B shows the average metabolite ratios for all volunteers. he ratios NAA/Cre, Cho/Cre, and Glx/ Cre were lower at 3.0T (1.19±0.12, 0.17±0.02 and 1.31±0.19, respectively) compared to their equivalent at 1.5T (1.33±0.16, 0.20±0.03 and 1.52±0.29, respectively, p<0.05). On the other hand, the mI/Cre ratio obtained at 1.5T (0.86±0.24) was not statistically diferent to the value found at 3.0T (0.86±0.09).
DISCUSSION
In the current study, brain metabolites detected at 1.5T
Figure 1. [A] Schematic representation of the voxel location used for local-ized MRS data acquisition, which is, due to chemical shift effects, a repre-sentation of the voxel location of the NAA signal. [B] Typical spectra obtained from a representative volunteer at 1.5T and 3.0T showing the common brain metabolites.
A B
Figure 2. [A] Mean concentrations (in institutional units) of the analyzed me-tabolites obtained at 1.5T and 3.0T; and [B] their respective ratios related to Cre signal. Values are represented by mean and standard deviation (N=26, *p<0.05, and **p<0.005).
and 3.0T in the same subject were analyzed. As ex-pected, when compared to the values obtained at 1.5T, spectra obtained at 3.0T had higher SNR. However, the 53% increase found is well below the theoretically
10
9
8
7
6
5
4
3
2
1
0
Concentration (i.
u.)
NAA Cre Cho ml Glx
1.8
1.6
1.4
1.2
1.0
0.8
0.6
0.4
0.2
0.0
Ratio
NAA/Cre Cho/Cre ml/Cre Glx/Cre
B A
1.5T 3.0T
predicted 100% improvement. he theoretical linear in-crease would be expected by assuming constancy of [1] the noise generated by the system, [2] RF penetration efects, [3] T1 and T2 relaxation times, none of which is actually true.12-16 Furthermore, an increase in the
line-widths of the metabolites at 3.0T was found that can partially counteract the SNR improvement associated with higher ield strength. he average value obtained at 1.5T was 3.1 Hz, while at 3.0T the value obtained was 5.6 Hz. his increase is in agreement with previously published data,10 but is slightly less than the two-fold
increase predicted by the theoretical relation of suscep-tibility efects being proportional to ield strength. his might be related to the diferent shimming capabilities of the systems used, since only the 3.0T scanner was equipped with second order shimming.
Except for the values obtained for mI/Cre, all other metabolite ratios were smaller at 3.0T. he lower values for NAA/Cre and Cho/Cre at 3.0T are likely to be due to diferences in transversal relaxation times for T2 at both ield strengths. Spectra were acquired using a TE of 31ms and a TR of 1500/2000ms, which means that they are both T2- and T1-weighted. hus, the signal inten-sities are related not only to metabolite concentration, but also to its relaxation properties. Consequently, me-tabolites with shorter T2 and longer T1 present lower signals, since the present data were not corrected for relaxation efects.
Based on the literature, expected relaxation efects can be estimated. For the cingulate gyrus at 1.5T, a T2 of 351, 336 and 188 ms for Cho, NAA and Cre, respec-tively, was previously reported,17 whereas T2 for gray
matter at 3.0T was signiicantly shorter: 209, 216 and 131 ms for Cho, NAA and Cre, respectively.18 hus,
the shortening ratio of T2 at a higher ield is diferent for each metabolite, which could explain the diferent metabolite ratios obtained at 3.0T compared to 1.5T. Furthermore, absolute metabolite concentrations were obtained by comparing metabolite signal intensity to water signal of an unsuppressed reference scan. Hence, in the evaluation of these absolute values the manner in which T2 and T1 of water changes with increasing ield has to be taken into account. In the literature, there are reports of T2 of water brain tissue of around 107 ms at 1.5T and around 60 ms at 3.0T.19,20 T2 of cerebral
spi-nal luid (CSF) is much longer where values greater than 1s at 1.5T, and around 500 ms at 3.0T, having been re-ported.20,21 hus, the signiicant higher absolute values
for Cre and mI at 3.0T and a trend toward higher val-ues for NAA at 3.0T might be related to a stronger T2 shortening of the water signal at 3.0T as compared to
these metabolites. Changes in T1 can also partially con-tribute to the observed diferences. However, the longer TR employed at 3.0T acquisition should compensate for the efects caused by longer T1 at 3.0T. Also, it has been reported that T1 changes with ield strength increases are less prominent.15,22-25
In the particular case of mI, the analysis is more complicated due to its coupled resonance, around 3.56 ppm. he mI signal arises from six CH groups which generate a complex spectral pattern and are responsible for its intrinsic low SNR in the proton MRS. In addition, its spectra overlaps with a number of other brain metab-olites, including Cho, Glx, glycine (Gly), taurine (Tau), and macromolecules,26 which introduce uncertainty in
the estimation process and increase the within-subject variability.27,28 As the ield strength increases, the higher
spectral resolution allows better separation of the mI resonances. As the relaxation time of the overlapping metabolites changes, the appearance of the mI spectra also changes at diferent ield strengths. hus, an accu-rate estimation of mI concentration requires the quan-tiication of all of its resonances, which should be less challenging at higher ield strengths. Indeed, the CRLB of mI at 3.0T are lower than at 1.5T.
he overall smaller CRLB obtained in the estima-tion of the metabolite concentraestima-tions at 3.0T demon-strate an important advantage of working at a higher magnetic ield. his likely relects the positive efects of the higher SNR and spectral resolution accomplished at higher ields. In addition, there was a trend for smaller variations between subjects in the metabolite quan-tiication at higher ield strength. his is also an inter-esting factor for clinical applications, in which patho-logical thresholds are established on the basis of group analyses.
he present study was performed using systems with equivalent implementation of PRESS pulse se-quence and equivalent head coils. his is an advantage when compared to previous studies10 because accurate
reproducibility of spectroscopic data depends on the eiciency of the pulse sequence used for spatial local-ization. his is especially important when comparing spectroscopic data acquired at diferent ield strengths. In spite of this, small efects caused by diferences in the individual optimization phase of the sequence param-eters, such as water suppression and lip angle calibra-tion, cannot be ruled out.
number of factors that can bias comparisons between ield strengths, further quantitative studies at 3.0T are needed in order to redeine the normal statistical threshold for diferent metabolites and brain locations. Such normative studies will be crucial to improve the
value of MRS as a clinical tool for diagnosis and follow-up of several neurological and psychiatric disorders.
Acknowledgements. his work was supported by the D’Or Institute for Research and Education.
REFERENCES
1. Arnold DL, De Stefano N. Magnetic resonance spectroscopy in vivo: applications in neurological disorders. Ital J Neurol Sci 1997;18: 321-329.
2. Castillo M, Kwock L, Mukherji SK. Clinical applications of proton MR spectroscopy. AJNR Am J Neuroradiol 1996;17:1-15.
3. Inglese M, Liu S, Babb JS, Mannon LJ, Grossman RI, Gonen O. Three-dimensional proton spectroscopy of deep gray matter nuclei in relaps-ing-remitting MS. Neurology 2004;63:170-172.
4. Gruetter R, Weisdorf SA, Rajanayagan V, et al. Resolution improve-ments in in vivo 1H NMR spectra with increased magnetic field strength. J Magn Reson 1998;135:260-264.
5. Hetherington HP, Pan JW, Chu WJ, Mason GF, Newcomer BR. Biologi-cal and cliniBiologi-cal MRS at ultra-high field. NMR Biomed 1997;10:360-371. 6. Sauter R, Loeffler W, Bruhn H, Frahm J. The human brain: localized H-1
MR spectroscopy at 1.0 T. Radiology 1990;176:221-224.
7. Frahm J, Bruhn H, Gyngell ML, Merboldt KD, Hanicke W, Sauter R. Localized high-resolution proton NMR spectroscopy using stimulated echoes: initial applications to human brain in vivo. Magn Reson Med 1989; 9:79-93.
8. Michaelis T, Merboldt KD, Bruhn H, Hanicke W, Frahm J. Absolute con-centrations of metabolites in the adult human brain in vivo: quantifica-tion of localized proton MR spectra. Radiology 1993;187:219-227. 9. Gruetter R, Garwood M, Ugurbil K, Seaquist ER. Observation of
re-solved glucose signals in 1H NMR spectra of the human brain at 4 Tesla. Magn Reson Med 1996;36:1-6.
10. Barker PB, Hearshen DO, Boska MD. Single-voxel proton MRS of the human brain at 1.5T and 3.0T. Magn Reson Med 2001;45:765-769. 11. Provencher SW. Estimation of metabolite concentrations from localized
in vivo proton NMR spectra. Magn Reson Med 1993;30:672-679. 12. Manton DJ, Lowry M, Blackband SJ, Horsman A. Determination of
proton metabolite concentrations and relaxation parameters in normal human brain and intracranial tumours. NMR Biomed 1995;8:104-112. 13. Barker PB, Soher BJ, Blackband SJ, Chatham JC, Mathews VP,
Bry-an RN. QuBry-antitation of proton NMR spectra of the humBry-an brain us-ing tissue water as an internal concentration reference. NMR Biomed 1993;6:89-94.
14. Hennig J, Pfister H, Ernst T, Ott D. Direct absolute quantification of me-tabolites in the human brain with in vivo localized proton spectroscopy. NMR Biomed 1992;5:193-199.
15. Mlynarik V, Gruber S, Moser E. Proton T (1) and T (2) relaxation times of human brain metabolites at 3 Tesla. NMR Biomed 2001;14:325-331.
16. Choi CG, Frahm J. Localized proton MRS of the human hippocam-pus: metabolite concentrations and relaxation times. Magn Reson Med 1999;41: 204-207.
17. Malucelli E, Manners DN, Testa C, et al. Pitfalls and advantages of dif-ferent strategies for the absolute quantification of N-acetyl aspartate, creatine and choline in white and grey matter by 1H-MRS. NMR Biomed 2009; 22:1003-1013.
18. Zaaraoui W, Fleysher L, Fleysher R, Liu S, Soher BJ, Gonen O. Human brain-structure resolved T(2) relaxation times of proton metabolites at 3 Tesla. Magn Reson Med 2007;57:983-989.
19. Gasparovic C, Neeb H, Feis DL, et al. Quantitative spectroscopic imag-ing with in situ measurements of tissue water T1, T2, and density. Magn Reson Med 2009;62:583-590.
20. Piechnik SK, Evans J, Bary LH, Wise RG, Jezzard P. Functional chang-es in CSF volume chang-estimated using measurement of water T2 relaxation. Magn Reson Med 2009;61:579-586.
21. Cheng KH. In vivo tissue characterization of human brain by chisquares parameter maps: multiparameter proton T2-relaxation analysis. Magn Reson Imaging 1994;12:1099-1109.
22. Traber F, Block W, Lamerichs R, Gieseke J, Schild HH. 1H metabo-lite relaxation times at 3.0 tesla: Measurements of T1 and T2 values in normal brain and determination of regional differences in transverse relaxation. J Magn Reson Imaging 2004;19:537-545.
23. Hetherington HP, Mason GF, Pan JW, et al. Evaluation of cerebral gray and white matter metabolite differences by spectroscopic imaging at 4.1T. Magn Reson Med 1994;32:565-571.
24. Frahm J, Bruhn H, Gyngell ML, Merboldt KD, Hanicke W, Sauter R. Localized proton NMR spectroscopy in different regions of the human brain in vivo. Relaxation times and concentrations of cerebral metabo-lites. Magn Reson Med 1989;11:47-63.
25. Posse S, Cuenod CA, Risinger R, Le Bihan D, Balaban RS. Anomalous transverse relaxation in 1H spectroscopy in human brain at 4 Tesla. Magn Reson Med 1995;33:246-252.
26. Govindaraju V, Young K, Maudsley AA. Proton NMR chemical shifts and coupling constants for brain metabolites. NMR Biomed 2000;13:129-153.
27. Brooks WM, Friedman SD, Stidley CA. Reproducibility of 1H-MRS in vivo. Magn Reson Med 1999;41:193-197.