www.biogeosciences.net/11/2169/2014/ doi:10.5194/bg-11-2169-2014
© Author(s) 2014. CC Attribution 3.0 License.
Biogeosciences
Technical Note: An X-ray absorption method for the identification
of calcium phosphate species using peak-height ratios
J. F. Oxmann
Helmholtz Centre for Ocean Research Kiel, Marine Biogeochemistry, Kiel, Germany Correspondence to:J. F. Oxmann ([email protected])
Received: 13 November 2013 – Published in Biogeosciences Discuss.: 28 November 2013 Revised: 24 February 2014 – Accepted: 5 March 2014 – Published: 17 April 2014
Abstract. X-ray absorption near edge structure (XANES) studies on calcium phosphate species (Ca-P) deal with marginal differences among subtle spectral features despite a hitherto missing systematic breakdown of these differ-ences. Related fingerprinting approaches depend, therefore, on spectral libraries that are not validated against each other, incomplete and scattered among publications. This study compiled a comprehensive spectral library from published reference compound libraries in order to establish more clear-cut criteria for Ca-P determination by distinctive phos-phorus K-edge XANES features. A specifically developed normalization method identified diagnostic spectral features in the compiled library, e.g. by uniform calculation of ra-tios between white-line and secondary peak heights. Post-processing of the spectra (n=81) verified distinguishability among most but not all phases, which included hydroxylap-atite (HAP), poorly crystalline HAP, amorphous HAP, fluora-patite, carbonate fluorapatite (CFAP), carbonate hydroxylap-atite,β-tricalcium phosphate, octacalcium phosphate (OCP), brushite, monetite, monocalcium phosphate, amorphous cal-cium phosphate (ACP), anapaite, herderite, scholzite, mes-selite, whiteite and P on CaCO3. Particularly, peak-height ra-tios significantly improved analyte specificity, e.g. by supple-mentary breakdown into OCP and ACP. The spectral analy-sis also revealed Ca-P standards that were rarely investigated or inappropriately synthesized, and thus provides a basis for standard selection and synthesis. The method developed and resulting breakdown by species were subsequently tested on Ca-P spectra from studies on bone and sediment. The test in-dicated that bone material likely comprises only poorly crys-talline apatite, which confirms direct nucleation of apatite in bone. This biological apatite formation is likely opposed to that of sedimentary apatite, which apparently forms by both
direct nucleation and successive crystallization. Application of the method to µXANES spectra of sediment particles in-dicated authigenic apatite formation by an OCP precursor.
1 Introduction
Calcium phosphates (Ca-P) are a group of several min-eral species that are present in various biological and en-vironmental matrices, such as soil, sediment, ores, fertiliz-ers, agroindustrial by-products, milk, bone and tooth enamel. However, speciation techniques are not yet fully capable of unequivocally identifying certain key species due to sensitiv-ity and specificsensitiv-ity issues and the complexsensitiv-ity of biological or environmental samples. Moreover, some Ca-P species form naturally occurring polymorphs, which further increases the number of target phases. An important example for this polymorphism is apatite that may occur in amorphous (e.g. bone apatite), cryptocrystalline (e.g. collophane) or crys-talline (e.g. igneous apatite) forms.
for biotic and abiotic P-transformation mechanisms (Giguet-Covex et al., 2013).
Species of the apatite group may nucleate directly or form by transformation of previously precipitated metastable precursors (successive crystallization), such as octacalcium phosphate (OCP), amorphous calcium phosphate (ACP), brushite (DCPD; dibasic calcium phosphate dihydrate) and
β-tricalcium phosphate (ß-TCP). Natural transformations among these P compounds are generally driven by both modynamic and kinetic factors. In simplified terms, ther-modynamically less stable but rapidly precipitating Ca-P species may allow for successive crystallization pathways until the thermodynamically favoured but kinetically slow end-member formation occurs. Direct nucleation of apatite or transformation of precursors to apatite can also be inhib-ited or slowed, for example by Mg2+ions in biological ma-trices and marine environments (Ban et al., 1993; Golubev et al., 1999; Gunnars et al., 2004; Martens and Harriss, 1970). The initial phase during apatite formation, including possible effects of precursors, has been primarily investigated with re-gard to bone apatite and marine CFAP-bearing phosphorite deposits but this subject still remains controversial (e.g. At-las and Pytkowicz, 1977; Baturin, 1981; Bentor, 1980; Rey et al., 2009; Sheldon, 1981). This has been due largely to the above-mentioned difficulties in identifying Ca-P within cor-responding sample matrices down to species level. A brief description of the two major techniques for Ca-P determina-tion in such matrices follows.
The conventional way to quantify the complete fraction of matrix-enclosed Ca-P is to perform sequential chemical extraction methods. Initial procedures were developed for soil, then adapted for sediment and more recently also em-ployed for other matrices, such as agroindustrial by-products (e.g. Kruse et al., 2010). Advancements also facilitated sep-arate quantification of FAP, CFAP, OCP and biogenic apatite (Oxmann and Schwendenmann, 2014; Ruttenberg, 1992; Schenau and De Lange, 2000). A major advantage of these procedures is their high sensitivity, which allows quantifica-tions even in extremely P-poor environmental samples. How-ever, the analyte specificity is limited and requires thorough verification because chemical extracts just provide opera-tionally defined quantities.
In recent years, these extraction methods were applied together with X-ray absorption near edge structure spec-troscopy (XANES) at the P K-edge (Beauchemin et al., 2003; Kruse and Leinweber, 2008; Kruse et al., 2010; Seiter et al., 2008; Shober et al., 2006; Toor et al., 2005). The relatively novel P K-edge XANES technique makes use of X-ray ab-sorption by P atoms of a sample (for an introduction to the fundamental theory see, e.g., Newville, 2004). In brief, core shell electrons of these P atoms can be ejected from their quantum level thereby leaving core holes behind if their bind-ing energies are lower than energies of incident X-rays. If
ing P atoms are in a so-called excited state. Next, the excited state may decay by a higher shell electron dropping into the core hole, which is accompanied by measurable emission of a fluorescence photon or measurable emission of another elec-tron (termed Auger elecelec-tron) into the continuum. Spectra ob-tained by these two emissions indicate the fluorescence yield (FY) or total electron yield (TEY) as a function of energy. In summary, the measured fluorescence intensity or electron yield is proportional to the absorption probability and a drop from an L-shell into a deeper K-shell by a prior absorption event causes measurable emissions at the absorption edge of the K-shell (Newville, 2004). This specific absorption edge is termed K-edge and corresponding XANES measurements provide spectra of the energy region near the K-edge. Equiv-alent analyses of environmental samples at the P L-edge or at extended regions of the K-edge (extended X-ray absorption fine-structure spectroscopy) currently have a limited applica-tion range due to their comparatively low sensitivity (Toor et al., 2006).
As the X-ray absorption probability depends on the chem-ical and physchem-ical state of an atom and its surroundings, XANES generally provides the capability to distinguish among crystalline Ca-P species. Moreover, XANES requires minimal sample preparation and is apparently not or only minimally affected by common sample matrices. Unlike most other structural probes it is also capable of provid-ing analysable signals of amorphous compounds (Newville, 2004). However, quantification of matrix-enclosed Ca-P species by XANES is currently restricted because quantita-tive XANES probes all P atoms within a sample. Hence, dif-ferent species contribute to the measured spectrum, which is problematic because their spectral features overlap (Doolette and Smernik, 2011). Despite approaches to tackling this is-sue by least-squares linear combination fitting or principal component analysis with target transformation (Ajiboye et al., 2007b; Beauchemin et al., 2003, and references therein), it has been therefore recommended to use XANES together with sequential extraction methods (Ajiboye et al., 2007a, 2008; Kruse and Leinweber, 2008). Fortunately, inevitable merging of spectra by bulk XANES analysis can be over-come by resolving particular species within individual ma-trix particles using a focused beam at sub-micron spatial resolution (µXANES; e.g. Brandes et al., 2007). Although µXANES is not quantitative, it provides a more straight-forward approach to ensuring that apparent compositions of bulk XANES analyses represent actual compositions.
degree of conformity between the species of a sample and reference species as well as on measurement reproducibility (e.g. Giguet-Covex et al., 2013). Due to variability among XANES measurements, for instance by differing energy cal-ibrations, self-absorption and particle size effects, P XANES fingerprinting approaches include their own spectral libraries of apparently best suited reference species. Because of time-consuming acquisition and synthesis of reliable reference compounds and specifically due to the temporary use of syn-chrotron facilities, these libraries usually encompass project-oriented and, consequently, incomplete subsets of spectra. Further, verification of synthesized reference compounds is difficult because these libraries are not systematically vali-dated against each other. Finally, spectra of different Ca-P species show just marginal differences among subtle spectral features and the compatibility of two spectra is often deduced from apparent conformities among those subtle features. Due to the lack of a systematic spectral comparison, clear-cut cri-teria for the identification of Ca-P species are not available to date.
Hence, the study objectives were (i) to establish a spec-tral library that encompasses a compiled suite of P K-edge XANES spectra of various Ca-P species published in the lit-erature; and (ii) to conduct a systematic comparison of spec-tra included in this library in order to identify diagnostic spectral features. An insightful comparison was achieved by a specifically developed normalization method that identified subtle but distinctive spectral disparities for the differentia-tion of calcium phosphate species.
2 Methods
2.1 Collection of P K-edge XANES spectra
Phosphorus K-edge XANES spectra of Ca-P reference com-pounds were collected from literature resources that included corresponding spectral libraries (Table 1; 17 libraries). The majority of these libraries (n=13) were drawn from a com-prehensive compilation of XANES studies published in a re-view of spectroscopic approaches for P speciation in environ-mental matrices (Kizewski et al., 2011) and were assumed to be representative of common measurement variations. Li-braries of these studies were selected if they comprised more than one species for Ca-P and sufficient energy ranges from white-line peaks to oxygen oscillations. One exception was the study of Beauchemin et al. (2003), whose library did not include oxygen oscillations, yet contained a valuable set of reference compounds. As the method developed gener-ally required spectral coverage of oxygen oscillations (see Sect. 2.2), spectra of Beauchemin et al. (2003) were con-sequently processed by an additional alignment with other spectra. Potential duplicates were excluded, such as spec-tra of Lombi at al. (2006). Their study comprised person-ally supplied spectra of researchers, who collected spectra
already selected for the systematic comparison (Hesterberg et al., 1999; Peak et al., 2002). Additional libraries of four other studies were included, all but one of which were from the period between the review of Kizewski et al. (2011) and the collection of spectra for the systematic comparison (see bold reference numbers in Table 1). Plot data were retrieved by optical plot reading using a line-following routine (OPR; CurveSnap V1.0) and subsequently post-processed using a spreadsheet application (see Sect. 2.2).
The compiled library (Table 1) comprised 76 spectra of reference compounds, which included spectra of hydroxyla-patite (HAP), poorly crystalline HAP, amorphous HAP, FAP, CFAP, carbonate hydroxylapatite (CHAP), β-TCP, OCP, DCPD, monetite (DCPA), monocalcium phosphate (MCP), ACP and P on CaCO3. Five additional spectra of anapaite, herderite, scholzite, messelite and whiteite (Ingall et al., 2011) were used for a more general comparison but ex-cluded from a detailed analysis due to their unusual and easily distinguishable spectral features. In addition to the above-mentioned reference compounds, the library also in-cluded Ca-P of two sediment particles (Brandes et al., 2007; not listed in Table 1) and six bone apatites (deer, sheep, chamois, chicken, pig, bovine; Rajendran, 2011; Rajendran et al., 2013; not listed in Table 1). Most original spectra were already normalized by subtracting a linear regression func-tion for the pre-edge region and fitting the post-edge region to a quadratic polynomial function. However, all data were post-processed by a uniform procedure in order to standard-ize retrieved spectra.
2.2 Post-processing of P K-edge XANES spectra
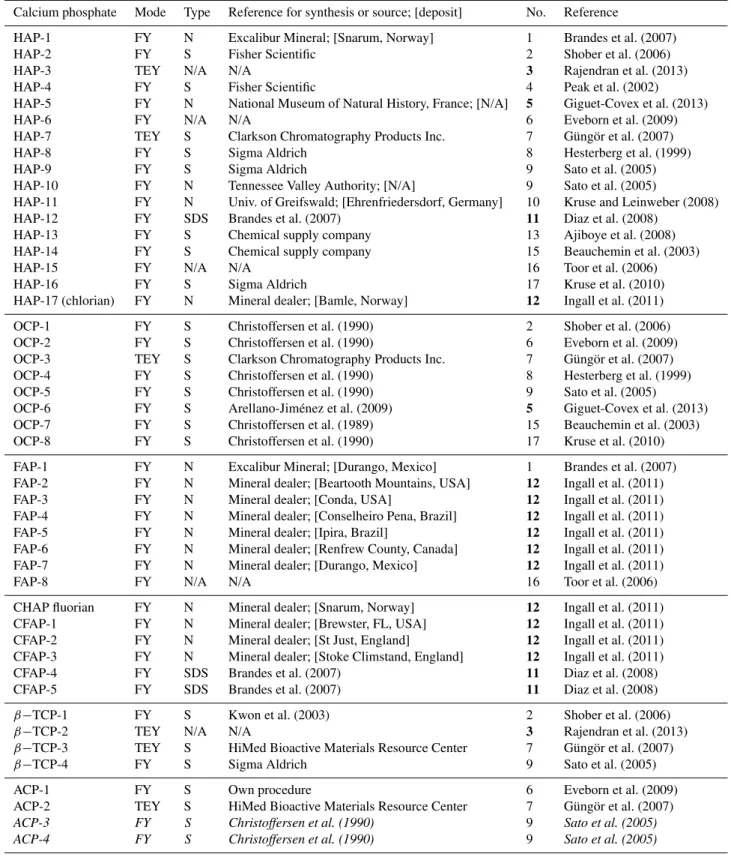
Table 1.Compiled library of P K-edge XANES spectra for calcium phosphate standards.
Calcium phosphate Mode Type Reference for synthesis or source; [deposit] No. Reference
HAP-1 FY N Excalibur Mineral; [Snarum, Norway] 1 Brandes et al. (2007) HAP-2 FY S Fisher Scientific 2 Shober et al. (2006) HAP-3 TEY N/A N/A 3 Rajendran et al. (2013) HAP-4 FY S Fisher Scientific 4 Peak et al. (2002) HAP-5 FY N National Museum of Natural History, France; [N/A] 5 Giguet-Covex et al. (2013)
HAP-6 FY N/A N/A 6 Eveborn et al. (2009)
HAP-7 TEY S Clarkson Chromatography Products Inc. 7 Güngör et al. (2007) HAP-8 FY S Sigma Aldrich 8 Hesterberg et al. (1999) HAP-9 FY S Sigma Aldrich 9 Sato et al. (2005) HAP-10 FY N Tennessee Valley Authority; [N/A] 9 Sato et al. (2005)
HAP-11 FY N Univ. of Greifswald; [Ehrenfriedersdorf, Germany] 10 Kruse and Leinweber (2008) HAP-12 FY SDS Brandes et al. (2007) 11 Diaz et al. (2008)
HAP-13 FY S Chemical supply company 13 Ajiboye et al. (2008) HAP-14 FY S Chemical supply company 15 Beauchemin et al. (2003)
HAP-15 FY N/A N/A 16 Toor et al. (2006)
HAP-16 FY S Sigma Aldrich 17 Kruse et al. (2010) HAP-17 (chlorian) FY N Mineral dealer; [Bamle, Norway] 12 Ingall et al. (2011)
OCP-1 FY S Christoffersen et al. (1990) 2 Shober et al. (2006) OCP-2 FY S Christoffersen et al. (1990) 6 Eveborn et al. (2009) OCP-3 TEY S Clarkson Chromatography Products Inc. 7 Güngör et al. (2007) OCP-4 FY S Christoffersen et al. (1990) 8 Hesterberg et al. (1999) OCP-5 FY S Christoffersen et al. (1990) 9 Sato et al. (2005)
OCP-6 FY S Arellano-Jiménez et al. (2009) 5 Giguet-Covex et al. (2013) OCP-7 FY S Christoffersen et al. (1989) 15 Beauchemin et al. (2003) OCP-8 FY S Christoffersen et al. (1990) 17 Kruse et al. (2010)
FAP-1 FY N Excalibur Mineral; [Durango, Mexico] 1 Brandes et al. (2007) FAP-2 FY N Mineral dealer; [Beartooth Mountains, USA] 12 Ingall et al. (2011) FAP-3 FY N Mineral dealer; [Conda, USA] 12 Ingall et al. (2011) FAP-4 FY N Mineral dealer; [Conselheiro Pena, Brazil] 12 Ingall et al. (2011) FAP-5 FY N Mineral dealer; [Ipira, Brazil] 12 Ingall et al. (2011) FAP-6 FY N Mineral dealer; [Renfrew County, Canada] 12 Ingall et al. (2011) FAP-7 FY N Mineral dealer; [Durango, Mexico] 12 Ingall et al. (2011)
FAP-8 FY N/A N/A 16 Toor et al. (2006)
CHAP fluorian FY N Mineral dealer; [Snarum, Norway] 12 Ingall et al. (2011) CFAP-1 FY N Mineral dealer; [Brewster, FL, USA] 12 Ingall et al. (2011) CFAP-2 FY N Mineral dealer; [St Just, England] 12 Ingall et al. (2011) CFAP-3 FY N Mineral dealer; [Stoke Climstand, England] 12 Ingall et al. (2011) CFAP-4 FY SDS Brandes et al. (2007) 11 Diaz et al. (2008) CFAP-5 FY SDS Brandes et al. (2007) 11 Diaz et al. (2008)
β−TCP-1 FY S Kwon et al. (2003) 2 Shober et al. (2006)
β−TCP-2 TEY N/A N/A 3 Rajendran et al. (2013)
β−TCP-3 TEY S HiMed Bioactive Materials Resource Center 7 Güngör et al. (2007)
β−TCP-4 FY S Sigma Aldrich 9 Sato et al. (2005)
ACP-1 FY S Own procedure 6 Eveborn et al. (2009) ACP-2 TEY S HiMed Bioactive Materials Resource Center 7 Güngör et al. (2007)
ACP-3 FY S Christoffersen et al. (1990) 9 Sato et al. (2005)
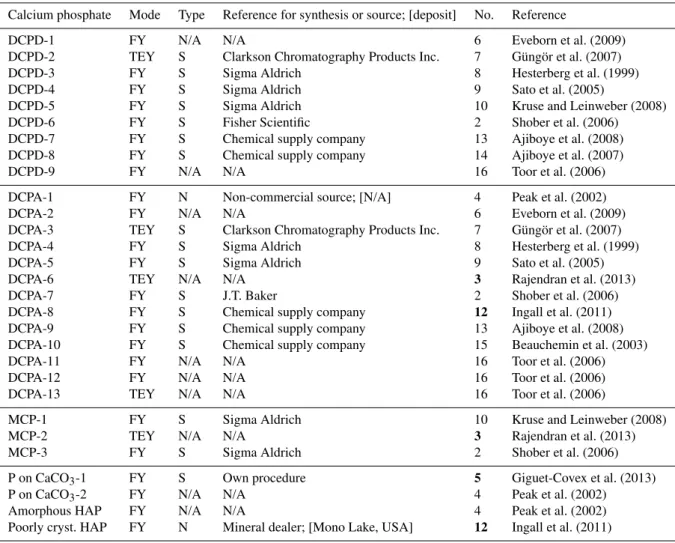
Table 1.Continued.
Calcium phosphate Mode Type Reference for synthesis or source; [deposit] No. Reference
DCPD-1 FY N/A N/A 6 Eveborn et al. (2009) DCPD-2 TEY S Clarkson Chromatography Products Inc. 7 Güngör et al. (2007) DCPD-3 FY S Sigma Aldrich 8 Hesterberg et al. (1999) DCPD-4 FY S Sigma Aldrich 9 Sato et al. (2005)
DCPD-5 FY S Sigma Aldrich 10 Kruse and Leinweber (2008) DCPD-6 FY S Fisher Scientific 2 Shober et al. (2006) DCPD-7 FY S Chemical supply company 13 Ajiboye et al. (2008) DCPD-8 FY S Chemical supply company 14 Ajiboye et al. (2007) DCPD-9 FY N/A N/A 16 Toor et al. (2006)
DCPA-1 FY N Non-commercial source; [N/A] 4 Peak et al. (2002) DCPA-2 FY N/A N/A 6 Eveborn et al. (2009) DCPA-3 TEY S Clarkson Chromatography Products Inc. 7 Güngör et al. (2007) DCPA-4 FY S Sigma Aldrich 8 Hesterberg et al. (1999) DCPA-5 FY S Sigma Aldrich 9 Sato et al. (2005) DCPA-6 TEY N/A N/A 3 Rajendran et al. (2013) DCPA-7 FY S J.T. Baker 2 Shober et al. (2006) DCPA-8 FY S Chemical supply company 12 Ingall et al. (2011) DCPA-9 FY S Chemical supply company 13 Ajiboye et al. (2008) DCPA-10 FY S Chemical supply company 15 Beauchemin et al. (2003) DCPA-11 FY N/A N/A 16 Toor et al. (2006) DCPA-12 FY N/A N/A 16 Toor et al. (2006) DCPA-13 TEY N/A N/A 16 Toor et al. (2006)
MCP-1 FY S Sigma Aldrich 10 Kruse and Leinweber (2008) MCP-2 TEY N/A N/A 3 Rajendran et al. (2013) MCP-3 FY S Sigma Aldrich 2 Shober et al. (2006)
P on CaCO3-1 FY S Own procedure 5 Giguet-Covex et al. (2013)
P on CaCO3-2 FY N/A N/A 4 Peak et al. (2002) Amorphous HAP FY N/A N/A 4 Peak et al. (2002) Poorly cryst. HAP FY N Mineral dealer; [Mono Lake, USA] 12 Ingall et al. (2011)
FY, TEY: fluorescence yield, total electron yield; S, N, N/A: synthetic, natural, not available; SDS: Secondary data source; italics: putative OCP-contaminated ACP; bold reference numbers: studies not included in Kizewski et al. (2011).
lines and oxygen oscillations. This procedure also allowed for an averaging of multiple spectra belonging to the same P species and setting peak baselines for all spectra at equal energies. For a more general comparison of species-specific spectral features (Sect. 3.2; Fig. 2), absorbance was normal-ized to go from 0 to 1 at the energy of the maximum first derivative (threshold energy; see Newville, 2004). The nor-malized spectra thus obtained were subsequently averaged for each species.
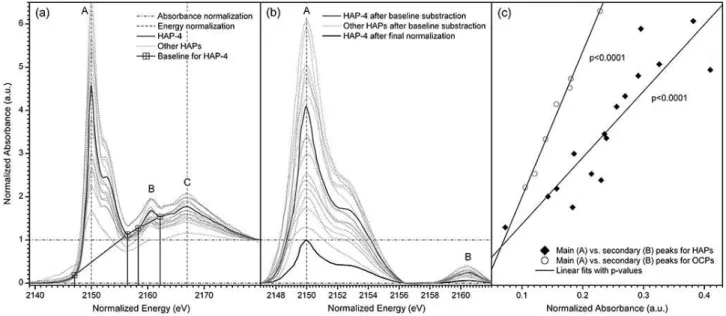
In order to determine main and secondary peak heights and relative peak positions, uniform baselines were opera-tionally defined across all energy-normalized spectra by lin-ear fits between energies of 2147.05, 2156.4, 2158.25 and 2162.2 eV (Fig. 1a) and subsequently subtracted (Fig. 1b). The baseline-subtracted spectra were again scaled relative to maximum main peak intensities of one (or 100 %) and then averaged for each species. This final normalization was em-ployed to visualize differences among peak intensity ratios (secondary peak heights relative to white-line peak heights)
Fig. 1.Normalization procedure for collected P K-edge XANES spectra as exemplified for HAP-4 and other HAP reference materials.(a)
Initial absorbance and energy normalization by adjusting absorbance to a unit edge jump at 2180 eV, main peaks (A) to 2150 eV and tertiary peaks (C) to ca. 2167 eV. Baselines for all spectra were operationally defined by linear fits between normalized energies of 2147.05, 2156.4, 2158.25 and 2162.2 eV.(b)Spectra after baseline subtraction. These baseline-subtracted spectra were finally scaled relative to maximum main peak intensities of one (see final normalization for HAP-4) to visualize differences among peak intensity ratios (A/B) for reference compounds analysed (Fig. 3).(c)As indicated for HAP and OCP reference materials, peak intensities of main (A) and secondary (B) peaks were linearly correlated. Resulting intensity ratios identified species-specific fingerprints (Figs. 3 and 4). See Table 1 for analyte properties.
between results of these two input data types was highly sig-nificant (r=0.99;p <0.0001).
3 Results and discussion
3.1 Spectral library
Among the 76 spectra of the compiled library (Table 1), HAP had the highest number of available spectra (n=17), fol-lowed by DCPA (n=13), DCPD (n=9), FAP (n=8), OCP (n=8), carbonated apatites (n=6), β-TCP (n=4), ACP (n=4), MCP (n=3), P on CaCO3 (n=2), amorphous HAP (n=1) and poorly crystalline HAP (n=1). As most of the different spectra for certain particular species were sim-ilar, representative model spectra were obtained by averag-ing multiple curves. Additionally, five easily distaverag-inguishable standard spectra of non-apatitic Ca-P compounds (anapaite, herderite, scholzite, messelite, whiteite; Ingall et al., 2011) are shown for a more general comparison in Fig. 2.
The majority of reference materials were either self-synthesized minerals or certified synthetic minerals of chem-ical supply companies. Fluorapatites and carbonated apatites were natural specimens acquired from mineral dealers. For HAP, the library included several spectra of natural and syn-thetic specimens, thereby facilitating a spectral comparison of both sources. Additional Ca-P spectra of sediment par-ticles (Brandes et al., 2007) and bone apatites (Rajendran,
2011; Rajendran et al., 2013) demonstrated the capability of the developed normalization method for determining partic-ular Ca-P minerals in sample matrices (see Sect. 3.4).
Despite certain advantages, such as surface-sensitivity and prevention of self-absorption, spectra collected were rarely obtained by measuring the intensity of emitted electrons (TEY; Table 1). Most spectra were collected in fluorescence mode and most procedures describe measures taken to re-duce self-absorption (e.g. using diluted or finely ground and thinly mounted samples) or to correct data by appropriate equations. One advantage of FY spectra is their occasionally richer structure compared to TEY spectra (see Toor et al., 2006). However, spectra for certain species that were col-lected by both techniques yielded comparable results (see Sect. 3.5).
3.2 General species-specific spectral features
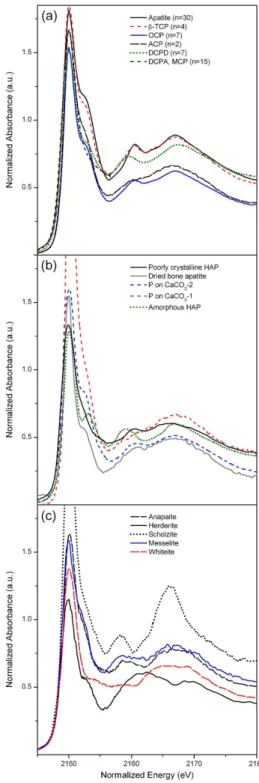
Fig. 2.First-derivative normalized P K-edge XANES spectra of Ca-P reference compounds. (a) Averaged spectra for apatites,
β-tricalcium phosphate (β-TCP), octacalcium phosphate (OCP), amorphous calcium phosphate (ACP), brushite (DCPD), monetite (DCPA) and monocalcium phosphate (MCP).(b)Spectra for poorly crystalline and amorphous apatite, bone apatite and P adsorbed on CaCO3.(c)Spectra of different non-apatitic Ca-P minerals (Ingall et al., 2011). Oxygen oscillations in(c)were not adjusted to ca. 2167 eV due to unusual spectral features.
located at about 2150 eV; (ii) an oxygen oscillation centred at about 17 eV above the main peak; and (iii) a secondary peak between the main peak and the oxygen oscillation (Fig. 2a). Averaged spectra of apatite (n=30),β-TCP (n=4), OCP (n=7) and ACP (n=2) exhibited all three features, and the positions of secondary peaks between main peaks and oxy-gen oscillations were almost identical. The distance between main peaks and secondary peaks was larger (ca. 10 eV) than the distance between secondary peaks and oxygen oscilla-tions (ca. 7 eV). For brushite (n=7), all three features were also present but secondary peaks exhibited a slight shift to-wards main peaks. The spectra of monetite and MCP were comparable and displayed a lack of the post-edge shoulder (secondary peak and oxygen oscillation omitted in Fig. 2a for visual clarity). A few spectra of the reference library were excluded from averaging in Fig. 2a due to a limited energy range (spectra of Beauchemin et al., 2003) or inconsistency with common species-specific spectra (see explanations in Sect. 3.3).
Cryptocrystalline apatites and P adsorbed on CaCO3were generally characterized by broadened peaks, particularly in terms of their oxygen oscillations (Fig. 2b). Co-precipitation is frequently an issue for the synthesis of P adsorbed on CaCO3. Thus, the line shape of spectra of adsorbed P, which was comparable to those of poorly crystalline apatite or ACP, may be attributable to mineral Ca-P (Peak et al., 2002). Co-precipitation probably also affected the spectrum of amor-phous apatite because it showed the brushite-typical sec-ondary peak shift. Spectra of different additional non-apatitic Ca-P minerals (Ingall et al., 2011, Fig. 2c) were generally easily distinguishable from those of apatite, β-TCP, OCP, ACP, brushite and monetite due to unusual features. These features included very broad secondary peaks and/or very broad oxygen oscillations for whiteite, herderite, anapaite and messelite and a comparatively high intensity of the oxy-gen oscillation for scholzite.
Differences among spectra of apatite, β-TCP, OCP and ACP were most difficult to unravel due to very similar cen-tre positions and energy ranges of peaks (Fig. 2). In order to distinguish these spectra, it proved necessary to consider peak intensities. However, these intensities are frequently in-fluenced by self-absorption and generally given as arbitrary units. To solve this problem, peak-height ratios between main and secondary peaks were analysed. Corresponding results are described in the following section.
3.3 Species-specific peak-height ratios
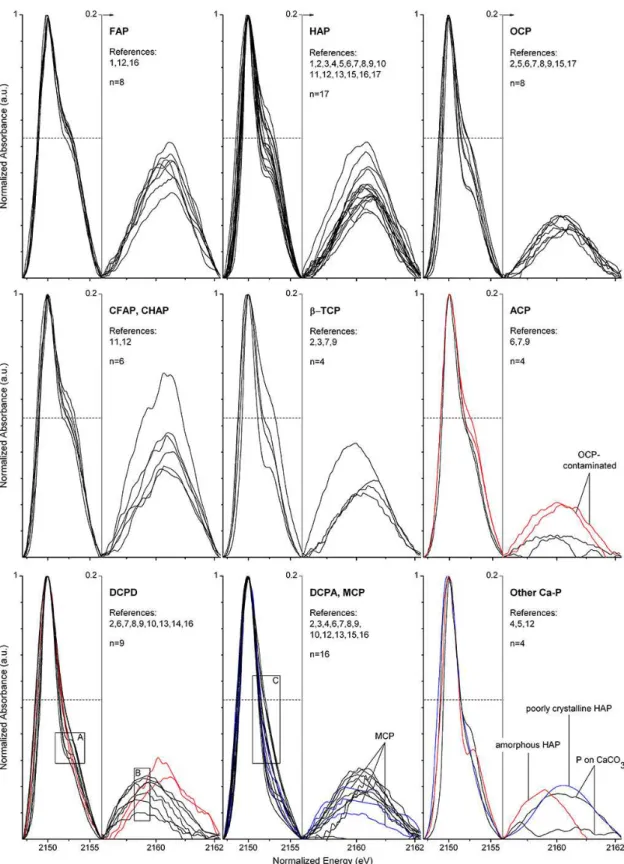
energies, as described above. Two atypical DCPD spectra had secondary peaks at higher energies (red curves in DCPD plot; excluded from averaging in Fig. 2). These spectra were, however, still distinguishable from spectra of OCP because they lacked OCP-typical post-edge shoulders. Due to con-sistently absent post-edge shoulders, the spectra of DCPA and MCP were also different from OCP despite many OCP-typical secondary peaks of DCPA and MCP. Furthermore, spectra of reference materials for P adsorbed on CaCO3and for amorphous and poorly crystalline HAP partly exhibited OCP-typical secondary peak heights but they showed other distinctive features, as described above. Therefore, the spec-tra of the 8 analysed OCP specimens were unique among the 81 analysed spectra of various Ca-P species, albeit with one probably insignificant restriction: two of the four ACP ref-erence materials showed secondary peak heights that were comparable to those of OCP (red curves in ACP plot of Fig. 3; excluded from averaging in Fig. 2). However, Eve-born et al. (2009) noticed by ATR-FTIR (attenuated to-tal reflectance Fourier-transform infrared spectroscopy) and XRPD (X-ray powder diffraction) analyses that the method suggested by Christoffersen et al. (1990) for synthesis of two ACP polymorphs (frequently referred to as ACP1 and ACP2) produced significant amounts of OCP. Yet the method of Christoffersen et al. (1990) was employed to synthesize samples for the two ACP spectra, which were comparable to those of OCP (Table 1, italics). Eveborn et al. (2009) sub-sequently developed their own procedure and the OCP-free sample produced generated a spectrum, which was compara-ble to that of an ACP reference material produced by a chem-ical supply company (HiMed Bioactive Materials Resource Center; Table 1; Güngör et al., 2007). These two reliable ACP spectra exhibited significantly lower secondary peak heights than all eight OCP spectra and were therefore easily dis-tinguishable from OCP (Fig. 3). Finally, both of these reli-able ACP spectra also showed a less pronounced shoulder, whereas spectra of the putatively OCP-contaminated ACP samples exhibited a larger OCP-like shoulder width (Fig. 3; see also discussion below). These results therefore strongly suggest that the reference materials for the two OCP-like ACP spectra were indeed OCP-contaminated and that par-ticular care must be taken to avoid this contamination. Simi-lar relative secondary peak heights of the eight OCP spectra indicated that OCP can be reliably synthesized using the pro-cedures described (Table 1). Furthermore, these similar peak heights resulted in a relatively narrow secondary peak inten-sity range that did not overlap with that of apatite. All in all, then, OCP, ACP, DCPD and DCPA/MCP are likely distin-guishable by P K-edge XANES using the proposed method that implements an analysis of peak-height ratios. Moreover, this method can also be applied to differentiate between these thermodynamically less stable Ca-P minerals and apatite or
β-TCP.
As secondary peak intensity ranges of different spec-tra for FAP, HAP, CFAP, CHAP and β-TCP generally
overlap, these compounds could not be separately identi-fied by their relative secondary peak heights. However, re-sults of a one-way analysis of variance revealed statisti-cally significant differences between groups of these ref-erence compounds in terms of relative secondary peak heights (FAP/CFAP/CHAP, HAP, β-TCP: F(2, 31)=6.10,
p=0.0058). Post hoc analyses indicated that the group of FAP, CFAP and CHAP had significantly higher normal-ized secondary peaks than HAP orβ-TCP. Further, signifi-cant differences were detected between groups of apatite/β -TCP, OCP, ACP, DCPD and DCPA/MCP in terms of rel-ative secondary peak heights (FAP/HAP/CFAP/CHAP/ß-TCP, OCP, ACP, DCPD, DCPA/MCP: F(4, 62) = 24.18,
p <0.0001). Related post hoc analyses showed that the apatite/ß-TCP group had significantly higher secondary peaks compared to OCP, ACP, DCPD and DCPA/MCP. Av-eraged secondary peak heights were obtained from model spectra, which were created by averaging multiple nor-malized and baseline-subtracted spectra for each species (Fig. 4). These average heights (% of white-line peak height; Fig. 4; Table 2) decreased in the following order: FAP (8.5 %)>carbonated apatites (8 %)>HAP (7 %)> β-TCP (5.9 %)>OCP (4 %)>DCPD (3.7 %)>ACP (1.6 %). The averaged post-edge shoulder height (% of main peak height; Fig. 4; Table 2) decreased in precisely the same sequence, and hence these two parameters were generally correlated (also for sets of reference compounds belonging to the same species; not shown), except for ACP. However, ACP showed a less pronounced post-edge shoulder when compared to the other species shown in Fig. 4.
Fig. 4.Secondary peak heights and post-edge shoulder heights in percentages of white-line peak heights for P K-edge XANES spectra of different Ca-P species. Peak-height percentages of µXANES data of sediment particles (Brandes et al., 2007) indicate apatite (Sed1) and OCP (Sed2). The apparent OCP peak is different from DCPD due to its different peak position as indicated by a Gaussian Fit (Sed2*; cf. position with D). Individual spectra collected in fluorescence yield and total electron yield mode are shown for secondary peaks by thin and thick grey lines, respectively. Thick blue lines indicate averages for multiple standard curves (n), for which average secondary peak-height percentages and average secondary peak positions (eV) are indicated. Multiple natural (N; average of five spectra) and synthetic (S; average of eight spectra) HAP specimens contribute to the total average of the secondary HAP peak (n=17; precise source of four HAP specimens unknown). Secondary peaks of averaged spectra for six calcined bone apatites (CB; not included in the total HAP average) and synthetic HAP (S) match almost perfectly. FAP: fluorapatite; CFAP: carbonate fluorapatite; CHAP: carbonate hydroxylapatite; HAP: hydroxylapatite;
β-TCP:β-tricalcium phosphate; OCP: octacalcium phosphate; DCPD: dicalcium phosphate dihydrate or brushite; ACP: amorphous calcium phosphate.
may depend on the coordination number. However, a com-parison of the averaged spectra clearly showed that, on aver-age, all apatite species exhibited both higher secondary peak heights and higher post-edge shoulder positions than poten-tial apatite precursor phases (Fig. 4). Hence, several spectral features of Ca-P species are related to the crystallinity, coor-dination number and thermodynamic stability. For example, the relative secondary peak height was larger for species with higher thermodynamic stability. Averaged relative secondary peak heights were larger for FAP, CFAP/CHAP, HAP
(syn-thetic, natural and poorly crystalline), TCP and OCP than for DCPD, DCPA/MCP and ACP (Table 2).
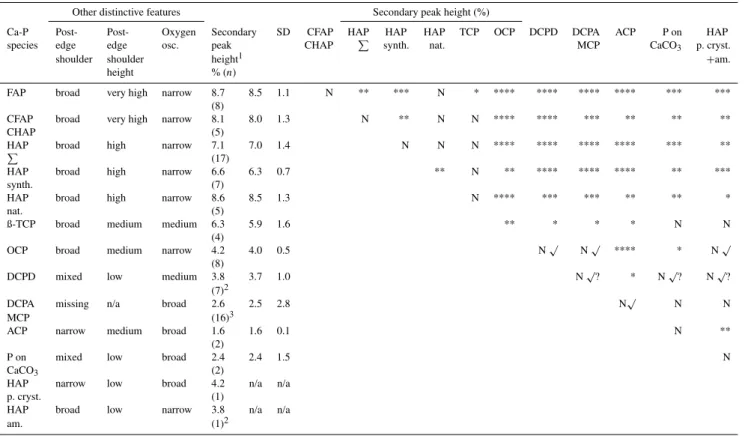
Table 2.Summary of diagnostic P K-edge XANES features for various Ca-P species.
Other distinctive features Secondary peak height (%)
Ca-P Post- Post- Oxygen Secondary SD CFAP HAP HAP HAP TCP OCP DCPD DCPA ACP P on HAP species edge edge osc. peak CHAP P synth. nat. MCP CaCO3 p. cryst.
shoulder shoulder height1 +am.
height % (n)
FAP broad very high narrow 8.7 8.5 1.1 N ** *** N * **** **** **** **** *** *** (8)
CFAP broad very high narrow 8.1 8.0 1.3 N ** N N **** **** *** ** ** **
CHAP (5)
HAP broad high narrow 7.1 7.0 1.4 N N N **** **** **** **** *** **
P
(17)
HAP broad high narrow 6.6 6.3 0.7 ** N ** **** **** **** ** ***
synth. (7)
HAP broad high narrow 8.6 8.5 1.3 N **** *** *** ** ** *
nat. (5)
ß-TCP broad medium medium 6.3 5.9 1.6 ** * * * N N
(4)
OCP broad medium narrow 4.2 4.0 0.5 N√ N√ **** * N√ (8)
DCPD mixed low medium 3.8 3.7 1.0 N√? * N√? N√? (7)2
DCPA missing n/a broad 2.6 2.5 2.8 N√ N N
MCP (16)3
ACP narrow medium broad 1.6 1.6 0.1 N **
(2)
P on mixed low broad 2.4 2.4 1.5 N
CaCO3 (2)
HAP narrow low broad 4.2 n/a n/a
p. cryst. (1)
HAP broad low narrow 3.8 n/a n/a
am. (1)2
1Averaged relative secondary peak height (% of white-line peak height). Left column: averaged secondary peak height (%) of individual spectra and number of averaged spectra in parentheses. Right column: secondary peak height (%) of model spectra (averages for multiple curves; Fig. 4)
2
Secondary peak shifted towards main peak.
3Includes four spectra, which lacked a secondary peak (see high standard deviation).
N: difference of secondary peak heights (%; population means) is non-significant (two-sample independentttest) *: difference of secondary peak heights (%) is significant at the 0.05 level
**: difference of secondary peak heights (%) is significant at the 0.01 level ***: difference of secondary peak heights (%) is significant at the 0.001 level ****: difference of secondary peak heights (%) is significant at the 0.0001 level
N√: denotes other distinctive features for two species which cannot be distinguished by their secondary peak heights (note that other distinctive features are not denoted for pairs with significantly different secondary peak heights). OCP distinguishable from DCPD (secondary peak shift or missing post-edge shoulder), DCPA (missing post-edge shoulder), MCP (missing post-edge shoulder), poorly crystalline HAP (missing post-edge shoulder, broad oxygen oscillation) and amorphous HAP (secondary peak shift). ACP distinguishable from DCPD/MCP (missing post-edge shoulder).
N√?: denotes other potentially distinctive features for two species which cannot be distinguished by their secondary peak heights. DCPD likely (note the two atypical DCPDs in Fig. 3) distinguishable from DCPA (absent secondary peak shift), P on CaCO3(absent secondary peak shift, broad oxygen oscillation) and poorly crystalline HAP (absent secondary peak shift).
Note that P on CaCO3was probably contaminated by crystalline Ca-P phases (see text) and that poorly crystalline HAP and amorphous HAP require further verification by additional spectra.
Abbreviations: n/a (not applicable); SD (standard deviation); oxygen osc. (oxygen oscillation); HAP synth. (synthetic HAP); HAP nat. (natural HAP); HAP p. cryst. (poorly crystalline HAP); HAP am. (amorphous HAP).
additional discrimination between species (Table 2). This de-gree of differentiation is achieved despite measurement devi-ations among different spectral libraries. In general, within-study differences between spectral features of two species were more pronounced than could be assumed from the peak intensity ranges shown in Figs. 3 and 4. For example, the plots for HAP and OCP show a relatively small difference between the lowest secondary peak for HAP and the highest peak for OCP. However, these two spectra were not pairwise (collected in the same study) spectra. Each of the eight stud-ies which collected an OCP spectrum also provided an HAP spectrum (see reference numbers in Fig. 3) and correspond-ing discrepancies in secondary peak heights between these two species were relatively large.
3.4 Speciation examples
bones, which could be a consequence of various impurities, such as fluoride substitutions. The HAP sample from Snarum (Norway; Brandes et al., 2007) was the only natural HAP that matched the secondary peak of synthetic HAP well (cf. syn-thetic HAP and HAP-1 in Fig. S2 in the Supplement). Hence, the selection of natural vs. synthetic HAP reference materi-als appears to be important for commonly used quantitative XANES approaches, such as least-squares linear combina-tion fitting.
Further, Rajendran et al. (2013) speculated that dried bone probably contained HAP andβ-TCP. Indeed dried bone ap-atite (Fig. S2 in the Supplement) showed a much lower sec-ondary peak than synthetic HAP, which could theoretically indicate the presence of more soluble precursor phases. For instance, all secondary peaks of dried bone apatite were even smaller than those of OCP. However, the secondary peak height of dried bone was also comparable to that of poorly crystalline HAP. From a closer observation of the entire spec-trum it may be deduced that dried bone actually consisted of poorly crystalline apatite because both of these had rela-tively broad oxygen oscillations (Fig. 2b). This assumption would be in line with the conclusion of Rey et al. (2009), who inferred from a thorough review of several studies that no substantial evidence has been established for the presence of any Ca-P phase in bone except for poorly crystalline ap-atite. As it was not possible to unequivocally identify more soluble precursor phases in bone, apatite may form only by direct nucleation in bone.
Interestingly, this direct nucleation in bone is opposed to the well-documented apatite formation by precursor phases in sediment (Gunnars et al., 2004; Jahnke et al., 1983; Kra-jewski et al., 1994; Oxmann and Schwendenmann, 2014; Schenau et al., 2000; Van Cappellen and Berner, 1988; see also Morse and Casey (1988) and Nancollas et al. (1989) for the Ostwald step rule of successive crystallization; note also the significant apparent OCP levels in high pH sub-strates determined, e.g., by Beauchemin et al. (2003) using linear combination fitting of XANES spectra). This precur-sor pathway for the formation of authigenic CFAP, which appears likely, is also substantiated by the second example of the applicability of the proposed method. Post-processing of µXANES spectra from two sedimentary Ca-P particles (Brandes et al., 2007) revealed that the secondary peak height of one particle was comparable to that of FAP (Fig. 4, Sed1), whereas the secondary peak of the other particle very closely matched the averaged secondary peak of OCP (Fig. 4, Sed2 and Sed2*). That the latter particle most likely comprised OCP was also confirmed by all other important spectral fea-tures, such as a missing shift of the secondary peak for ex-clusion of DCPD (Fig. 4, D), an OCP-typical shoulder height and a broader shoulder feature. Finally, the spectrum ex-hibited a well-separated oxygen oscillation that rules out P adsorbed on CaCO3 and poorly crystalline apatite. In view
good opportunity to approach the subject of the very early formation stages of authigenic CFAP with a novel technique. The formation of CFAP-bearing phosphorite deposits, for in-stance, still remains controversial after several decades of intense research (e.g. Bentor, 1980; Sheldon, 1981; Tribble et al., 1995). Brandes et al. (2007) further concluded that a suite of appropriate reference materials will be required to tackle these issues by XANES. By considering 81 Ca-P reference materials of 17 spectral libraries, this study pro-vides evidence that P K-edge XANES is indeed excellently suited for investigations on apatite formation. This study also provides evidence that authigenic apatite formation proceeds most likely via an OCP precursor pathway, in addition to direct nucleation. The numerous controls on the two path-ways in sediment can be summed up by the terms “saturation state” (e.g. supersaturation with respect to CFAP or precur-sors; Atlas, 1975; Gunnars et al., 2004; Van Cappellen and Berner, 1991), “kinetic factors” (Atlas and Pytkowicz, 1977; Gulbrandsen et al., 1983; Gunnars et al., 2004, Jahnke et al., 1983; Schenau et al., 2000; Sheldon, 1981) and “inhibitors” (Eanes and Rattner, 1981; Golubev et al., 1999; Gunnars et al., 2004; Martens and Harriss, 1970; Van Cappellen and Berner, 1991). In consideration of the still limited knowledge about the complex interplay of these factors in CFAP forma-tion, Slomp (2011) recently emphasized the need for detailed studies on this subject.
3.5 Limitations, possible sources of error and recommendations
Based on the relatively large number of naturally occurring Ca-P species, numerous identifying features are required to obtain adequate analyte specificity. The spectral breakdown presented considered a representative set of the most abun-dant Ca-P species in environmental and biological matrices and should therefore be well suited for studies in different fields. Constraints due to the presence of P species other than those of Ca-P appear to be insignificant because features of Ca-P at the P K-edge were found to be distinctive. For in-stance, spectra of Ca-P are easily distinguishable from those of potassium phosphates, aluminium phosphates, iron phos-phates and organic P compounds (e.g. Brandes et al., 2007; Giguet-Covex et al., 2013; Sato et al., 2005).
may attenuate not only main but also other peaks. Significant linear correlations between main and secondary peak heights for edge-jump-normalized spectra of certain species (p <
0.0001; Fig. 1c) clearly demonstrated that a consideration of peak-height ratios was crucial for distinguishing between spectra of different species. However, this differentiation was more reliable for spectra with intense peaks (Fig. 1c), sug-gesting that self-absorption should be efficiently mitigated. Known effects of inappropriate particle sizes may also influ-ence peak-height ratios and should therefore be considered during measurements.
Quantitative estimates by bulk XANES measurements re-quire thorough analysis because spectral features of differ-ent species overlap (Beauchemin et al., 2003; Doolette and Smernik, 2011). However, due to the poor resolution of bulk XANES analyses in complex matrices even a qualitative detection may not be feasible, e.g. if the species of inter-est is a minor component. In this case µXANES analysis, which also allows for X-ray fluorescence mapping of P and other elements at a sub-micron spatial resolution (Brandes et al., 2007; Diaz et al., 2008), appears to be the instrumental method of choice.
The spectral analysis presented in this study also provides recommendations for standard selection and synthesis. For example, only few spectra were available for Ca-P com-pounds that exhibited relatively broad oxygen oscillations. These spectra included P adsorbed on CaCO3and amorphous or poorly crystalline phases, such as ACP or poorly crys-talline apatite. Precisely those reference compounds tended to be more unreliable due to co-precipitation. Therefore, these compounds should be additionally verified by other an-alytical methods or acquired from sources that provide a cor-responding product certification.
4 Conclusions
In this study, a novel normalization method was developed, which, for the first time, allowed for a systematic compari-son of P K-edge XANES spectra of a compiled library, and which facilitated the identification of important diagnostic spectral Ca-P features in this library. The compiled library included 81 spectra of various Ca-P species from 17 libraries. The normalization method considered relative energy ranges between peaks, and peak-height ratios between main and sec-ondary peaks. It was found that relative post-edge shoulder heights and relative secondary peak heights provide essen-tial identifying features in addition to the previously reported criterion of a pronounced post-edge shoulder. These relative heights were crucial for improved analyte specificity, specif-ically because they provided a set of distinctive features (e.g. distinctive species-specific peak intensity ranges). A spectral breakdown is given in Table 2 in order to summarize deter-mined diagnostic features. From this follows that P K-edge XANES is excellently suited for environmental and
biolog-ical research on Ca-P and that the method developed allows for a high degree of differentiation among Ca-P species.
Important applications for the method were demonstrated by two examples: (i) application of the method to bone ap-atite spectra confirmed that bone material likely comprises only poorly crystalline apatite, which confirms direct nucle-ation of apatite in bone. This direct nuclenucle-ation in bone is ap-parently opposed to the well-documented authigenic apatite formation by precursor phases in sediment. (ii) Application of the method to µXANES spectra of sediment particles pro-vided evidence for the occurrence of OCP in sediment and therefore for the probability of apatite formation by succes-sive crystallization according to the Ostwald step rule. Fi-nally, the method presented also revealed that reference ma-terials were occasionally inconsistent or incorrectly assigned due to apparent contamination. Hence, this study also offered a basis for standard selection and appropriate standard syn-theses.
Supplementary material related to this article is available online at http://www.biogeosciences.net/11/ 2169/2014/bg-11-2169-2014-supplement.zip.
Acknowledgements. I thank Luitgard Schwendenmann (The
University of Auckland; School of Environment) for valuable comments on an earlier version of the manuscript. Thanks also to Peter Kraal (Utrecht University; Faculty of Geosciences) and an anonymous referee for constructive and helpful comments during the review process. This study was funded by the German Research Foundation through a research fellowship granted to J. F. Oxmann under the code OX 54/2-1.
The service charges for this open access publication have been covered by a Research Centre of the Helmholtz Association.
Edited by: J. Middelburg
References
Ajiboye, B., Akinremi, O. O., Hu, Y., and Flaten, D. N.: Phos-phorus speciation of sequential extracts of organic amendments using nuclear magnetic resonance and X-ray absorption near-edge structure spectroscopies, J. Environ. Qual., 36, 1563–1576, 2007a.
Ajiboye, B., Akinremi, O. O., and Jürgensen, A.: Experimental val-idation of quantitative XANES analysis for phosphorus specia-tion, Soil Sci. Soc. Am. J., 71, 1288–1291, 2007b.
Ajiboye, B., Akinremi, O. O., Hu, Y., and Jürgensen, A.: XANES speciation of phosphorus in organically amended and fertilized vertisol and mollisol, Soil Sci. Soc. Am. J., 72, 1256–1262, 2008. Atlas, E. L.: Phosphate equilibria in seawater and interstitial waters,
Ban, S., Matsuura, M., Arimoto, N., Hayashizaki, J., Itoh, Y., and Hasegawa, J.: Factors affecting the transformation of octacal-cium phosphate to apatite in vitro, Dent. Mater. J., 12, 106–117, 1993.
Baturin, G. N.: Principal features of the marine geochemistry of disseminated phosphorus, in: Developments in Sedimentology, edited by: Baturin, G. N., Elsevier B. V., 343 pp., 1981. Beauchemin, S., Hesterberg, D., Chou, J., Beauchemin, M.,
Simard, R. R., and Sayers, D. E.: Speciation of phosphorus in phosphorus-enriched agricultural soils using X-ray absorption near-edge structure spectroscopy and chemical fractionation, J. Environ. Qual., 32, 1809–1819, 2003.
Bentor, Y. K.: Phophorites: the unsolved problems, in: Marine Phos-phorites: Geochemistry, Occurence, Genesis, edited by: Bentor, Y. K., SEPM (Society for Sediment Geology), Tulsa, 247, 3–18, 1980.
Brandes, J. A., Ingall, E., and Paterson, D.: Characterization of min-erals and organic phosphorus species in marine sediments us-ing soft X-ray fluorescence spectromicroscopy, Mar. Chem., 103, 250–265, 2007.
Christoffersen, M. R., Christoffersen, J., and Kibalczyc, W.: Appar-ent solubilities of 2 amorphous calcium phosphates and of octa-calcium phosphate in the temperature-range 30–42◦C, J. Cryst.
Growth, 106, 349–354, 1990.
Diaz, J., Ingall, E., Benitez-Nelson, C., Paterson, D., de Jonge, M. D., McNulty, I., and Brandes, J. A.: Marine polyphosphate: A key player in geologic phosphorus sequestration, Science, 320, 652–655, 2008.
Doolette, A. L. and Smernik, R. J.: Soil organic phosphorus speci-ation using spectroscopic techniques, in: Phosphorus in Action: Biological Processes in Soil Phosphorus Cycling. Soil Biology Series 26, edited by: Bünemann, E. K., Oberson, A., Frossard, E., Springer, Berlin, Heidelberg, 3–36, 2011.
Eanes, E. D. and Rattner, S. L.: The effect of magnesium on apatite formation in seeded supersaturated solutions at pH 7.4, J. Dent. Res., 60, 1719–1723, 1981.
Eveborn, D., Gustafsson, J. P., Hesterberg, D., and Hillier, S.: XANES speciation of P in environmental samples: an assess-ment of filter media for on-site wastewater treatassess-ment, Environ. Sci. Tech., 43, 6515–6521, 2009.
Giguet-Covex, C., Poulenard, J., Chalmin, E., Amoud, F., Ri-vard, C., Jenny, J.-P., and Dorioz, J. M.: XANES spec-troscopy as a tool to trace phosphorus transformation dur-ing soil genesis and mountain ecosystem development from lake sediments, Geochim. Cosmochim. Ac., 118, 8244, doi:10.1016/j.gca.2013.04.017, 2013.
Golubev, S. V., Pokrovsky, O. S., and Savenko, V. S.: Unseeded pre-cipitation of calcium and magnesium phosphates from modified seawater solutions, J. Cryst. Growth, 205, 354–360, 1999. Gulbrandsen, R. A., Roberson, C. E., and Neil, S. T.: Time and the
crystallization of apatite in seawater, Geochim. Cosmochim. Ac., 48, 213–218, 1983.
Güngör, K., Jürgensen, A., and Karthikeyan, K. G.: Determina-tion of phosphorus speciaDetermina-tion in dairy manure using XRD and XANES spectroscopy, J. Environ. Qual., 36, 1856–1863, 2007.
perimental approach, Mar. Chem., 91, 15–26, 2004.
Hesterberg, D., Zhou, W., Hutchison, K. J., Beauchemin, S., and Sayers, D. E.: XAFS study of adsorbed and mineral forms of phosphate, J. Synchrotron Rad., 6, 636–638, 1999.
Ingall, E. D., Brandes, J. A., Diaz, J. M., de Jonge, M. D., Paterson, D., McNulty, I., Elliott, W. C., and Northrup, P.: Phosphorus K-edge XANES spectroscopy of mineral standards, J. Synchrotron Rad., 18, 189–197, 2011.
Jahnke, R. A., Emerson, S. R., Roe, K. K., and Burnett, W. C.: The present day formation of apatite in Mexican continental margin sediments, Geochim. Cosmochim. Ac., 47, 259–266, 1983. Kizewski, F., Liu, Y.-T., Morris, A., and Hesterberg, D.:
Spectro-scopic approaches for phosphorus speciation in soils and other environmental systems, J. Environ. Qual., 40, 751–766, 2011. Krajewski, K. P., Van Cappellen, P., Trichet, J., Kuhn, O., Lucas, J.,
Martinalgarra, A., Prevot, L., Tewari, V. C., Gaspar, L., Knight, R. I., and Lamboy, M.: Biological processes and apatite forma-tion in sedimentary environments, Eclog. Geol. Helvet., 87, 701– 745, 1994.
Kruse, J. and Leinweber, P.: Phosphorus in sequentially extracted fen peat soils: a K-edge X-ray absorption near-edge structure (XANES) spectroscopy study, J. Plant Nutr. Soil Sci., 171, 613– 620, 2008.
Kruse, J., Negassa, W., Appathurai, N., Zuin, L., and Leinweber, P.: Phosphorus speciation in sequentially extracted agro-industrial by-products: Evidence from X-ray absorption near edge structure spectroscopy, J. Environ. Qual., 39, 2179–2184, 2010.
Lombi, E., Scheckel, K. G., Armstrong, D., Forrester, S., Cutler, J. N., and Paterson, D.: Speciation and distribution of phosphorus in a fertilized soil: a synchrotron-based investigation, Soil Sci. Soc. Am. J., 70, 2038–2048, 2006.
Martens, C. S. and Harriss, R. C.: Inhibition of apatite precipitation in the marine environment by magnesium ions, Geochim. Cos-mochim. Ac., 84, 621–625, 1970.
Morse, J. W. and Casey, W. H.: Ostwald processes and mineral par-agenesis in sediments, Am. J. Sci., 288, 537–560, 1988. Nancollas, G. H., LoRe, M., Perez, L., Richardson, C., and Zawacki,
S. J.: Mineral phases of calcium phosphate, Anat. Rec., 224, 234– 241, 1989.
Newville, M.: Fundamentals of XAFS revision 1.7, Consortium for Advanced Radiation Sources, University of Chicago, Chicago, 2004.
Oxmann, J. F. and Schwendenmann, L.: Quantification of octacal-cium phosphate, authigenic apatite and detrital apatite in coastal sediments using differential dissolution and standard addition, Ocean Sci. Discuss., 11, 293–329, 2014,
http://www.ocean-sci-discuss.net/11/293/2014/.
Peak, D., Sims, J. T., and Sparks, D. L.: Solid-state speciation of natural and alum-amended poultry litter using XANES spec-troscopy, Environ. Sci. Tech., 36, 4253–4261, 2002.
Rajendran, J.: XANES and FTIR study on dried and calcined bones, M.S. thesis, The University of Texas at Arlington, 98 pp., 2011. Rajendran, J., Gialanella, S., and Aswath, P.: XANES analysis of
Rey, C., Combes, C., Drouet, C., and Glimcher, M. J.: Bone mineral: update on chemical composition and structure, Osteoporosis Int., 20, 1013–1021, 2009.
Ruttenberg, K. C.: Development of a sequential extraction method for different forms of phosphorus in marine sediments, Limnol. Oceanogr., 37, 1460–1482, 1992.
Ruttenberg, K. C. and Berner, R. A.: Authigenic apatite formation and burial in sediments from non-upwelling continental margin environments, Geochim. Cosmochim. Ac., 57, 991–1007, 1993. Sato, S., Solomon, D., Hyland, C., Ketterings, Q. M., and Lehmann, J.: Phosphorus speciation in manure and manure-amended soils using XANES spectroscopy, Environ. Sci. Tech., 39, 7485–7491, 2005.
Schenau, S. J. and De Lange, G. J.: A novel chemical method to quantify fish debris in marine sediments, Limnol. Oceanogr., 45, 963–971, 2000.
Schenau, S. J., Slomp, C. P., and De Lange, G. J.: Phosphogenesis and active phosphorite formation in sediments from the Arabian Sea oxygen minimum zone, Mar. Geol., 169, 1–20, 2000. Seiter, J. M., Staats-Borda, K. E., Ginder-Vogel, M., and Sparks,
D. L.: XANES spectroscopic analysis of phosphorus speciation in alum-amended poultry litter, J. Environ. Qual., 37, 477–485, 2008.
Sheldon, R. P.: Ancient marine phosphorites, Annu. Rev. Earth Pl. Sc., 9, 251–284, 1981.
Shober, A. L., Hesterberg, D., Sims, J. T., and Gardner, S.: Charac-terization of phosphorus species in biosolids and manures using XANES spectroscopy, J. Environ. Qual., 35, 1983–1993, 2006.
Slomp, C. P.: Phosphorus cycling in the estuarine and coastal zones: Sources, sinks, and Transformations, in: Treatise on estuarine and coastal science, Vol. 5, edited by: Wolanski, E., McLusky, D. S., Academic Press, Waltham, 201–229, 2011.
Tannazi, F. and Bunker, G.: Determination of chemical speciation by XAFS, Phys. Scripta, 115, 953–956, 2005.
Toor, G. S., Peak, D., and Sims, J. T.: Phosphorus speciation in broiler litter and turkey manure produced from modified diets, J. Environ. Qual., 34, 687–697, 2005.
Toor, G. S., Hunger, S., Peak, D., Sims, J. T., and Sparks, D. L.: Ad-vances in the characterization of phosphorus in organic wastes: Environmental and agronomic applications, Adv. Agron., 89, 1– 72, 2006.
Tribble, J. S., Arvidson, R. S., Lane III, M., and Mackenzie, F. T.: Crystal chemistry, and thermodynamic and kinetic properties of calcite, dolomite, apatite, and biogenic silica: applications to petrologic problems, Sediment. Geol., 95, 11–37, 1995. Van Cappellen, P. and Berner, R. A.: Fluorapatite crystal growth
from modified seawater solutions, Geochim. Cosmochim. Ac., 55, 1219–1234, 1991.