http://dx.doi.org/10.1590/s2175-97902018000217163
Article
*Correspondence: S. Inturi. University College of Pharmaceutical Sciences, Acharya Nagarjuna University, Nagarjuna Nagar, Guntur, Andhra Pradesh -522510. Tel: +91-9949930493. E-mail: [email protected]
A sensitive bioanalytical method development and validation of
cabozantinib in human plasma by LC-ESI-MS/MS
Srikanth Inturi*, Prameela Rani Avula
Department of Pharmaceutical Sciences, University College of Pharmaceutical Sciences, Acharya Nagarjuna University, Guntur
A simple, sensitive and specific liquid chromatography–tandem mass spectrometry (LC-MS/MS) method was developed for the quantification of cabozantinib (CZ) in human plasma using cabozantinib-d4 (CZD4) as an internal standard (IS). Chromatographic separation was performed on Xbridge C18, 50 x 4.6 mm, 5 µm column with an isocratic mobile phase composed of 10mM Ammonium formate and Methanol in the ratio of (20:80 v/v), at a flow-rate of 0.7 mL/min. CZ and CZD4 were detected with proton adducts at m/z 502.2 → 391.1 and 506.3 → 391.2 in multiple reaction monitoring (MRM) positive mode respectively. Liquid-Liquid extraction method was used to extract the drug and IS. The method was validated over a linear concentration range of 5.0-5000.0 pg/mL with correlation coefficient (r2) ≥ 0.9994. This method demonstrated intra and inter-day precision within 1.95 to 2.37 and 2.93 to 9.3 % and Accuracy within 101.4 to 102.4 and 99.5 to 104.8 %. Cabozantinibwas found to be stable throughout freeze-thawing cycles, bench top and postoperative stability studies.
Keywords: Cabozantinib/human plasma/validation. Mass spectrometry. Pharmacokinetic/study.
INTRODUCTION
Tyrosine kinases (TKs) are deemed potential targets for new drug development, especially for cancer and rheumatoid arthritis drugs. Over the last decade, several tyrosine kinase inhibitors (TKIs) have been developed and approved for the treatment of various types of cancer, with each of them targeting specific signaling pathways (Nguyen et al., 2015). Furthermore, more recent advances
have also led to the discovery of the Janus kinases (JAKs) (Tolaney et al., 2016), which by their inhibition introduced
new therapeutic approach for cancer and immunity disorders (Lacy et al., 2015).
Cabozantinib is a small molecule inhibitor of tyrosine kinases including the hepatocyte growth factor receptor (MET) and vascular endothelial growth factor receptor 2 (VEGFR2), which are important mediators of tumor cell survival, metastasis, and tumor angiogenesis (Drilon et al., 2013). In clinical studies, cabozantinib
(Figure1) has demonstrated activity in multiple tumor
types, with responses observed both in soft tissue disease and in bone metastases (Kwilas et al., 2014; Elisei et al., 2013). In 2011, the U.S. FDA approved CZ for the
management of patients with progressive, metastatic medullary thyroid cancer; in 2015 it was also approved by the European Medicines Agency (EMA) for the same use.
S c r e e n i n g o f t h e l i t e r a t u r e d i s c l o s e d f e w published reports for the quantification of cabozantinib concentration in pharmacokinetics of cabozantinib in healthy adult subjects (Kwilas et al., 2014; Elisei et al.,
2013; Choueiri et al., 2014; Zhang et al., 2009; Arora, Scholar, 2005; Walker et al., 2006; O’Shea, Holland,
Staudt, 2013), rat blood with UPLC–MS/MS (Wang et al., 2015), stability indicating LC method by
MS (Wu et al.,2014) in rat plasma by LC-MS (Su et al.,
2015),cabozantinib in dosage form and human plasma via micelle-enhanced spectrofluorimetry (Darwish et al.,
2015), in human plasma and urine by LC-MS/MS (Kadi
et al., 2016).
From the literature review it was concluded that the developed methods shows poor sensitivity, long retention time, lack of deuterated internal standard by using HPLC-ESI-MS/MS. There are very limited methods were reported for estimation of cabozantinib using deuterated internal standard, cabozantinib-d4 (Figure 2) in biological samples.
MATERIAL AND METHODS
Chemicals and reagents
Cabozantinib (CZ) (Cadila Pharmaceuticals, India), Cabozantinib-d4 (CZD4) (Alsachim, France), Ammonium formate and sodium hydroxide (Merck, Mumbai, India), Methanol, ethyl acetate and dichloromethane (J. T. Baker, USA), Ultra pure water (Milli-Q system, Millipore, Bedford, MA, USA), Screened human plasma (navjeevan blood bank, Hyderabad, A.P). The chemicals and solvents were used in this study analytical and HPLC grade.
Instrumentation
The 1200 Series HPLC system (Agilent Technologies, Germany). Mass spectrometric detection was performed on an API 4000 triple quadrupole instrument (ABI-SCIEX, Toronto, Canada) using MRM. Data processing was performed on Analyst 1.4.1 software package (SCIEX).
Detection
Detection was performed by Turbo ion spray (API) positive mode with Unit Resolutionusing MRM positive ion mode with mass transitions of m/z (amu) 502.2→391.1
and 506.3→391.2 for CZ and CZD4. The mass spectra of
parent and product ions of CZ and CZD4.
Chromatographic conditions
Chromatographic separation was performed by Xbridge C18, 50 x 4.6 mm 5 µm analytical column
at 40 °C. 10mM ammonium formate and methanol in the ratio of (20:80 v/v) was used as mobile phase at a flow rate of 0.7 mL/min. Deuterated internal standard cabozantinib-d4 was used as appropriate internal
standard in terms of chromatography and extractability. Cabozantinib and cabozantinib –d4 was eluted at 0.9 ± 0.2 min approximately with a total run time of 3 min for each sample.
Preparation of standards and quality control (QC) samples
Standard stock solutions of cabozantinib (100.0 µg/mL) and cabozantinib-d4 (IS)(100.0 µg/mL) was prepared in methanol. The IS spiking solutions (10.0 ng/mL) were prepared in reconstitution solution (10 mM ammonium formate and methanol in the ratio of (20:80 v/v)) from IS stock solution. Standard stock solutions and IS spiking solutions stored in refrigerator conditions 2 - 8 °C until analysis. Standard stock solutions of cabozantinib (100.0 µg/mL) was added to drug-free screened human plasma to obtain concentration levels of 5.0, 10.0, 200.0, 800.0, 1400.0, 2000.0, 3000.0, 4000.0 and 5000.0 pg/mL for analytical standards and 5.0, 15.0, 2500.0 and 3500.0 pg/mL for Quality control standards and stored in the freezer at -30 °C until analysis. The aqueous standards were prepared in reconstitution solution (10 mM ammonium formate and methanol in the ratio of (20:80 v/v) for validation exercises and stored in the refrigerator at 2-8 °C until analysis.
Sample preparation
Liquid-Liquid extraction method was used to isolate cabozantinib and cabozantinib-d4 from human plasma. For this, 100 µL of cabozantinib-d4 (10 ng/mL) and 400 µL of plasma sample (respective concentration) were added into labeled polypropylene tubes and vortexed briefly about 5 minutes. Followed by, 100 µL of 0. 1N NaOH solution and 3 mL of extraction solvent (ethyl acetate: dichloromethane 80:20v/v) were added and vortexed about10 minutes. Then the samples were centrifuge at 4000 rpm for approximately 5min at an ambient temperature. From this, supernatant sample was transferred into labeled polypropylene tubes and evaporate to dryness at 40 °C briefly, and then reconstituted wih reconstitute solution(10 mM ammonium formate and Methanol in the ratio of (20:80 v/v) , vortexed and transferred the sample into auto sampler vials for injection.
Selectivity and sensitivity
with an additional hemolysed group and lipedimic group to test for interference at the retention times of analytes. The sensitivity was compared with LLOQ of the analyte with its blank plasma sample. The peak area of blank samples should not be more than 20% of the mean peak area of LOQ of cabozantinib and 5% of the mean peak area of cabozantinib-d4.
Precision and accuracy
It was determined by replicate analysis of quality control samples (n = 6) at LLOQ (lower limit of
quantification), LQC (low quality control), MQC (medium quality control), HQC (high quality control) and ULOQ (upper limit of quantification) levels. The % CV should be less than 15%, and accuracy should be within 15% except LLOQ where it should be within 20%.
Matrix effect
The matrix effect due to the plasma matrix was used to evaluate the ion suppression/enhancement in a signal when comparing the absolute response of QC samples after pretreatment (LLE) with the reconstitution samples extracted blank plasma sample spiking with analyte. Experiments were performed at MQC levels in triplicate with six different plasma lots with the acceptable precision (%CV) of ≤ 15%.
Recovery
The extraction recovery of Analyte and IS from human plasma was determined by analyzing quality control samples. Recovery at three concentrations (15.0, 2500.0, and 3500.0 pg/mL) was determined by comparing peak areas obtained from the plasma sample, and the standard solution spiked with the blank plasma residue. A recovery of more than 50 % was considered adequate to obtain required sensitivity.
Stability (freeze - thaw, auto sampler, bench top, long term)
Low quality control and high quality control samples (n=6) were retrieved from the deep freezer after three freeze-thaw cycles according to the clinical protocol. Samples were stored at -30 °C in three cycles of 24, 36 and 48 h. In addition, the long-term stability of CZ in quality control samples was also evaluated by analysis after 105 days of storage at -30 °C. Autosampler stability was studied following 53 h storage period in the autosampler
tray with control concentrations. Room temperature stability was studied for 24.5 h period with control concentrations. Stability samples were processed and extracted along with the freshly spiked calibration curve standards. The precision and accuracy for the stability samples must be within ≤ 15 and ± 15% respectively of their nominal concentrations.
RESULTS AND DISCUSSION
Method development
During method development, different options were evaluated to optimize mass spectrometry detection parameters, chromatography and sample extraction.
Mass spectrometry detection parameters optimization
Electro spray ionization (ESI) provided a maximum response over atmospheric pressure chemical ionization (APCI) mode, and was chosen for this method. The instrument was optimized to obtain sensitivity and signal stability during infusion of the analyte in the continuous flow of mobile phase to electrospray ion source operated at both polarities at a flow rate of 5μL/min. Cabozantinib gave more response in positive ion mode as compare to the negative ion mode. The predominant peaks in the primary ESI spectra of cabozantinib and cabozantinib-d4 corresponds to the [M+H]+ ions at m/z 502.2 and
506.3 (Figure 3). Product ions of cabozantinib and cabozantinib-d4 scanned in quadrupole 3 after a collision with nitrogen in quadrupole 2 had an m/z of 391.1 and 391.2 (Figure 4). Mass parameters were optimised as Source temperature 500 °C, Heater gas 45 (nitrogen) psi, nebulizer gas 30 (nitrogen) psi, Curtain gas 20 (nitrogen) psi, CAD gas 5 (nitrogen) psi, Ion Spray (IS) voltage 5500 volts, Source flow rate 600 µL/min without split, Entrance potential 10 V, Declustering potential 70 V, Collision energy 30 V, Collision cell exit potential 15 V for both Analyte and I.S.
Chromatography optimization
Initially, a mobile phase consisting of ammonium acetate and acetonitrile in varying combinations was tried, but a low response was observed. The mobile phase containing 5mM ammonium formate: acetonitrile (20:80 v/v) and 5mM ammonium formate: methanol (20:80 v/v) gives the better response, but poor peak shape was observed. A mobile phase of 0.1% formic acid in water in combination with methanol and acetonitrile with varying combinations were tried. Using a mobile phase containing 10mM ammonium formate: methanol (20:80 v/v) gave the best signal along with a marked improvement in the peak shape was observed for cabozantinib and cabozantinib-d4. Short length columns, such as Symmetry Shield RP18 (50 x 2.1 mm, 3.5 μm), Inertsil ODS-2V (50 x 4.6 mm, 5μm), Hypurity C18 (50 x 4.6 mm, 5 μm) and Hypurity Advance (50 x 4.0 mm, 5 μm), Xbridge C18, 50x4.6 mm 5 μm were tried during the method development.
Xbridge C18, 50x4.6 mm 5 μm column gave a relatively good peak shape with the best signal was obtained. It gave satisfactory peak shapes for both cabozantinib and cabozantinib-d4. Flow rate of 0.7 mL/min without splitter was utilized and reduced the run time to 2.5 min for both drug and IS were eluted with shorter time at 0.9±0.2 min. For an LC-MS/MS analysis, utilization of stable isotope-labeled or suitable analog drugs as an internal standard proves helpful when a significant matrix effect is possible. In our case, cabozantinib-d4 was found to be best for the present purpose. The column oven temperature was kept at a constant temperature of about 40 °C. Injection volume of 5 µL sample is adjusted for better ionization and chromatography.
Extraction optimization
solution. For this purpose, initially we tested with different extraction procedures like PPT (Protein Precipitation), LLE (Liquid Liquid extraction), and SPE (Solid Phase extraction). We found ion suppression effect in protein precipitation method for drug and internal standard. Further, we tried with SPE and LLE. Out of all we observed LLE is suitable for extraction of drug and IS. We tried with several organic solvents (ethyl acetate, chloroform, n-hexane, dichloro methane and methyl tertiary butyl ether) individually as well with combinations in LLE to extract analyte from the plasma sample. In our case ethyl acetate: dichloromethane (80:20) combination served as good extraction solvent. Auto sampler wash is optimized as 80% methanol. High recovery and selectivity was observed in the Liquid-Liquid extraction method. These optimized detection parameters, chromatographic conditions and extraction procedure resulted in reduced analysis time with accurate and precise detection of cabozantinib in human plasma.
Method validation
A thorough and complete method validation of
cabozantinib in human plasma was done following US FDA guidelines (FDA, 2001). The method was validated for selectivity, sensitivity, matrix effect, linearity, precision and accuracy, recovery and stability.
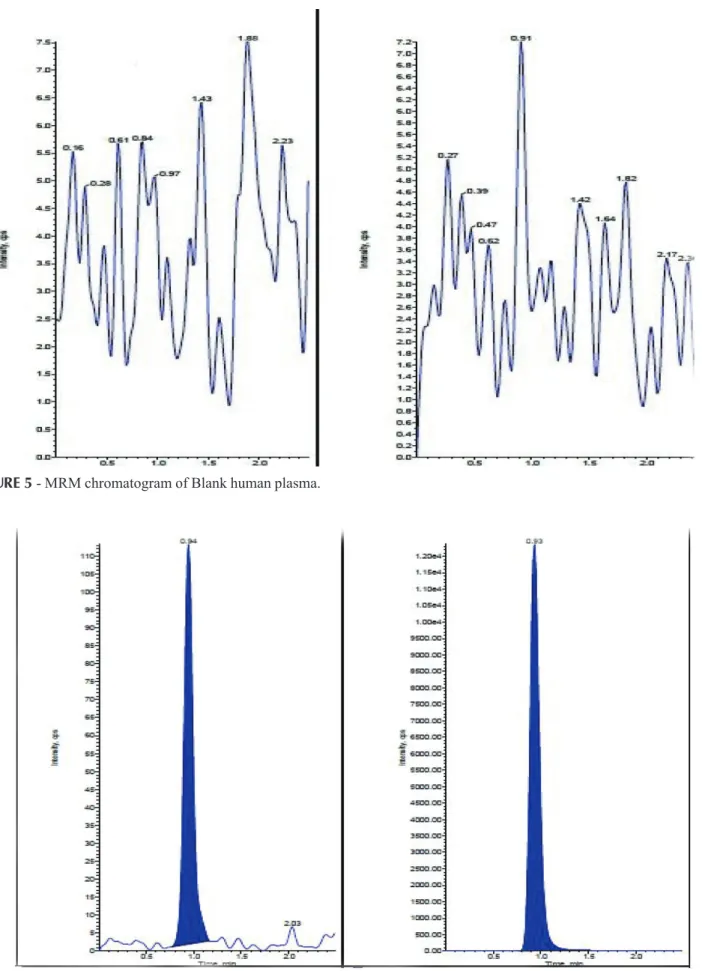
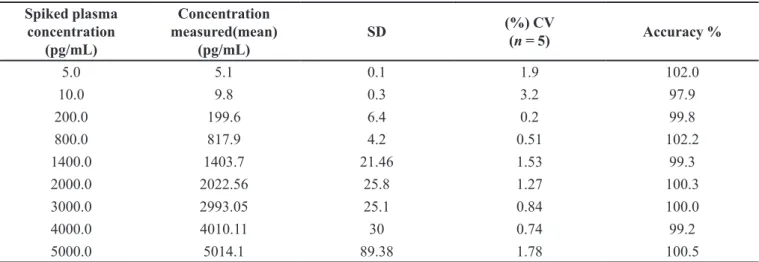
Selectivity and specificity
The analysis of CZ and CZD4 using MRM function was highly selective with no interfering compounds. (Figure 5). Specificity was performed by using six different lots of human plasma. Here showing only blank plasma interference. Chromatograms obtained from plasma spiked with CZ(5.0 pg/mL) and CZD4(10.0 ng/mL) are shown in (Figure 5 and 6).
Matrix effect
The overall precision of the matrix factor is expressed as Coefficient of Variation (CV %) and was determined to be 1.23 for CZ.
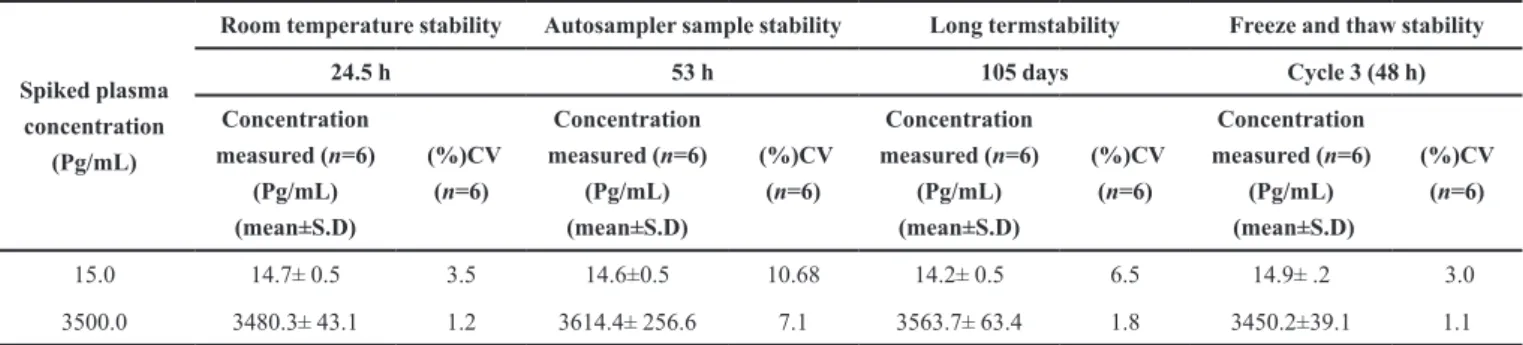
Linearity
Calibration curves were plotted as the peak area ratio (CZ/CZD4) versus (CZ) concentration. Calibration was found to be linear over the concentration range of
FIGURE 5 - MRM chromatogram of Blank human plasma.
5000.0 pg/mL. The % CV was less than 3.21%, and the accuracy ranged from 97.9 to 102.2 %. The determination coefficients (r2) were greater than 0.9994 for all curves
(Table I).
Precision and accuracy
Precision and accuracy for this method were controlled by calculating the intra and inter-batch variations at four concentrations (5.0, 15.0, 2500.0 and 3500.0 pg/mL) of QC samples in six replicates. As shown in (Table II), the intra-batch % CV was less than 2.37% and the accuracy ranged from 101.4 to 102.4%. Inter-batch % CV was less than 9.3% and the accuracy ranged from 99.5 to 104.8%. These results indicate the adequate reliability and reproducibility of this method within the analytical range.
Recovery
The recovery following the sample preparation using Liquid-Liquid extraction method was calculated by comparing the peak area ratios of CZ in plasma samples
with the peak area ratios of solvent samples and was estimated at control levels of CZ. The recovery of CZ was determined at three different concentrations 15.0, 2500.0 and 3500.0 pg/mL, were found to be 89.70, 90.2 and 91.2%, respectively. The overall average recovery of CZ and CZD4 was found to be 90.3 and 92.5% respectively.
Limit of quantification (LOQ) and limit of detection (LOD)
The limit of quantification was determined at 5 pg/mL. The limit of detection was determined at 50 pg/10 μL injection volume.
Stability (freeze-thaw, auto sampler, bench top, long term)
Quantification of the CZ in plasma subjected to 3 freeze-thaw (-30 °C to room temperature) cycles showed the stability of the analyte. No significant degradation of the CZ was observed even after 53 h storage period in the autosampler tray and the %
TABLE I - Calibration curve details from one batch of the validation section
Spiked plasma concentration
(pg/mL)
Concentration measured(mean)
(pg/mL)
SD (%) CV
(n = 5) Accuracy %
5.0 5.1 0.1 1.9 102.0
10.0 9.8 0.3 3.2 97.9
200.0 199.6 6.4 0.2 99.8
800.0 817.9 4.2 0.51 102.2
1400.0 1403.7 21.46 1.53 99.3
2000.0 2022.56 25.8 1.27 100.3
3000.0 2993.05 25.1 0.84 100.0
4000.0 4010.11 30 0.74 99.2
5000.0 5014.1 89.38 1.78 100.5
TABLE II - Precision and accuracy (analysis with spiked plasma samples at four different concentrations)
Spiked plasma concentration
(pg/mL)
Within-run Between-run
Concentration measured (n=6) (pg/mL) (Mean ± S.D.)
(%)CV Accuracy %
Concentration measured (n=30) (pg/mL)
(Mean ± S.D.)
(%)CV Accuracy %
5.0 5.12±0.1 2.22 102.43 5.24±0.1 9.30 104.8
15.0 15.28±0.3 2.37 101.9 14.92±0.3 7.66 99.5
2500.0 2535±21.4 2.04 101.45 2495.2±25.1 2.93 99.8
accuracy of CZ was between 97.18 to 103.27% of the theoretical values. Room temperature stability at 24.5 h was between 98.0 to 99.4% of the theoretical values. In addition, the long-term stability of CZ in QC samples after 105 days of storage at -30°C was also evaluated. The % accuracy ranged from 99.7 to 101.82% of the theoretical values. These results confirmed the stability of CZ in human plasma for at least 105 days at -30°C (Table III).
CONCLUSION
The proposed method was five folds higher sensitive than the reported method and analyte was compared with deuterated internal standard. The method described here is fast (requires less than 2.5 min of analysis time), rugged, reproducible bioanalytical method. The developed method is simple and efficient and can be used in pharmacokinetics studies as well as in the monitoring of the investigated analyte in bodyfluids.
ACKNOWLEDGEMENTS
Authors wish to thank the support received (for providing Literature survey) from IICT (Indian institute of chemical technology) Hyderabad India., APL Research Centre Pvt. Ltd (Hyderabad) India to carry out this Research work.
REFERENCES
Arora A, Scholar EM. Role of tyrosine kinase inhibitors in cancer therapy. J Pharmacol Expl Ther. 2005;315(3):971-979.
Choueiri TK, Pal SK, McDermott DF, Morrissey S, Ferguson KC, Holland J, et al. A phase I study of cabozantinib (XL184) in patients with renal cell cancer. Ann Oncol. 2014;25(8):1603-1608.
Darwish HW, Abdelhameed AS, Bakheit AH, Alanazi AM. A new method to determine the new C-Met inhibitor cabozantinib
in dosage form and human plasma via micelle-enhanced
spectrofluorimetry. RSC Adv. 2015;51(5):40455-41316.
Drilon A, Wang L, Hasanovic A, Suehara Y, Lipson D, Stephens P, et al. Response to cabozantinib in patients with RETFusion-positive lung adenocarcinomas. Cancer Discov. 2013;3(6):630-635.
Elisei R, Schlumberger MJ, Muller SP, Schoffski P, Brose MS, Shah MH. Cabozantinib in progressive medullary thyroid cancer. J Clinical Oncol. 2013;31(29):3639-3646.
Food and Drug Administration. FDA. Guidance for industry: bioanalytical method validation. Rockville, MD: U.S. Department of Health and Human Services, Center for Drug Evaluation and Research (CDER), Center for Biologics Evaluation and Research (CBER); May 2001.
Kadi AA, Abdelhameed AS, Darwish HW, Attwa MW, Bakheit AH. Liquid chromatographic-tandem mass spectrometric assay for simultaneous quantitation of tofacitinib, cabozantinib and afatinib in human plasma and urine. Trop J Pharm Res. 2016;15(12):2683-2692.
Kwilas AR, Ardiani A, Donahue RN, Aftab DT, Hodge JW. Dual effects of a targeted small-molecule inhibitor (cabozantinib)
on immune-mediated killing of tumor cells and immune tumor
microenvironment permissiveness when combined with a cancer vaccine. J Translational Med. 2014;12:294.
Lacy S, Hsu B, Miles D, Aftab D, Wang R, Nguyen L. Metabolism and disposition of cabozantinib in healthy male volunteers and pharmacologic characterization of its major metabolites. Drug Metab Dispos. 2015;43(8):1190-1207. TABLE III - Stability of the samples
Spiked plasma concentration
(Pg/mL)
Room temperature stability Autosampler sample stability Long termstability Freeze and thaw stability
24.5 h 53 h 105 days Cycle 3 (48 h)
Concentration measured (n=6)
(Pg/mL) (mean±S.D)
(%)CV (n=6)
Concentration measured (n=6)
(Pg/mL) (mean±S.D)
(%)CV (n=6)
Concentration measured (n=6)
(Pg/mL) (mean±S.D)
(%)CV (n=6)
Concentration measured (n=6)
(Pg/mL) (mean±S.D)
(%)CV (n=6)
15.0 14.7± 0.5 3.5 14.6±0.5 10.68 14.2± 0.5 6.5 14.9± .2 3.0
A sensitive bioanalytical method development and validation of cabozantinib in human plasma by LC-ESI-MS/MS
Nguyen L, Holland J, Mamelok R, Laberge MK, Grenier J, Swearingen D, et al. Evaluation of the effect of food and gastric pH on the single-dose pharmacokinetics of cabozantinib in healthy adult subjects. J Clin. Pharmacol.
2015;55(11):1293-1302.
O’Shea JJ, Holland SM, Staudt LM. JAKs and STATs in immunity, immunodeficiency, and cancer. New Engl JMedicin. 2013;368(2):161-170.
Su Q, Li J, Ji X, Li J, Zhou T, Lu W, Li L. An LC-MS/MS method
for the quantitation of cabozantinib in rat plasma: application to a pharmacokinetic study. J Chromatogr B Analyt Technol Biomed Life Sci. 2015;985:119-23.
Tolaney SM, Nechushtan H, Ron IG, Schöffski P, Awada A, Yasenchak CA, et al. Cabozantinib for metastatic breast carcinoma: results of a phase II placebo-controlled randomized discontinuation study. Breast Cancer Res Treat. 2016;160(2):305-312.
Walker JG, Ahern MJ, Coleman M, Weedon H,Papangelis V, Beroukas D, Roberts-Thomson PJ, Smith MD. Changes in synovial tissue Jak-STAT expression in rheumatoid arthritis in response to successful DMARD treatment. Ann Rheum Dis. 2006;65(12):1558-1564.
Wang X, Wang S, Lin F, Zhang Q, Chen H, Wang X, et al. Pharmacokinetics and tissue distribution model of cabozantinib in rat determined by UPLC–MS/MS. J Chromatogr B Analyt Tech Biomed Life Sci. 2015;1:125-131.
Wu C, Xu X, Feng C, Shi Y, Liu W, Zhu X, Zhang J. Degradation
kinetics study of cabozantinib by a novel stability-indicating LC method and identification of its major degradation products by LC/TOF-MS and LC-MS/MS. J Pharm Biomed Anal. 2014;98:356-63.
Zhang J, Yang PL, Gray NS. Targeting cancer with small molecule kinase inhibitors. Nat Rev Cancer. 2009;9(1):28-39.