THE CRYSTALLIZATION OF POTASSIUM GERMANATE GLASS
WITH HIGH CONTENT OF NIOBIUM OXIDE
SRĐAN D.MATIJAŠEVIĆ, #MIHAJLO B.TOŠIĆ, JOVICA N. STOJANOVIĆ, SNEŽANA R.GRUJIĆ*, VLADIMIR D.ŽIVANOVIĆ, JELENA D.NIKOLIĆ, MARIJA S.ĐOŠIĆ
Institute for Technology of Nuclear and Оther Mineral Raw Materials, 86 Franchet d’ Esperey St., 11000 Belgrade, Serbia
*Faculty of Technology and Metallurgy, University of Belgrade, 4 Karnegijeva St., 11000 Belgrade, Serbia
#E-mail: [email protected]
Submitted July 11, 2011; accepted November 4, 2011
Keywords: Germanate glass, Niobium oxide, Crystallization
Potassium germanate glass with molar ratio [GeO2]/[K2O] = 1.2 and Nb2O5 content of 34 mol% have been synthesized by a melt-quenching method. The crystallization behavior under non-isothermal and isothermal crystallization conditions was investigated. The results showed that this glass exposed complex primary crystallization. In the temperature range < 800 °C primary phase is K3.8Nb5Ge3O20.4, while K6Nb6Ge4O26 appeared as primary phase at temperatures > 800 °C. K10Nb22Ge4O68 and metastable KNbO3 and K4Nb6O17 were formed as secondary phases. The crystallization commenced at T > 640 °C with high homogeneous nucleation rate and spherulite crystal growth morphology. DTA curves recorded for powder samples particle size < 0.1 mm revealed three exothermic peaks and three endothermic peaks within temperature range of T = 640-940 °C, while the DTA curves recorded for powder samples particle size > 0.1 mm showed two exothermic peaks and two endothermic peaks within temperature range of T = 640-1020 °C. The analysis of the dominant crystallization mechanism of powder glass sample and kinetics of crystallization is presented.
INTRODUCTION
Glass-ceramics with second-order optical non-li-nearity are of great scientiic and technical interest [1,2]. Nanocrystallization of glasses is an effective method for the fabrication of such materials. It has recently been reported that crystallized glasses in the system of K2O–Nb2O5–GeO2 show nanocrystallization [3,4,5].
Transition metal ions with an empty d shell, such as Nb5+, contribute to the increase of nonlinear indexes in
iono-covalent insulating materials [6]. In the structure of the majority of niobium containing crystal is formed by [NbO6] octahedra with a different degree of distortion,
whereas structures characterized by [NbO4] tetrahedral
are rare since the Nb5+ ion is too large to it into an
oxygen-anion tetrahedral [7]. In potassium germanate glass compositions, it was suggested that, the emergence of the octahedral units depends on the GeO2/K2O molar
ratio and it occurs for Nb2O5 contents >15 mol% [8].
The aim of the present study is a more detailed investigation of the crystallization behavior of potassium niobium germanate glass with ratio GeO2/K2O = 1.2 and
high content of 34 mol% Nb2O5. The investigations
were performed under non-isothermal and isothermal crystallization conditions.
EXPERIMENTAL
The glass was prepared by melting a homogeneous mixture of reagent-grade K2CO3, Nb2O5 and GeO2 in
a platinum crucible. The melting was performed in an electric furnace BLF 17/3 at T=1200 °C during t=1 h. The melt was cast and cooled between two steel plates. Powder X-ray diffraction (XRD) analysis conirmed the quenched melts to be vitreous. The samples were transparent, without visible residual gas bubbles.
The chemical composition of the glass was deter-mined using AAS – PERKIN ELMER 300 and JENA SPEKOL 1300 spectrophotometers.
The experiments under non-isothermal conditions were performed using a Netzsch STA 409 EP device and Al2O3 powder as the reference material. Powder
samples of the following granulations were prepared: <0.037;0.037-0.048; 0.048-0.063; 0.063-0,1; 0.1-0.2; 0.2-0.3; 0.3-0.4; 0.4-0.5; 0.5-0.65; 0.65-0.83 and 0.83-1.0 mm. In the experiments, a constant weight (100 mg) of the samples was heated at heating rate
The experiments with bulk glass samples were performed in a one-stage regime. The samples were heated at heating rate β = 10°C/min up to the chosen temperature in the range of T = 630-900°C at which they were maintained over different periods of time in an electric furnace Carbolite CWF 13/13, with automatic regulation and temperature accuracy of ± 1°C. Finally, the samples were removed from the furnace and then crushed into an agate mortar. Powdered samples were used for X-ray and fractured ones for SEM analyses.
The XRD method was used to determine the phase composition. The XRD patterns were obtained using a Philips PW-1710 automated diffractometer with a Cu tube operated at 40 kV and 30 mA. The instrument was equipped with a diffracted beam curved graphite monochromator and a Xe-illed proportional counter. The diffraction data were collected in the 2q Bragg angle range from 5 to 70°, counting for 0.50 s (qualitative identiication) and from 10 to 110° for 4 s (quantitative phase analysis-Rietveld method) at every 0.02° step. The divergence and receiving slits were ixed to 1 and 0.1, respectively. All the XRD measurements were performed at room temperature in a stationary sample holder. The LSUCRIPC program was used for the reinement of the cell dimensions from the powder data [9-13]. The quantitative amounts of the crystalline phases in the sample were determined using the full structure matching mode of the Rietveld reinement method [14], using the MAUD program [15].
A Jeol JSM 5800 SC microscope was used for the SEM investigations, and the fractured bulk samples previously sputtered with gold were used.
RESULTS AND DISCUSSION
The results of the chemical analyses of the glass are presented in Table 1. Nominal composition is also given for the purpose of comparison.
As presented in Table 1, the glass composition is close to the nominal with the ratio of GeO2/ Nb2O5 = 1.07.
The structure of this glass can be described as a mixed network formed by GeO4 tetrahedra and NbO6 octahedra.
The K+ions are preferentially located close to the NbO 6
octahedra, thus compensating the excessive negative charges [8].
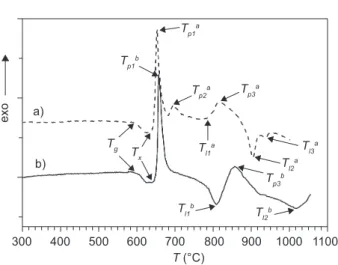
Figure 1 shows the DTA curves for the samples with particle sizes of <0.048 and 0.5-0.65 mm recorded at heating rate β = 10°C/min in the temperature range of 20-1050°C.
The DTA curves showed in Figure 1 are complex. The glass transition temperature, Tg and the irst crys-tallization onset temperature Tx are easy revealed. The difference between the Tp1-Tg ~62°C indicated that this glass is less thermally stable. On the curve a the noticeable peaks are: (i) three exothermic peaks (Tp1a, Tp2a,Tp3a) and
(ii) three endothermic peaks (Tl1a, Tl2a, Tl3a). On the curve
b the noticeable peaks are: (i) two exothermic peaks (Tp1b, Tp3b) and (ii) two endothermic peaks (Tl1b, Tl2b,). All
peaks on the curve b shift toward higher temperatures. These results clearly manifested a signiicant inluence of the particle sizes of powder samples on crystalliza-tion behavior of glass. Such behavior also indicates the formation of different crystalline phases during the crystallization. The signiicant temperatures for the DTA curves recorded (Figure 1) are presented in Table 2.
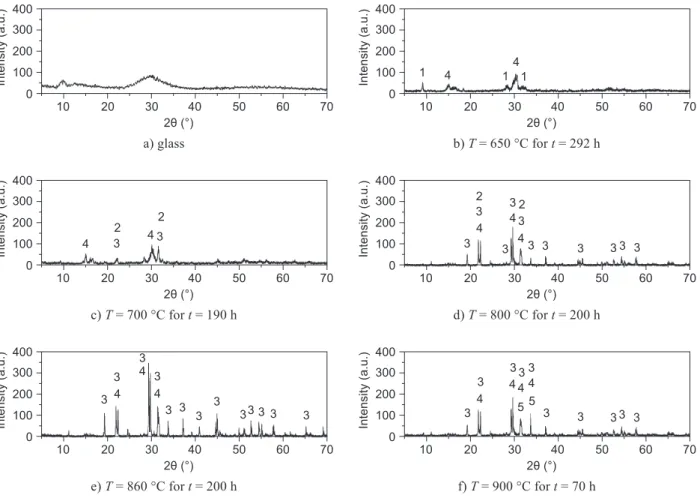
The experiments on bulk samples under isothermal conditions were performed in order to identify the formed crystal phases. In one-step regime, the samples were heated at T = 630-900°C for different periods of time. Figure 2 shows the XRD patterns of the glass samples crystallized at different temperatures.
Figure 2 demonstrates that several crystalline phases appeared, which clearly indicates a complex primary crys-tallization of this glass. The phase present in the largest amount crystallizes as the primary one. The others appear as secondary phases. According to the results of XRD, the crystallization of this glass commences by formation Table 2. The signiicant temperatures on DTA curves recorded at heating rate of 10°C/min for powder samples of particle size
a) < 0.048 and b) 0.5-0.65 mm.
DTA (°C)
curve Tg Tx Tp1 Tp2 Tp3 Tl1 Tl2 Tl3
a 591 639 654 695 816 782 904 937
b 595 643 657 – 856 808 1018 –
Table 1. Chemical analysis of the glass.
Oxide , xi (mol%)
K2O Nb2O5 GeO2
Nominal 30 34 36
Analyzed 30.22 33.64 36.14
Figure 1. DTA curves recorded at a heating rate of 10 °C/min for powder samples: a) <0.048 and b) 0.5-0.65 mm.
300 500
b) a)
T (°C) Tg T
x
Tl1 b
Tl2 b
Tl1 a
Tl2a
Tl3 a
Tp3 a
Tp2a
Tp1a
Tp1 b
Tp3b
e
x
o
700 900 1100
of three crystalline phases: K3.8Nb5Ge3O20.4 as primary
and K4Nb6O17 and K6Nb6Ge4O26 as secondary ones
(Figu-re 2b - peak 1 on the DTA curves from Figure 1). At temperature of crystallization T = 700°C (Figure 2c), the K3.8Nb5Ge3O20.4 is also present as primary phase, and
K6Nb6Ge4O26, K4Nb6O17 and KNbO3 as secondary ones.
At this temperature, the content of K4Nb6O17 is smaller
than at T = 650°C, while the content of K6Nb6Ge4O26
is increased. As a new secondary phase, the KNbO3
appeared. On the DTA curve (Figure 1a), in the vicinity of this temperature one smallest peak 2 is observed, which could be related to the appearance of the new KNbO3
phase. However, the peak 2 appeared only on the DTA curves recorded for the samples particle size < 0.1 mm. On the DTA curves recorded for the samples particle size > 0.1 mm, the peak 2 does not appear. This indicates that the new phase KNbO3 wasformed rapidly by the surface
crystallization mechanism, whereby its contribution to the whole DTA signal inluenced the appearance of peak 2. By increasing the glass particle size, the contribution of formation of this phase to the whole DTA signal de-creases and the peak 2 is not visible. At crystallization temperature T = 800 °C (Figure 2d), K6Nb6Ge4O26 is
present as the primary phase, and K3.8Nb5Ge3O20.4 and
KNbO3 as the secondary ones. The phase K4Nb6O17 did
not appear. On both DTA curves (Figure 1a and 1b), in the vicinity of this temperature, one endothermal peak Tl1 appeared which is more visible on the curve b. It can be concluded that this peak represents melting of the K4Nb6O17 phase. At crystallization temperature
T = 860°C (Figure 2e), the primary phase is K6Nb6Ge4O26,
and the present secondary ones are: K3.8Nb5Ge3O20.4,
K10Nb22Ge4O68 and KNbO3. K10Nb22Ge4O68 appeared as
a new secondary phase. On the DTA curves (Figure 1a and 1b), in the vicinity of this temperature the appea-rance of the exothermal peak 3 was noted that could be related to the formation of a new K10Nb22Ge4O68 phase.
At crystallization temperature T = 900°C (Figure 2f), K6Nb6Ge4O26 is the primary phase too, and K3.8Nb5Ge3O20.4
and K10Nb22Ge4O68 as secondary ones are present. At this
temperature the phase KNbO3 is not present. On the DTA
curves (Figure 1a and 1b), above this temperature one endothermal peak Tl2 is visible, and it may be concluded that this peak shows melting of the KNbO3 phase.
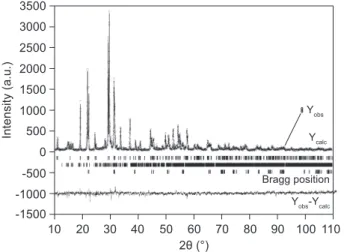
The quantitative fractions of the crystalline phases were determined at the sample annealed at Tc = 800°C
for tc = 200 h. The XRD pattern of this sample was
recorded in the 2θ range 10-110°, with a step of 0.02°
d) T = 800 °C for t = 200 h b) T = 650 °C for t = 292 h
f) T = 900 °C for t = 70 h c) T = 700 °C for t = 190 h
a) glass
e) T = 860 °C for t = 200 h
Figure 2. 3D XRD patterns of: a) glass and glass samples annealed at b) T = 650 °C for t = 292 h, c) T = 700 °C for t =190 h, d) T = 800 °C for t =200 h, e) T =860 °C for t = 200 h and f) T = 900 °C for t = 70 h. Peaks marked: 1 - K4Nb6O17 - JCPDS 53-0780 [9], 2 - KNbO3 - JCPDS 71-2171 [10], 3 - K6Nb6Ge4O26 - JCPDS 83-2086 [11], 4 - K3.8Nb5Ge3O20.4 - JCPDS 77-0963 [12] and 5 - K10Nb22Ge4O68 - JCPDS [13].
4 4 4 3 3 3 3
3 3 3 3 3 3
3 2 2 10 0 100 200 300 400 20 2θ (°) In te n s it y ( a .u .)
30 40 50 60 70
10
1 4 1 1
4 0 100 200 300 400 20 2θ (°) In te n s it y ( a .u .)
30 40 50 60 70
4 4 4 4
55
3
3 3 3 3
3 3 3 3 3
10 0 100 200 300 400 20 2θ (°) In te n s it y ( a .u .)
30 40 50 60 70
4 3 43
2 2 10 0 100 200 300 400 20 2θ (°) In te n s it y ( a .u .)
30 40 50 60 70
10 0 100 200 300 400 20 2θ (°) In te n s it y ( a .u .)
30 40 50 60 70
4 4 4 3 3 3 3
3 3 3 3 3 3 3 3 3
10 0 100 200 300 400 20 2θ (°) In te n s it y ( a .u .)
and a time of 4 s. A Rietveld proile matching mode itting plot of this sample is presented in Figure 3, while the results of the itting are shown in Table 3. The results show that this undercooled melt crystallized into a three component glass-ceramic, with K6Nb6Ge4O26 as the
primary phase, and K3.8Nb5Ge3O20.4 and KNbO3 as the
secondary ones. The calculated unit cell dimensions were compared to the literature data and no divergence of any kind was registered [14,15]. Table 3 demonstrates that the crystals of all three phases are nanosize, while the smallest ones are those of K3.8Nb5Ge3O20.4 (52.1 nm).
The undercooled melts generally crystallize by either surface or volume mechanism. Although these crystallization mechanisms can occur simultaneously and competitively, one mechanism usually dominates. The one of the procedure convenient for evaluating the dominant crystallization mechanism of glass powder is Differential thermal analysis (DTA) [16]. Experimental and theoretical studies have shown that the particle size of glass powder inluences the mechanism of its crystallization [17-19]. The parameters of Tp2/(ΔT)p and
(dT)p show the dependency on particle size and can be
used as qualitative measures by polymorphic and primary surface and volume crystallization. The ratio Tp2/(ΔT)p,
where Tp is the DTA peak temperature and (ΔT)p is the
half-width of the DTA peak, is related to the dimension of crystal growth and the height of the exothermal DTA
peak (dT)p is proportional to total number of nuclei (volume
and surface) contained in the glass particle. If surface and volume crystallization proceed simultaneously, three distinct regions can be distinguished as a function of particle size. They relect the behavior arising from decreasing of surface-to-volume ratio with the increase of particle size.
To determine the dominant crystallization mecha-nism of this glass, DTA curves of glass powder samples of particle sizes 0-1 mm were recorded at a heating rate of β = 10°C/min.
The effects of particle size on the exothermal DTA peak temperatures, Tp, are presented in Figure 4.
It demonstrates that both Tp1 and Tp3 increase with the
increase of particle size of glass sample. Such beha-vior also indicates an increase in the resistance to crystallization of this glass.
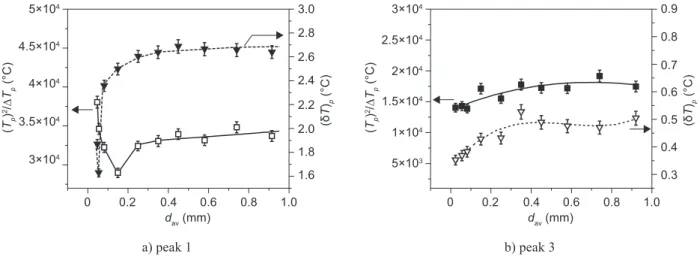
The results of the inluence of particle size on the ratio Tp2/(ΔT)p and DTA peak height (dT)p for peak 1 and
3 are shown in Figure 5. As observed from Figure 5a for peak 1, complex curves with three distinguishable regions were obtained. For average particle size < 0.050 mm, the ratio Tp2/(ΔT)p and the DTA exothermal peak
height (dT)p decrease with the increase of particle size.
The behavior of these parameters is in accordance with theoretical predictions for the case of the predominant surface mechanism of crystallization [18]. In that case
Figure 3. Rietveld reinement plot of the glass sample annealed
at: T = 800 °C for t = 200 h. Figure 4. The effect of particle sizes on the exothermal DTA peak temperatures. 10
-1500 -500 500 1500 2500 3500
-1000 0 1000 2000 3000
30
2θ (°)
Bragg position
Yobs-Ycalc
Yobs
Ycalc
In
te
n
s
it
y
(
a
.u
.)
50 70 90 110
20 40 60 80 100 0
640 680 720 760 800 840 880
660 700 740 780 820 860
0.2
dav (mm) Tp
(
°C
)
0.4 0.6 0.8 1.0
0.1 0.3 0.5 0.7
Tp1
Tp2
Tp2
0.9
Table 3. The most important crystallographic parameters for crystalline phases, obtained from Rietveld reinement of XRD pattern.
Reliability factors (%) Unit cell parameters Quantitative fraction (%) Microstructure
Rwp Rb Rp a (Å) b (Å) c (Å) Vol. Wt. Size (Å) Microstrain
14.66 11.15 9.71
Phase
K6Nb6Ge4O26 9.190(2) 9.190(2) 8.132(2) 64.63 64.40 7586 2.01×10⁻⁴
K3.8Nb5(Ge3O9)O11.4 7.005(2) 7.005(2) 12.387(4) 22.113(6) 23.07 22.04 521 6.40×10⁻⁴
the surface nuclei dominate in the total number of nuclei. The ratio of particle surface to volume decreases with the increase of particle size, as does the number of surface nuclei, i.e., the total number of nuclei. It occurs in case of this glass and only in a narrow particle size interval (smallest particle size). In the range of 0.05-0.15 mm, both curves display minima. In that case the number of surface nuclei is reduced to such an extent that it is equalized with the number of volume nuclei and the total number of the present nuclei is the smallest. In the range of 0.15-0.35 mm both parameters increase to asymptotic values. The ratio of volume to surface in this case grows with the increase of particle sizes too, i.e. the number of volume nuclei increases related to the number of surface nuclei. In the size range >0.35 mm both parameters remain approximately constant. In this sizes range the number of volume nuclei dominates in the total number of nuclei, so that the volume crystallization mechanism prevails. When the number of volume nuclei becomes dominant, further increase of particle size does not signiicantly inluence the change in volume nuclei or the total number of nuclei.
Figure 5b shows a change of parameters Tp2/(ΔT)p
and (dT)p with the particle sizes for the DTA peak 3. It
demonstrates that curves of similar shape were obtained. However, peak 3 is signiicantly smaller in height and width, and according to that the determination of the parameters Tp2/(ΔT)p and (dT)p are less reliable. In the
temperature range of peak 3, the sample is already crystallized. The formation of new phase on peak 3 occurs by transformation of the existing phases, the ones present in the whole volume of the sample. The curves in Figure 5b show that both parameters Tp2/(ΔT) p and (dT)p increase with the increase of particle size up
to 0.35 mm, and then for particle size >0.35 mm both parameters remain approximately constant. These results lead to conclusion that in the temperature range of peak 3 in the particle size range of <0.35 mm the surface and volume crystallization proceed simultaneously. Volume
crystallization mechanism prevails in case of particle size >0.35 mm. The surface crystallization mechanism is not dominant on the DTA peak 3.
The experiments with bulk samples under isothermal conditions were performed (Table 4) in order to check this behavior.
The samples annealed for long periods of time were used for XRD analysis (Figures 2 and 3). At the temperatures of crystallization Tc> 650°C, the samples
become opaque after short periods of thermal treatment, so that it was impossible to deine the crystallization mechanism (surface or volume). The samples annealed for shorter periods of time at T = 630 and 650°C were used for analysis of crystallization mechanism and deter-mination of nucleation rate. The SEM micrographs of the interior surface of sample thermally treated in one-stage regime at T = 630 and 650°C are shown in Figure 6.
SEM micrograph in Figure 6a shows the spheri-cal-shaped crystals measuring from 20 to 100 nm in diameter. The density of crystals increased with the increase of temperature and the duration of thermal treatment (Figure 6b). In Figure 6c the microstructure of the interior surface of the sample thermally treated at T = 800°C for t = 200 h is shown. The XRD pattern of this sample is presented in Figure 2d, showing that K6Nb6Ge4O26 as primary phase and K3.8Nb5Ge3O20.4 and
Figure 5. Effect of particle size on the ratio Tp2/(ΔT)p and the DTA exothermal peak height (δT)p.
a) peak 1 b) peak 3
0 3.5×10⁴
4×10⁴ 5×10⁴
4.5×10⁴
3×10⁴
0.2
dav (mm)
(
Tp
)
2/∆
Tp
(
°C
)
1.6 2.2 2.4 2.6 2.8
2.0 3.0
1.8
(δ
T
)p
(
°C
)
0.4 0.6 0.8 1.0 0
5×10³
1.5×10⁴
2×10⁴
3×10⁴
2.5×10⁴
1×10⁴
0.2
dav (mm)
(
Tp
)
2/∆
Tp
(
°C
)
0.3 0.6 0.7 0.8 0.9
0.5
0.4
(δ
T
)p
(
°C
)
0.4 0.6 0.8 1.0
Table 4. Heat treatments condition.
Tc (°C) tc (h)
630 1; 3; 5; 360
650 1; 2; 2.5; 3; 5; 24; 292
700 190
800 200
860 200
KNbO3 as secondary ones. These results indicate that
these phases in glass are formed by volume crystallization mechanism with spherulite crystal growth morphology.
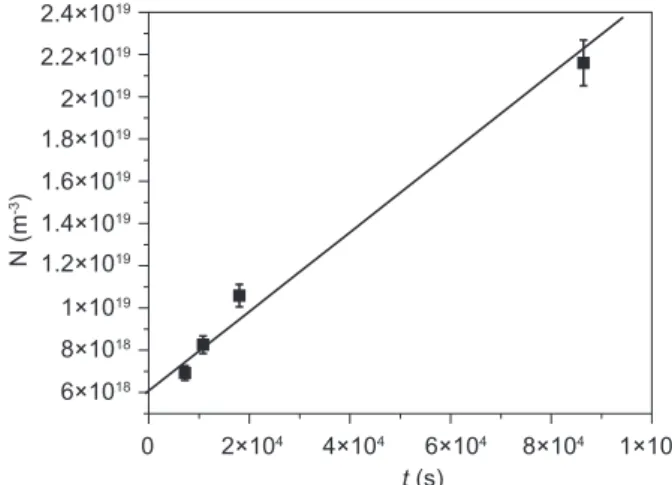
The results of SEM investigation were used for analysis of nucleation rate in this glass at T=650 °C. The
number of particles per unit area, NA,and the diameters of the circular intersections of the particles were deter-mined from the SEM micrographs. The number of par-ticles per unit volume, NV, was determined from the ratio of NA and the largest circular cross-section diameter, d, [20]. The nucleation rate, I = 1.77×10¹⁴ m-3 s-1, at the
treatment temperature, T = 650 ° C, was determined from the time dependence of the number of particles (spherulites) per unit volume, NV , (Figure 7). The results showing that the number of particles per unit area, NA, can be measured directly after a single-stage heat treatment at T = 650°C, and indicate that the crystal growth rates in the temperature interval of nucleation have considerable values. Consequently, the temperature interval of nu-cleation and crystal growth overlapped. This was indi-cated byvicinity of the temperatures Tg and Tp1 on DTA
curves, Figure 1.
The above presented results suggest that the crystallization process of this glass is very complex. For this reasons, the analysis of the crystallization kinetics is not simple. Non-isothermal methods are convenient, require small sample masses and are relatively easy to perform. However, the majority of the non-isothermal methods has been criticized for assuming an Arrhenian temperature dependence of the transformation kinetics and hence do not have general validity [21,22]. The temperature dependence of the nucleation rate, I, is far from Arrhenian, and the temperature dependence of the crystal growth rate, U, is also not Arrhenian when a broad range of temperatures is considered. This makes the calculated kinetic parameters reliable in certain controlled cases [23]. Within a suficiently limited temperature range (such as the range of crystallization peaks in DTA), both I and U can be described by the approximations:
I = Io× exp(-EN/RT) (1)
and
U = Uo× exp(-EG/RT) (2)
where EN and EG are the effective activation energies
for nucleation and crystal growth, respectively. In case of isothermal crystallization with I and U independent of time, t, the volume fraction crystallized, x, is obtained by the the Kolmogorov-Avrami equation [24-26]:
x = 1 - exp[-(Kt)n] (3)
where n is the Avrami exponent, which is a dimensionless constant related to the nucleation and growth mechanisms. The K is deined as the reaction rate constant, which is usually assigned an Arrhenian temperature dependence:
K = Ko × exp(-E/RT) (4) where E is the effective activation energy describing the overall crystallization process. In Eq. (3) Kn≈ I×Um,
where m denotes the dimensionality of crystal growth. Hence, the assumption of an Arrhenian temperature Figure 6. SEM micrographs of glass samples annealed at:
a) T = 630 °C for t = 5 h, b) T = 650 °C for t = 24 h, c) T = = 800 °C for t = 200 h.
c) T = 800 °C for t = 200 h b) T = 650 °C for t = 24 h
dependence for K is appropriate when I and U vary in an Arrhenian manner with T. From Equations (1) - (4), the overall effective activation energy for crystallization is expressed as [27]:
E ≈ (EN +m EG)/n (5) This assumption holds under following conditions: The nucleation rate is negligible, i.e. the condition of site saturation. The occurrence of site saturation in crystal nucleation enables the complicated temperature dependence of the nucleation rate to be neglected and if the temperature dependence of the crystal growth rate is dominated by that of the viscosity, the reaction rate coeficient, K, can reasonably be approximated as Arrhenian over a temperature range around the temperature of the crystallization peak. This condition allows the crystallization process to be considered as an isokinetic reaction, i.e. the crystallization rate is dependent only on temperature and not on the previous thermal history.
The previous results showed that in the range of the smallest granulation, of the total number of nuclei present, the number of surface nuclei was dominant with respect to the internal ones. Therefore the number of nuclei does not signiicantly change with heating, while the crystal growth rate becomes considerable. Moreover, the results of SEM investigations under isothermal conditions indicated spherulite crystal growth morphology. Such a morphology is associated with continuous growth by the screw dislocation mechanism and interface controlled kinetics of crystal growth. For this case Matusita and Saka [28,29] derived the equation for the analysis of non-isothermal crystallization as:
(6) where R is the gas constant. The values of parameters n
and m depend on the rate controlling mechanism of the
crystallization kinetics, while the value of Eais obtained from the ratio ln(β n/T
p2) vs. 1/Tp using the corresponding
values for n and m. Accordingly, to satisfy the condition of the constant number of nuclei during crystal growth, the glass powder with smallest particle size of < 0.037 mm was chosen. Since the crystal growth in these DTA experiments occurred on a constant number of nuclei,
n = m = 1 (surface crystallization) and Equation (6) becomes the same as the well-known Kissinger equation [30]. For the analysis of the crystallization kinetics, the
Tp1 temperatures recorded for the powder samples of particle size < 0.037 mm at different heating rates are presented in Table 5. Using the temperatures Tp1,the activation energy of crystal growth of Ea = 499 ± 66 kJ/ mol was calculated by applying the Kissinger equation.
In this case Ozawa method [31] can also be applied using the relationship:
ln(β) = - (Ea,oz / R Tp)+ const. (7)
Equation (7) calculates the activation energy of crystal growth Ea,oz = 510 ± 68 kJ/mol. These results show good agreement between the activation energies of crystal growth determined under non-isothermal condition at peak 1.
CONCLUSIONS
The crystallization behavior of potassium niobium germanate glass composition of 30K2O●34Nb2O5●
●36GeO2 (mol%) was studied. Investigations were
per-formed under non-isothermal and isothermal conditions using DTA, XRD and SEM methods. The results showed the primary crystallization of this glass, and a very com- plex crystallization process was evidenced. The germa-nium containing phases were formed as primary stable phases, while the phases without germanium were formed as secondary metastable phases. The crystallization process took place with high homogeneous nucleation rate and spherulite crystal growth morphology. Nano-structured samples were obtained.
Analysis of the dominant crystallization mecha-nism of the powder glass sample showed that the behaviors of the parameters Tp2/(ΔT)p and (dT)p depend
only on the change in the surface-to-volume nuclei ratio, as is the case with polymorphic crystallization. At crystallization peak in temperature range T < 700 °C, the ln
· ·
.
βn
a
T
m E
R T
const
p 2
p
= − +
Figure 7. The number of particles per unit volume, NV, as a function of time at the heat treatment temperature T = 650 °C.
0 6×10¹⁸
8×10¹⁸
1×10¹⁹
1.2×10¹⁹
1.4×10¹⁹
1.6×10¹⁹
1.8×10¹⁹
2×10¹⁹
2.2×10¹⁹
2.4×10¹⁹
2×10⁴
t (s)
N
(
m
-3)
4×10⁴ 6×10⁴ 8×10⁴ 1×10⁵
Table 5. Temperature of the crystallization peak, Tp1, for different heating rates β of powder samples of particle size < 0.037 mm.
Particle β (°C/min)
size 5 10 12 15 20
surface crystallization is dominant in the particle size range <0.15 mm. In the range of 0.15-0.35 mm the mixed crystallization mechanism is dominant and the volume crystallization in the range > 0.35 mm. At crystallization peak in temperature range T > 800 °C in the particle size range < 0.35 mm the mixed crystallization mechanism is dominant and the volume crystallization in the range >0.35 mm. The surface crystallization mechanism is not dominant in this temperature range.
The kinetics of crystallization was examined by DTA under non-isothermal conditions with powder samples of particle sizes < 0.037 mm at different heating rates. The surface crystallization was detected in the sample with particle sizes < 0.037 mm. The crystallization peaks Tpincreased with the increase of heating rate. At crystallization peak in temperature range T < 700°C, the crystal growth occurred on a constant number of nuclei and the activation energy of crystal growth was calculated as Ea = 499 ± 66 kJ/mol.
Acknowledgment
The authors are grateful to the Ministry of Education and Science, Republic of the Serbia for inancial support (Projects 172004 and 34001).
References
1. Pernice P., Aronne A., Sigaev V.N., Sarkisov P.D., Molev V.I., Stefanovich S.Yu.: J.Am.Ceram.Soc. 82, 3447 (1999). 2. Sigaev V.N., Stefanovich S.Y., Champagnon B., Gregora I.,
Pernice P., Aronne A., LeParc R., Sarkisov P.D., Dewhurst C.: J. Non-Cryst.Solids 306,238 (2002).
3. Narita K., Takahashi Y., Benino Y., Fujiwara T., Komatsu T.: Opt. Mater. 25, 393 (2004).
4. Benino Y., Takahashi Y., Fujiwara T., Komatsu T.: J. Non-Cryst.Solids 345&346, 422 (2004).
5. Narita K., Takahashi Y., Benino Y., Fujiwara T., Komatsu T.: J. Am. Ceram. Soc. 87, 113 (2004).
6. Lines M.E.: Phys.Rev. B 43, 11978 (1991).
7. Jehng J.M., Wachs I.E.: Chem. Mater. 3, 100 (1991). 8. Kolobkova E.V.: Soviet. J. Glas Phys.Chem. 13, 176
(1988).
9. Powder Diffraction File, Card No. 53-0780. Joint Commit-tee on Powder Diffraction Standards (JCPDS), Swarthmore, PA.
10. Powder Diffraction File, Card No. 71-2171. Joint Commit-tee on Powder Diffraction Standards (JCPDS), Swarthmore, PA.
11. Powder Diffraction File, Card No. 83-2086. Joint Commit-tee on Powder Diffraction Standards (JCPDS), Swarthmore, PA.
12. Powder Diffraction File, Card No. 77-0963. Joint Commit-tee on Powder Diffraction Standards (JCPDS), Swarthmore, PA.
13. Powder Diffraction File, Card No. 83-1500. Joint Commit-tee on Powder Diffraction Standards (JCPDS), Swarthmore, PA.
14. Rietveld H.M.: J. Appl. Cryst. 2, 65 (1969).
15. L. Lutterotti, (2009), MAUD version 2.074, http://www. ing.unitn.it/~maud/.
16. Ray C.S., Yang Q., Haung W., Day D.E.: J. Am. Ceram. Soc. 79, 3155 (1996).
17. Ray C.S., Day D.E., Haung W., Lakshmi Narayan K., Cull T.C., Kelton K.F.: J. Non-Cryst. Solids 204, 1 (1996). 18. Kelton K.F., Lakshmi Narayan K., Levine L.E., Cull T.C.,
Ray C.S.: J. Non-Cryst. Solids 204, 13 (1996).
19. Tošić M.B., Živanović V.D., Grujić S.R., Stojanović J.N., Nikolić J.D.: J. Non-Cryst. Solids 354, 3694 (2008). 20. Gonzales Oliver C.J.R., Russo D.O., James P.J.: Phys.
Chem. Glasses 45, 100 (2004).
21. Yinnon H., Uhlmann D.R.: J. Non-Cryst. Solids 54, 253 (1983).
22. Weiberg M.C.: J. Non-Cryst. Solids 127, 151 (1991). 23. Šesták J.: Phys. Chem. Glass 15, 137 (1974).
24. Kolmogorov A.: Izv. Acad. Sci. USSR, Ser.Math. 1, 355 (1937).
25. Avrami M.: J. Chem. Phys. 7, 1103 (1939). 26. Avrami M.: J. Chem. Phys. 8, 212 (1940). 27. Šesták J.: Phys. Chem. Glass 15, 137 (1974).
28. Matusita K., Sakka S.: Phys. Chem. Glasses 20, 81 (1979). 29. Matusita K., Sakka S.: J. Non-Cryst. Solids 34, 741 (1980). 30. Kissinger H.E.: Anal. Chem. 29, 1072 (1959).