www.atmos-chem-phys.net/16/2659/2016/ doi:10.5194/acp-16-2659-2016
© Author(s) 2016. CC Attribution 3.0 License.
Oxygen isotope mass balance of atmospheric nitrate at Dome C,
East Antarctica, during the OPALE campaign
Joël Savarino1,2, William C. Vicars1,2,a, Michel Legrand1,2, Suzanne Preunkert1,2, Bruno Jourdain1,2, Markus M. Frey3, Alexandre Kukui4,5, Nicolas Caillon1,2, and Jaime Gil Roca4,5
1Université Grenoble Alpes, Laboratoire de Glaciologie et Géophysique de l’Environnement (LGGE),
38000 Grenoble, France
2CNRS, Laboratoire de Glaciologie et Géophysique de l’Environnement (LGGE), 38000 Grenoble, France 3British Antarctic Survey, Natural Environment Research Council, Cambridge, UK
4Laboratoire Atmosphère, Milieux et Observations Spatiales (LATMOS), UMR8190, CNRS-Université de Versailles Saint
Quentin, Université Pierre et Marie Curie, Paris, France
5Laboratoire de Physique et Chimie de l’Environnement et de l’Espace (LPC2E), UMR6115 CNRS-Université d’Orléans,
45071 Orléans CEDEX 2, France
anow at: Technical Services Program, Air Pollution Control Division, Colorado Department of Public Health and
Environment, Denver, CO, USA
Correspondence to:Joël Savarino (jsavarino@ujf-grenoble.fr)
Received: 26 June 2015 – Published in Atmos. Chem. Phys. Discuss.: 7 September 201 Revised: 22 January 2016 – Accepted: 14 February 2016 – Published: 3 March 2016
Abstract. Variations in the stable oxygen isotope composi-tion of atmospheric nitrate act as novel tools for studying ox-idative processes taking place in the troposphere. They pro-vide both qualitative and quantitative constraints on the path-ways determining the fate of atmospheric nitrogen oxides (NO+NO2=NOx). The unique and distinctive17O excess
(117O=δ17O−0.52×δ18O) of ozone, which is transferred to NOx via oxidation, is a particularly useful isotopic fin-gerprint in studies of NOxtransformations. Constraining the propagation of17O excess within the NOxcycle is critical in polar areas, where there exists the possibility of extending at-mospheric investigations to the glacial–interglacial timescale using deep ice core records of nitrate. Here we present measurements of the comprehensive isotopic composition of atmospheric nitrate collected at Dome C (East Antarctic Plateau) during the austral summer of 2011/2012. Nitrate iso-tope analysis has been here combined for the first time with key precursors involved in nitrate production (NOx, O3, OH,
HO2, RO2, etc.) and direct observations of the transferrable
117O of surface ozone, which was measured at Dome C throughout 2012 using our recently developed analytical ap-proach. Assuming that nitrate is mainly produced in Antarc-tica in summer through the OH+NO2 pathway and using
concurrent measurements of OH and NO2, we calculated a
117O signature for nitrate on the order of (21–22±3) ‰. These values are lower than the measured values that ranged between 27 and 31 ‰. This discrepancy between expected and observed117O(NO−3)values suggests the existence of an unknown process that contributes significantly to the at-mospheric nitrate budget over this East Antarctic region. However, systematic errors or false isotopic balance transfer functions are not totally excluded.
1 Introduction
The search for ice core proxies to reconstruct past change of oxidative properties of the atmosphere is motivated by the need to simulate ozone and OH changes over preindustrial– industrial and glacial–interglacial timescales (Thompson, 1992; Wang and Jacob, 1998; Murray et al., 2014). Early ice core reconstructions of oxidants based on H2O2 (Sigg and
Neftel, 1991) and HCHO (Staffelbach et al., 1991) measure-ments were hampered by the occurrence of post-depositional alteration of H2O2 and HCHO concentrations in the
al., 2003). More recently, the 17O excess (117O=δ17O– 0.52×δ18O) of nitrate, a unique isotopic signature inherited from ozone via bimolecular chemical reactions in the atmo-sphere, has shown promise as a conserved proxy for past oxidant concentrations (McCabe et al., 2005; Alexander et al., 2004). The 117O signal of nitrate reflects the relative importance of NOx transformation mechanisms and recent studies suggest that the measurement of this isotopic signal in ice cores and ancient sediments may provide relevant in-formation regarding the role of ozone in the overall oxida-tive capacity of the paleo-atmosphere (McCabe et al., 2007; Michalski et al., 2004, 2003; Savarino et al., 2007; Thiemens, 2006). Parallel studies of the nitrogen isotope ratios (δ15N) of nitrate in polar ice and snow suggest that this isotopic tracer may serve as a proxy for past variations in natural sources of atmospheric NOx (Hastings et al., 2009, 2005; Jarvis et al., 2008). However, the chemical and physical factors govern-ing the oxygen and nitrogen isotopic composition of atmo-spheric nitrate and its nitrogen oxide precursors are not fully understood (Alexander et al., 2009; Morin et al., 2009). This is particularly true in the polar troposphere, where the UV photolysis of trace species present in the snowpack or ma-rine aerosols initiates complex boundary layer oxidation pro-cesses involving reactive halogen species (Bloss et al., 2010; Grannas et al., 2007; Wang et al., 2007) and results in distinc-tive117O andδ15N signatures in atmospheric nitrate (Morin et al., 2007, 2008, 2012).
Here we present measurements of δ15N and δ17O and
δ18O isotopic composition of atmospheric nitrate collected at Dome C between November 2011 and January 2012. These measurements were conducted within the framework of the OPALE project (Oxidant Production over Antarctic Land and its Export; Preunkert et al., 2012), which has provided an opportunity to combine nitrate isotopic observations with a wealth of meteorological and chemical observations, includ-ing measurements of species involved in nitrate production (NOx, O3, OH, HO2, RO2, etc.). The primary objective of
this study was to reconcile observations of 117O for at-mospheric nitrate at Dome C with quantitative predictions based on nitrate isotope mass balance and atmospheric chem-istry parameters, a unique opportunity offered by the OPALE campaign.
2 Methods
2.1 Site description and scientific context
Dome C is situated 3233 m above sea level on the East Antarctic Plateau (75◦06′S, 123◦23′E), approximately 1100 km from the coastal research station Dumont d’Urville and 560 km from the Vostok station. Deep ice cores were extracted at Dome C in the framework of the European Project for Ice Coring in Antarctica (EPICA) covering ap-proximately 800 000 years (EPICA community members,
2004) and Vostok covering the last 420 000 years (Petit et al., 1999). In parallel, studies aiming to understand the mete-orological, chemical, and physical factors governing the vari-ability in trace constituents preserved in the ice were initiated (Jourdain et al., 2008; Preunkert et al., 2008).
Although the Antarctic Plateau is extraordinarily dry, cold, and far removed from sources of anthropogenic emissions, first atmospheric measurements of oxidants conducted in 1998–1999 during the ISCAT (Investigation of Sulfur Chem-istry in the Antarctic Troposphere) field campaign revealed a high level of photochemical activity. For example, the aver-age summertime OH concentration (2×106cm−3)over the
South Pole was found to be similar to that of the tropical marine boundary layer (MBL) (Mauldin et al., 2001). Unex-pectedly high levels of nitric oxide (NO) were also detected, with concentrations 1 to 2 orders of magnitude higher than that typically observed in other remote regions (Davis et al., 2001). Model simulations revealed that the large OH con-centrations observed at South Pole were a result of the ele-vated NO level, which catalyzes a rapid cycling of HO2to
OH (Chen et al., 2004, 2001). The high concentrations of NOx were also inferred to drive in situ photochemical pro-duction of ozone during the ISCAT campaign (Crawford et al., 2001). Surface ozone and NOxmeasurements at Dome C suggest a similar level of enhanced oxidant production dur-ing November–January (Frey et al., 2013, 2015; Legrand et al., 2009).
The high levels of photochemical activity observed at South Pole and Dome C are now understood in terms of NOx release from the snowpack (Honrath et al., 2000, 1999; Jones et al., 2001, 2000; Zhou et al., 2001). This process is initiated by the photolysis of nitrate, which can lead to large fluxes of NO2, NO, and HONO from permanently sunlit snow
(Anas-tasio and Chu, 2009; Grannas et al., 2007; Jacobi and Hilker, 2007; Legrand et al., 2014; Frey et al., 2013). Observed and modeled NOx production rates are largely capable of ex-plaining the high levels of photochemical activity observed on the Antarctic Plateau during spring (France et al., 2011; Liao and Tan, 2008; Wang et al., 2007) although detailed and speciation of nitrogen oxides chemistry remain largely un-known in this NOx-rich/VOC-poor environment (Kukui et al., 2014; Frey et al., 2015; Legrand et al., 2014; Davis et al., 2008).
2.2 High-volume sampling
Bulk atmospheric samples were collected at Dome C on glass fiber filters using a high-volume air sampler (HVAS), which was installed on a platform 1 m above the ground. The HVAS was run by applying an average STP (standard temperature and pressure) flow rate of 0.7 m3min−1that ensures the
samples were obtained during the OPALE campaign (from November 2011 to January 2012). After each collection pe-riod, filters were removed from the HVAS and placed in clean 50 mL centrifuge tubes, which were sealed in plas-tic bags and stored at −20◦C. Upon arrival at our labora-tory in Grenoble, atmospheric filter samples were extracted in 40 mL of ultra-pure water via centrifugation using Milli-pore Centricon®filter units. Nitrate concentration was then determined for each filter extract solution using a colorimet-ric technique (Frey et al., 2009).
2.3 Ozone collection
The nitrite-coated filter technique for ozone isotope analy-sis has been described in detail in Vicars et al. (2012) and Vicars and Savarino (2014). The principle of ozone collec-tion underlying this technique is the filter-based chemical trapping of ozone via aqueous-phase reaction with nitrite (Adon et al., 2010; Geyh et al., 1997; Koutrakis et al., 1993; Krzyzanowski, 2004):
NO−2 +O3→NO−3 +O2. (R1)
By coupling this routine ozone measurement technique with recent analytical developments in the 117O analy-sis of nanomole quantities of nitrate (Kaiser et al., 2007), the 17O excess transferred by one of the two O
3
termi-nal atoms through bimolecular chemical reactions, denoted
117O(O3)term, as well as ozone’s bulk117O value, denoted
117O(O3)bulk (=2/3 117O(O3)term since all17O excess is
located at the two O3 terminal atoms; Bhattacharya et al.,
2008; Janssen and Tuzson, 2006), can be inferred from the oxygen isotopic composition of the nitrate produced via R1 within the coated filter matrix.
Ambient ozone collections were performed using an active air sampler consisting of 1/4 in. Teflon®(PFA) tubing con-necting three main sampler components: (i) a standard low-volume vacuum pump (Welch®, model 2522C-02) equipped with a volume counter and needle valve (or flow meter) for flow rate regulation, (ii) a closed PFA filter holder assembly (Savillex®) containing a pre-coated 47 mm glass fiber sam-pling substrate (Whatman®, GF/A type), and (iii) an
open-faced PFA filter holder assembly containing a 47 mm PTFE membrane filter (Zylon®, 5 µm pore size) for the removal of particulate species upstream of the coated filter. Glass fiber sampling substrates were coated prior to sample col-lection with 1 mL of a nitrite-based ozone sampling solution (0.1 M NaNO2, 0.05 M K2CO3, 0.1 M glycerol) (Koutrakis
et al., 1993), allowed to dry at 75◦C for approximately 10 min, and then stored frozen in the dark in individual plas-tic PetriSlide™ containers (Millipore®). Samples were col-lected by loading pre-coated filters into the sampling filter holder, which was then connected to the prefilter (upstream) and needle valve/pump (downstream) and covered in alu-minum foil to limit light exposure, a step that is necessary to limit the blank production rate during sample collection
(Vicars et al., 2012). Air was then pumped through the sam-pling system at a target flow rate of 3.0 L min−1.
Sampling was conducted during the OPALE campaign (December 2011–January 2012) from a climate-controlled shelter, and a total of 28 samples were collected. However, due to difficulties in the application of our analytical tech-nique to the utech-nique environmental conditions encountered in Antarctica, the results obtained from these samples were inconclusive (i.e., unrealistic variability) due to the lack of light protection of the filter holder (Vicars et al., 2012, 2013). Sampling and isotopic analysis of ozone was therefore re-peated in 2012, and a complete annual record of117O(O3)
was obtained (n=60). Procedural filter blanks were also col-lected at regular intervals and were subjected to all of the same preparation, storage, handling, and analytical proce-dures as field samples. After sample collection, filter sam-ples and procedural blanks were returned to their containers, which were covered in aluminum foil and stored at−20◦C before processing and analysis.
Filter samples were extracted in 18 mL of deionized wa-ter (18.2 M, hereafter referred to as “MQ water”). In or-der to remove the excess (i.e., unreacted) nitrite reagent from the sample extracts, the solutions were treated with 1 mL of a 1 M sulfamic acid solution and then neutralized with a corresponding addition of high-purity sodium hydroxide (Granger and Sigman, 2009; Vicars et al., 2012). Extract so-lutions were then filtered via centrifugation using Millipore Centricon®assemblies. The nitrate extracted from the coated filter samples was then subjected to isotopic analysis, as de-scribed in the following section.
2.4 Isotopic analysis
The comprehensive isotopic composition of nitrate (15N/14N, 17O/16O, 18O/16O) was measured on a Finnigan™ MAT253 isotope ratio mass spectrometer (IRMS), equipped with a GasBench II and coupled to an in-house-built nitrate interface (Morin et al., 2009). Nitrate in both the nitrite-coated filter and aerosol sample extracts was prepared for isotopic analysis by conversion to N2O via
the bacterial denitrifier method (Casciotti et al., 2002; Kaiser et al., 2007; Michalski et al., 2002; Sigman et al., 2001). The detailed analytical procedure has been described elsewhere (see Morin et al., 2009) and is briefly presented here.
Denitrifying bacteria (Pseudomonas aureofaciens) were cultured in nitrate-amended soy broth and incubated for 5 days in stoppered glass bottles. Bacterial cultures, after concentration by centrifugation and resuspension, were dis-pensed as 2 mL aliquots into 20 mL glass vials, which were then crimped and purged with helium for 3 h. Approximately 100 nmol of sample nitrate was then injected into the purged vials and conversion of the sample nitrate to nitrous oxide (N2O) via bacterial denitrification was allowed to proceed
overnight. The N2O sample was then cryo-focused in a
0 20 40 60 80 100
24/
10
13/
1
1
3/
12 23/12 12/1 1/2
[N
O
3 –] (ng m
–3)
OPALE DEC 2011
Figure 1. Atmospheric nitrate concentrations observed between November 2011 and January 2012. The samples collected during the intensive measurement period (December 2011–January 2012) are indicated with open circles.
it was thermally decomposed at 900◦C into O
2and N2.
Fol-lowing separation via gas chromatography, the O2 and N2
gas samples were directed into the ionization chamber of the IRMS. All analytical steps were identically performed on ni-trate isotopic standards and their equimolar mixtures (Inter-national Atomic Energy Agency USGS 32, USGS 34, and USGS 35), which were prepared in an identical background matrix as the samples. Individual analyses were normalized through comparison with these three nitrate reference materi-als (Coplen, 2011; Werner and Brand, 2001). All isotopic en-richment values for nitrate are reported relative to VSMOW and air N2for oxygen and nitrogen, respectively. The overall
accuracy of the method is estimated as the standard deviation of the residuals from the linear regression between the mea-sured reference materials and their expected values. For the results reported here, the average uncertainties obtained for
δ18O,117O, andδ15N were 1.6, 0.5, and 1.0 ‰, respectively. 2.5 Complementary measurements
Concurrent chemical measurements were conducted at Dome C during the campaign include HONO (Legrand et al., 2014), HOx(=OH+HO2+RO2)radicals (Kukui et al.,
2014), O3(Legrand et al., 2016) and NO and NO2(Frey et
al., 2015). Photolysis rate coefficients and meteorological pa-rameters were also recorded.
3 Results and discussion
3.1 Isotope ratios of ozone and atmospheric nitrate Atmospheric nitrate concentrations observed at Dome C dur-ing the campaign are presented in Fig. 1, and the correspond-ing nitrate117O andδ15N values in Fig. 2. Atmospheric ni-trate concentrations ranged between 20 and 90 ng m−3, with the maximum values occurring in mid-December 2011, con-current with the period of intensive of atmospheric sampling of the OPALE field campaign. These values are in good
–50 –40 –30 –20 –10
0 10
26 28 30 32 34
24/
10
13/
1
1
3/
12 23/12 12/1 1/2
δ
15
N
(N
O
3 –
) (‰)
Δ
1
7
O
(N
O
3–
)
(‰
)
r = –0.86Figure 2. 117O (primaryy axis) andδ15N (secondaryy axis) of atmospheric nitrate collected between November 2011 and Jan-uary 2012. The samples collected during the intensive measurement period (December 2011–January 2012) are indicated with open symbols.
agreement with those observed during the 2007–2008 and 2009–2010 field studies conducted at Dome C by Frey et al. (2009) and Erbland et al. (2013), respectively.
117O values for atmospheric nitrate ranged between 27.3 and 32.4 ‰, and those forδ15N between−42.8 and 1.7 ‰. The observed strongly depleted δ15N(NO−3) values are in good agreement with those previously reported and hav-ing unambiguously attributed to the transformation of local snowpack NOx emissions via photochemistry in the bound-ary layer, which led to peaks in atmospheric nitrate concen-tration during the period from October to December (Erb-land et al., 2013). As seen in Fig. 2, variations in117O and
δ15N were negatively correlated (rvalue of−0.86) and again show similar amplitude and phase to those reported in previ-ous studies (Erbland et al., 2013; Frey et al., 2009).
A time series showing the year-round record of
117O(O3)bulk at Dome C in 2012 is presented in
Fig. 3.117O(O3)bulk averaged 24.9±1.9 ‰, derived from
117O(O3)term values of 37.4±1.9 ‰. As shown in Fig. 4,
these 117O(O3)bulk values are consistent with those
ob-served in Grenoble (France), as well as with measurements conducted along a latitudinal transect from 50◦S to 50◦N in the Atlantic Ocean (Vicars and Savarino, 2014). Although the 117O(O3)bulk seasonal cycle reveals some interesting
features, like the winter maximum, probably in response of the permanent winter darkness and stratospheric air mass in-trusions, a complete description is beyond the scope of the present paper. What should be kept in mind here is the quite stable117O(O3)bulk value close to 26 ‰ that can be
con-sidered as representative of the OPALE campaign held in November–January.
3.2 Nitrate isotope mass balance
opportu-15 20 25 30 35
J F M A M J J A S O N D J F
∆
17
O
(O
3
)
bulk
(‰)
Figure 3.117O(O3)bulk values for the 60 ambient air samplings
done at Dome C throughout 2012. Vertical error bars refer to the total uncertainty estimated for the technique (±1.7 ‰).
nity to compare observed 117O(NO−3)values in the atmo-sphere to ones calculated from concurrent observations. As discussed at length in recent studies (for example, by Morin et al., 2011, and Vicars et al., 2013), the 17O-excess trans-fer functions associated with the various nitrate production pathways (i.e.,117O(NO−3)i values) can be estimated as a function of the 117O of nitrate precursor gases (i.e., NOx, O3, OH, etc.) using mass balance calculations that trace the
origin of oxygen atoms transferred during the chemical trans-formation of NOxin the atmosphere. All atmospheric nitrate production channels involve either NO2or a NOx reservoir
species derived from NO2(e.g., N2O5). The first step in
de-termining the117O signature of each pathway is therefore a quantitative assessment of the steady-state117O value of NO2, which is typically calculated as a function of the117O
value of O3and the reaction dynamics involved in the
con-version of NO to NO2. As Dome C in summer is permanently
under sunlight, photochemical inter-conversion of NOx con-tinues:
NO2+hv→NO+O, (R2)
NO+O3→NO2, (R3)
NO+HO2/RO2→NO2. (R4)
At photochemical steady state (i.e., R2–R4 being faster than NO2net sink reactions), an assumption that can be
reason-ably applied throughout the day at Dome C during summer, we have (Morin et al., 2011)
117O(NO2)=α×
1.18×117(O3)bulk+6.6
, (1) where the term in bracket represents the laboratory-deduced anomaly transfer function of the NO+O3reaction (Savarino
et al., 2008),117O(O3)bulkthe17O excess of the bulk O3and
α represents the fraction of the atmospheric NO2 reservoir
that has been produced through oxidation by O3rather than
Figure 4.Comparison of117O(O3)bulkvalues obtained at Dome C
with those previously reported by Vicars and Savarino (2014) at other sites. Box plots indicate the interquartile range (box) and the median (line), maximum, and minimum values. The mean value is denoted by a circle.
HO2/RO2at photochemical equilibrium (Alexander et al.,
2009; Michalski et al., 2003; Morin et al., 2011; Röckmann et al., 2001):
α= kNO+O3[NO] [O3]
kNO+O3[NO] [O3]+kNO+HO2[NO] [HO2]
∗, (2)
with [HO2]∗=[HO2]+[RO2].
It is important to note here that Eqs. (1) and (2), al-though established under the NOx steady-state approxima-tion, are independent of NO2 concentration, for which a
bias in measurement cannot be ruled out. Indeed, as dis-cussed by Frey et al. (2013, 2015), bias in NO2
measure-ments is suspected partly because it remains difficult to ex-plain the observed ratio of NO2/NO, which is
systemati-cally higher (up to a factor of 7) than predicted by calcu-lations made by assuming photochemical steady state con-sidering the NO2 photolysis and reaction of NO with O3,
HO2/RO2and BrO. Equation (2) also assumes that [HO2]∗
is predominantly formed by the reaction H+O2and R+O2
during the OPALE campaign (Kukui et al., 2014), resulting in the formation of [HO2]∗devoid of any significant17O
ex-cess (Morin et al., 2011). Using OPALE measurements of NO, O3, OH and HO2/RO2(Frey et al., 2015; Kukui et al.,
2014), along with temperature dependent reaction kinetics data obtained from Atkinson et al. (2004), we have calcu-lated the diurnally mass-averaged trend inαfor the month of December 2011 at Dome C. Measurements of117O(O3)bulk
at Dome C during the OPALE campaign averaged 25±2 ‰, corresponding to117O(O3)termvalues of 37±2 ‰ (Fig. 4).
Samples collected in December indicate117O(O3)bulk
val-ues close to 26 ‰ (117O(O3)term=3/2117O(O3)bulk=39–
40 ‰, Fig. 3), and we have therefore adopted a117O(O3)term
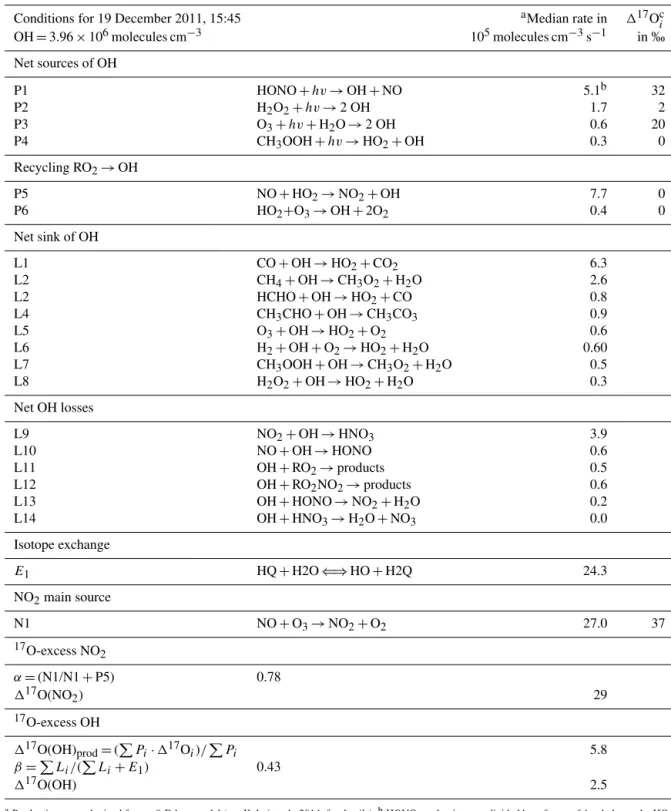
at-Table 1.Example of mass balance calculation of117O for 19 December 2011 at 15:45 local time (UTC+8 h).
Conditions for 19 December 2011, 15:45 aMedian rate in 117Oci OH=3.96×10⁶molecules cm−3 105molecules cm−3s−1 in ‰
Net sources of OH
P1 HONO+hv→OH+NO 5.1b 32
P2 H2O2+hv→2 OH 1.7 2
P3 O3+hv+H2O→2 OH 0.6 20
P4 CH3OOH+hv→HO2+OH 0.3 0
Recycling RO2→OH
P5 NO+HO2→NO2+OH 7.7 0
P6 HO2+O3→OH+2O2 0.4 0
Net sink of OH
L1 CO+OH→HO2+CO2 6.3
L2 CH4+OH→CH3O2+H2O 2.6
L2 HCHO+OH→HO2+CO 0.8
L4 CH3CHO+OH→CH3CO3 0.9
L5 O3+OH→HO2+O2 0.6
L6 H2+OH+O2→HO2+H2O 0.60
L7 CH3OOH+OH→CH3O2+H2O 0.5
L8 H2O2+OH→HO2+H2O 0.3
Net OH losses
L9 NO2+OH→HNO3 3.9
L10 NO+OH→HONO 0.6
L11 OH+RO2→products 0.5
L12 OH+RO2NO2→products 0.6
L13 OH+HONO→NO2+H2O 0.2
L14 OH+HNO3→H2O+NO3 0.0
Isotope exchange
E1 HQ+H2O⇐⇒HO+H2Q 24.3
NO2main source
N1 NO+O3→NO2+O2 27.0 37
17O-excess NO 2
α=(N1/N1+P5) 0.78
117O(NO2) 29
17O-excess OH
117O(OH)prod=(P
Pi·117Oi)/PPi 5.8
β=P
Li/(PLi+E1) 0.43
117O(OH) 2.5
aProduction rates obtained from a 0-D box model (see Kukui et al., 2014, for details).bHONO production rate divided by a factor of 4 to balance the HO
x
radical budget (see Kukui et al., 2014, and Legrand et al., 2014, for justification).cHONO is assumed to be formed by the photodissociation of nitrate in snow.117O(NO−3)snowis therefore assigned to HONO. The rest of the17O-excess transfer (i.e., P2 to P6 and N1) follows the rules established in Morin et al. (2011) and117O(O3)bulk=26‰.
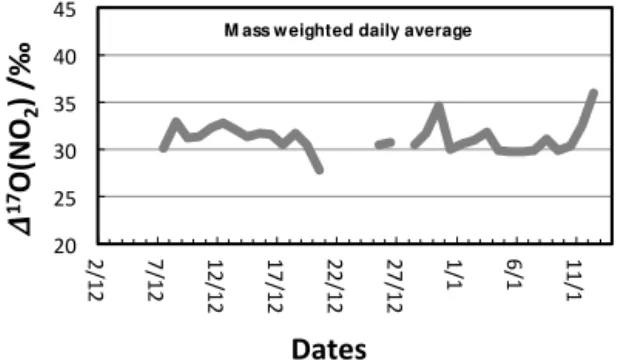
mospheric model (Zahn et al., 2006). The diurnally mass av-erage of117O(NO2)calculated using a117O(O3)bulkvalue
of 26 ‰ and Eq. (2) is shown in Fig. 5. No trend is observed during the OPALE campaign, and on average the predicted
value is117O(NO2)=31±2 ‰ throughout December,
cor-responding to average α value of 0.83. In other words, at steady state, the concentrations of O3 and HO∗2 measured
20# 25# 30# 35# 40# 45#
2/12# 7/12# 12/12# 17/12# 22/12# 27/12# 1/1# 6/1# 11/1#
!
17O(
N
O2
)(
/‰(
Dates( M ass w eighted daily average
Figure 5. Quantitative assessment of the daily averaged trend in the 117O of NO2 at Dome C during December 2011–
January 2012 derived from concurrent measurements of ozone, NO, and HO2/RO2.
via R3 (see also Table 1). In the absence of the αdilution effect introduced by the HO∗
2 reaction, 1 17O(NO
2) would
equal 37 ‰, a value 8 ‰ lower than an estimation obtained from modeling only NOx–O3chemistry at standard
temper-ature and pressure (Michalski et al., 2014). This difference is essentially explained by the use of different117O(O3)bulk
(32 ‰ in Michalski’s simulation, 26 ‰ for our observations), which possibly corresponds to different conditions of the two studies.
By accounting for the origin of the oxygen atom trans-ferred during the conversion of NO2 to nitrate, the 117O
signature of the nitrate produced through different reaction mechanisms can be calculated. For summer conditions at Dome C, it is reasonable to assume that the dominant atmo-spheric nitrate formation pathway is the gas-phase associa-tion of NO2and the OH radical (Alexander et al., 2009):
NO2+OH+M→HNO3+M, (R5)
leading to the following17O-excess mass balance (Michalski et al., 2003; Morin et al., 2011):
117O NO−3
=2 31
17
O(NO2)+
1 31
17
O(OH) . (3) In order to predict the 117O value of the nitrate produced through R5 by mass balance, the isotopic composition of tropospheric OH must be known. The OH radical partici-pates in a rapid isotopic exchange with atmospheric water vapor, which represents a very large oxygen reservoir rela-tive to OH, with a117O that is negligible compared to ozone or nitrate (Luz and Barkan, 2010). This exchange tends to erase the17O excess of OH under humidity and temperature conditions typical of the midlatitudes (Dubey et al., 1997); therefore, the117O of OH is normally assumed to be zero in modeling studies applied to these regions. As discussed by Morin et al. (2007), this assumption of117O(OH)=0 is not valid under the low-humidity conditions encountered in the polar atmosphere. The degree of isotopic equilibration be-tween OH and H2O can be determined as a function of the
relative rates of the isotope exchange reaction and the main OH sink reactions:
β= L
L+kH2O+OH[H2O]
, (4)
whereLrepresents the total chemical loss rate of OH.β is the factor relating the initial117O transferred to OH upon its formation, denoted117O(OH)prod, to its steady-state117O
value (Morin et al., 2007):
117O(OH)=β×117O(OH)prod. (5)
In plain words, Eqs. (4)–(5) predict that when the isotopic exchange reaction dominates over OH chemical losses (i.e.,
β≪1), the steady-state 117O value of OH will be equal to that of water (i.e.,117O≈0 ‰). Conversely, when wa-ter vapor concentrations are low and the rate of chemical loss is large relative to the rate of the isotopic exchange,
117O(OH)=117O(OH)prod. Kukui et al. (2014), using a
Master Chemical Mechanism box model, constrained by the OPALE meteorological conditions and concurrent chemical observations, give the rate of the OH chemical sources and sinks. NO2as measured by Frey et al. (2015) represents at
most only ca. 10 % (equivalent of ca. 1 ‰) of the total sink of OH, which is predominantly dominated by reactions with CO, CH4, aldehydes and to a lesser extent by reactions with
O3, H2, and NO. Thus, the possible overestimation of NO2
concentration has only a minor effect onβ calculation and is well embedded within the total uncertainty of such cal-culation. To assess the value of117O(OH), we have com-puted β for the conditions found during the OPALE cam-paign using the same 0-D box model that is used to eval-uate the budget of OH and RO2 during the OPALE
cam-paign (see Kukui et al., 2014, and Table 1) and used the ex-change kinetic rates given in Dubey et al. (1997). The abso-lute water vapor concentration is deduced from relative hu-midity and temperature measurements using Bolton (1980) (i.e.,Pwater=6.112×e
(17.67×(T−273)
T−29.5 , withPwaterin hPa andT in K). The results of this calculation (Fig. 6) indicate thatβ
varies between 0.70±0.10 (1σ) and 0.30±0.10 from mid-night to noon for conditions prevailing during the OPALE campaign, suggesting that, on a daily average basis, approx-imately 43 % of the117O value originally present in OH is preserved from exchange with H2O, consistent with
es-timates for an Arctic site described by Morin et al. (2007). The value of 117O(OH)prod is more difficult to assess
because of the interplay between HO and HO2, and the
different sources involved in OH formation. In the NOx-rich atmosphere at Dome C in summer, the O(1D)+H2O
reaction forming OH is a minor reaction pathway. When multiple pathways are involved in the production of OH,
117O(OH)prod can be estimated by a simple isotope mass
Table 2.Comparison of measured and calculated117O(NO−3)values.
Sampling period Measured Calculated
αconstrained α=1 αconstrained αconstrained by observations by observations by observations
117O(OH)∗based 117O(OH)∗ β=1 117O(OH) based on HOxbudget based HOxbudget on observed HONO
10–16 Dec 29.6 21.9 25.6 22.6 27.0
16–23 Dec 29.0 21.0 25.6 21.7 26.3
23–30 Dec 27.8 21.6 25.4 22.0 25.7
30 Dec–2 Jan 27.3 21.5 25.3 22.4 24.9
∗
HONO production rate divided by a factor of 4 to balance the HOxradical budget (see Kukui et al., 2014, and Legrand et al., 2014, for justification).
0.0# 0.5# 1.0#
15/12# 20/12# 25/12# 30/12# 4/1# 9/1# 14/1#
β#
Figure 6.December 2011 time series forβ, the fraction of the17O excess originally associated with the OH radical that is preserved against isotopic exchange with water.
associated 17O excess (Morin et al., 2011). Observations at Dome C during the OPALE campaign indicate that the pho-tolysis of HONO and the HO2+NO reaction may
repre-sent the most significant sources of OH at Dome C dur-ing the period of seasonal snowpack emissions (Kukui et al., 2014). However, the measurement of HONO (around few 10 pmol mol−1) during OPALE, probably biased by HO2NO2 interference (Legrand et al., 2014), is
incompati-ble with the HOx (=OH+HO2/RO2)radical budget. Best
agreement is achieved when HONO at Dome C is assumed to originate from snow emissions with the emission strength evaluated by Legrand et al. (2014). Using a 1-D model, Kukui et al. (2014) show that the concentrations of HONO corresponding to about 20–30 % of measured HONO are consistent with those calculated from the budget analysis of OH radicals with the concentrations of NO2 either
cal-culated from NO measurements assuming PSS or observed by Frey et al. (2015). Therefore, the production of OH by HONO photolysis is consequently adjusted and the 0-D box model (Kukui et al., 2014) is used to calculate all other pro-duction rates of OH. Note that, even when lowering HONO to 20–30 % of the measured values, this species remains the major primary source of radicals at Dome C. Apply-ing the isotope17O-excess transfer (Morin et al., 2011) and the OHprodisotope mass balance,117O(OH)prodon average
equals 5±2 ‰ (1σ ). Because the major process leading to the emission of HONO from the snowpack is the photolysis of nitrate, which possesses a117O value of approximately 32 ‰, both in the snow “skin layer” (Erbland et al., 2013) and in the top 10 cm of snow (Frey et al., 2009), we have assumed that117O(HONO)atm=117O(NO−3)snow as both
oxygen atoms of HONO can be tracked back to the nitrate. An example of the isotope mass balance calculation is given in Table 1. Figure 7 shows the diurnally integrated average of the117O(OH).117O(OH) varies in a narrow range, be-tween 1 and 3 ‰. An estimation of the117O signature for the NO2+OH channel,117O(NO−3)R2, that accounts for the 17O excess carried by the OH radical results in values
rang-ing between 20 and 23 ‰. Averagrang-ing over the same time pe-riod as the nitrate atmospheric sampling, diurnally integrated average117O(NO−3) values of 21–22 ‰±3 ‰ can be es-timated for December (Table 2). These values are 6–8 ‰ lower than the observed atmospheric values for117O(NO−3)
(27–30 ‰ during OPALE, Fig. 2 and Table 2). The source of discrepancy between observed and modeled117O(NO−3)
during OPALE is presently unknown, but we note that such underestimation of the modeled117O(NO−3)versus the ob-served117O(NO−3)was also pointed out in 3-D modeling of the nitrate17Oexcess(Alexander et al., 2009). A critical
eval-uation may nevertheless offer some clues.
4 Discussion
4.1 Alternative sources of NO2
A possible explanation for the underestimation of
0"
1"
2"
3"
4"
15/12" 20/12" 25/12" 30/12"
4/1" 9/1"
14/1"
Δ
17O(
OH)
"
Dates"
Figure 7.Same as Fig. 5 but for117O of OH.
1980s (Fan and Jacob, 1992; Simpson et al., 2007):
X+O3→XO+O2. (R6)
In terms of the chemical budget of NOx, the impact of XO can occur via two chemical mechanisms (see Sect. 4.2 for the second mechanism involving the formation of halogen nitrate, XONO2). First, XO can oxidize NO to NO2, a
path-way that competes with the NO+O3and NO+HO2/RO2
reactions in terms of NO oxidation:
XO+NO→X+NO2. (R7)
For conditions typical of the Antarctic boundary layer, 1 pmol mol−1of XO has roughly the same chemical activity
as 4 nmol mol−1of ozone in terms of NO oxidation
(Atkin-son et al., 2007). Therefore, when halogen oxides are present at relevant levels, R7 can result in concentrations of NO2
that are higher than that predicted from the balance between NO2 destruction via photolysis and production through the
reaction of NO with O3 or HO2/RO2 (i.e., the extended
Leighton mechanism): [NO2]
[NO] = (6)
kNO+O3[O3]+kNO+HO2[HO2]+kNO+RO2[RO2] +kNO+XO[XO]
jNO2
.
The involvement of XO in the NOxcycle at Dome C would have important implications for the 117O of atmospheric nitrate. The production of halogen oxide radicals proceeds through a direct transfer of a terminal oxygen atom from ozone to the XO product (Zhang et al., 1997). Therefore, it is expected that the117O of XO is equal to117O(O3)term,
which means that the reaction of NO with XO is roughly equivalent to the NO+O3reaction in terms of117O
trans-fer to NO2(note that the NO+XO transfer is greater than
NO+O3 as, in the later case, part of the central O3 atom
participates in the reaction). The participation of XO species in the oxidation of NO thus leads to a greater117O transfer to NO2by effectively increasing the value ofα. However, on
the Antarctic Plateau, BrO did not exceed 2–3 pmol mol−1
during the OPALE campaign (Frey et al., 2015). Including BrO chemistry would only increase α by 2 % (due to the specific form ofα≡1/(1+x)), which is too low to signif-icantly influence 117O(NO2) and ultimately 117O(NO−3).
In the absence of measurements of other halogens we can-not completely rule out a role of the halogen chemistry there. However, even withα=1, its maximum but unrealis-tic value due to the high concentration of HO2,117O(NO−3)
would reach the range of 23–25 ‰, in better agreement with the observations but still significantly lower. Similarly, in the event of a non-isotopic steady state of NO2
(Michal-ski et al., 2014), it is very unlikely that117O(NO2)could
reach values greater than its primary snow nitrate source (i.e.,117O(NO2) > 117O(NO−3)snow=30–35 ‰ in summer
at Dome C; Erbland et al., 2013; Frey et al., 2009), still leav-ing the predicted117O(NO−3)underestimated with respect to atmospheric observations.
4.2 Alternative oxidation pathways of NO2
Considering R5 as the main source of HNO3, an alternative
approach is to consider that OH bears a higher117O than the estimate calculated previously. Assuming aβof 1, which seems again unrealistic, will increase117O(NO−3)by 1 ‰ at most (Table 2), still insufficient to explained atmospheric observations as NO+HO2 remain a major source of OH,
independent of the assumedβ.
Alternatively, if measured HONO concentrations are con-sidered instead of those assumed to constrain by the HOx budget (i.e., 4 times lower than measured), average
117O(NO−3) values of 23–24 ‰ are calculated (Table 2), again systematically lower than the observed range of 27– 30 ‰. However, given the significant uncertainty surround-ing the isotopic composition of HONO and its relative con-tribution to total OH production at Dome C, it is not possible to make a firm conclusion in this regard.
Therefore, neither the common sources of NO2 nor the
daytime formation of HNO3seems to be able to explain the
high117O(NO−3)values of atmospheric nitrate observed at Dome C in summer. When this observation is taken together with the high NO2/NO ratio observed by Frey et al. (2013,
2015) during two summer seasons at Dome C, clearly our current understanding of the NOxchemistry on the Antarctic Plateau seems to be incomplete.
There are several other processes that possibly account for the disagreement between the measurements and mass bal-ance calculations. Indeed, in addition to its impact on NOx cycling through the R7 pathway, an increasing body of ev-idence points towards reactive halogen chemistry as a ma-jor NOx sink and source of nitrate via the production and subsequent hydrolysis of XNO3species (Sander et al., 1999;
XO+NO2+M→XNO3+M, (R8)
XNO3+H2O(liquid)→HNO3(aq)+HOX. (R9) A critical analysis of the CHABLIS data led Bauguitte et al. (2012) to conclude that R8–R9 pathway exerted predom-inant control over the chemical loss rate of NOx during the campaign, despite the significant uncertainties involved in the parameterization of the uptake processes (Finlayson-Pitts, 2009). This implies that XNO3 uptake may also
rep-resent a significant source of nitrate at Dome C should halo-gen oxide radicals (XO) be present at the required concentra-tion. Experimental (Gane et al., 2001) and theoretical (Mc-Namara and Hillier, 2001) studies suggest that the oxygen atom initially associated with XO combines with the N atom of NO2to form nitrate, thus transferring the isotopic
signa-ture of both XO and NO2. The specific117O value induced
by XNO3hydrolysis can thus be expressed as follows (Morin
et al., 2007):
117O NO−3
R6=
2 31
17
O(NO2)+
1 31
17
O(O3)term, (7)
efficiently bypassing the OH 17O-excess budget. Through consideration of the increased117O transfer associated with R8, the observations of117O(NO−3)during December can be reconciled with the values calculated by mass balance if approximately 10–20 % of total nitrate production is as-sumed to occur via XNO3hydrolysis. However, no sufficient
halogen concentration has been observed on the Antarctic Plateau to sustain such a chemical pathway, but we note that chlorine chemistry has never been probed on the Antarctic Plateau.
There is increasing body of evidence that heterogeneous hydrolysis of NO2 can be a possible source of HONO and
HNO3in acidic conditions (Finlayson-Pitts, 2009), with the
potential to explain the difference between the calculated and measured atmospheric117O(NO−3)values. This mech-anism would represent a source of nitrate with a117O value roughly equivalent to the nitrate originally present in the sur-face snow (i.e., 30–35 ‰), a signature significantly higher than that induced by R5. If this production mechanism is active at the air–snow interface at Dome C and results in the slow emission of nitrate to the atmosphere via physi-cal release after its formation, it would act to increase the
117O value of nitrate in the boundary layer relative to the lo-cal 117O(NO−3)R5 oxidation signature. However,
consider-ing the propensity of nitric acid to stick on snow (Crowley et al., 2010), the snowpack to act as a sink rather than a source of nitric acid (Dibb, 2004; Erbland et al., 2013) and the fast NOx recycling that should take place within the snowpack, it is very unlikely that117O(NO−3)could be explained by a direct nitric acid emissions from snow, which has been ulti-mately shown to be limited (Slusher et al., 2010; Erbland et al., 2013; Berhanu et al., 2014).
A critical analysis of117O(NO−3)shows in fact that such high values correspond mainly to the nighttime chemistry of NOx (Michalski et al., 2003; Morin et al., 2008). Nighttime chemistry involves species like N2O5 and NO3in the
pro-cess of forming HNO3and again efficiently bypass the OH
pathway. It is conceivable that below the photic zone, within the snowpack, N2O5and NO3could be produced when O3
and NO2are transported at depth, but there is no reason to
think that such dark NOxchemistry could in one way or an-other survive the photic zone transition and thus influence the overlying atmosphere.
Stratospheric nitrate deposited to the surface snow during winter, which has been observed to possess117O(NO−3) val-ues in the range of 35–41 ‰ (Erbland et al., 2013) and, pos-sibly more, may act to buffer the117O of the atmospheric nitrate reservoir via evaporation late into the spring and sum-mer. However, this seems again unlikely given the rapidity of NOx cycling and oxidative loss at Dome C during this time (Frey et al., 2013; Legrand et al., 2009).
Alternatively, the discrepancy may originate from an sys-tematic error in the 117O values assigned to tropospheric ozone, specifically at Dome C (Fig. 3). In a 3-D global mod-eling exercise of117O(NO−3), Alexander et al. (2009) were able to reconcile modeling and observation only by assuming a bulk composition of ozone at117O=35 ‰ instead of the 25 ‰ generally assumed for the tropospheric ozone. While such high values would also solve our discrepancy, all obser-vations and measurements published thus far are consistently closer to 25 ‰ than 35 ‰ (Vicars and Savarino, 2014; John-ston and Thiemens, 1997; Krankowsky et al., 1995). Given the low variability in the measurements observed at Dome C (Fig. 3) and elsewhere (Vicars and Savarino, 2014), if atmo-spheric measurements are underestimated, it should be by a systematic error common to both the liquid helium con-densation or coated filter techniques. In the absence of such demonstration, we believe that the model–measurement dis-crepancy is likely due to false assumptions regarding NOx chemistry or 17Oexcess transfer mechanisms. Equally, it is
While it is presently difficult to determine the precise na-ture of the process(es) leading to the relatively large 17 O-excess values observed for atmospheric nitrate at Dome C, the correlation observed between the δ15N and 117O val-ues of atmospheric nitrate (see Sect. 3.1) provides at least one direct line of evidence that the high 117O(NO−3) val-ues observed during spring and early summer could be asso-ciated with snowpack emissions of NOx. Considering only samples collected at Dome C between October and Decem-ber, both those reported here and those collected in 2009 and described by Erbland et al. (2013), a strong anticorre-lation (r= −0.90) is observed between theδ15N and117O values of atmospheric nitrate (Fig. 8). In other words, the atmospheric nitrate sampled in early spring, which is heav-ily depleted in 15N due its formation from NOx emissions arising from a winter-nitrified snowpack, possessed consis-tently higher117O values than the nitrate sampled directly after this period. Conversely, in summer, atmospheric ni-trate possesses a lower 117O and is15N enriched with re-spect to early spring values as it is formed from a snowpack that has suffered several stages of denitrification, leading to
15N enrichment of the snowpack and the emitted NOx. This
finding suggests that the mechanism producing enhanced
117O(NO−3)values observed during early spring is tightly coupled in time and space with the intensity of NOx emis-sions from the snowpack, an observation very similar to that of Morin et al. (2012), who detected a similar relationship be-tweenδ15N and117O for atmospheric nitrate in the spring-time boundary layer over Barrow, Alaska (71◦N). The au-thors of that study attributed the observed correlation to the coupling of snowpack NOx emissions and reactive halogen chemistry, suggesting that these two processes were interre-lated and mutually strengthening. In the case of the OPALE 2011–2012 data, the correlation between δ15N and 117O could arise from any of the potential pathways previously discussed. For example, as proposed by Morin et al. (2012), the R8 and R9 pathways may be enhanced during the pe-riod of polar sunrise. Alternatively, a correlation could result from an increased contribution to total OH production from the photolysis of HONO, which is co-emitted with NOx via nitrate photochemistry (Grannas et al., 2007) and may induce a larger17O excess in OH as compared to the conventional O(1D)+H2O pathway. Furthermore, the hydrolysis of NO2
in snow, should it contribute significantly to nitrate produc-tion at Dome C, is likely amplified during periods when con-centrations NO2are high in the snowpack interstitial air due
to nitrate/nitrite photochemistry. Therefore, while the pro-cesses responsible for driving the formation of atmospheric nitrate at Dome C during summer cannot be unambiguously identified, the isotopic results presented here clearly indicate that snowpack emissions result in enhanced117O transfer to nitrate. Our understanding of NOxchemistry above the snow surface at Dome C is therefore incomplete.
r = -0.90
26 27 28 29 30 31 32 33 34
-50 -40 -30 -20 -10 0 10 20
Δ
17
O
(‰)
δ
15N (‰)
Oct - Dec 2009 (Erbland et al., 2013)
Oct - Dec 2011 (This study)
Figure 8.Relationship observed between theδ15N and117O val-ues of atmospheric nitrate present at Dome C between October and December during both the 2009 and 2011 summer campaigns. Error bars indicate the typical analytical uncertainties associated with the measurements.
5 Conclusions
Constraining the propagation of ozone’s17O-excess signa-ture within the NOxcycle is critical in polar areas where the opportunity is offered to extend atmospheric investigations based on 117O measurements to the glacial–interglacial timescale using deep ice core records of nitrate. However, the factors governing the present-day isotopic composition of atmospheric nitrate over the Antarctic Plateau remain poorly understood, primarily due to the complex nature of the boundary layer photochemistry initiated during spring by NOxemissions from the snowpack.
An isotopic mass balance performed for atmospheric ni-trate during December 2011, informed by in situ oxidant con-centration measurements conducted within the framework of the OPALE field study, suggests the existence of an unex-pected process bypassing the commonly accepted daytime chemistry of NO2(i.e., NO2+OH) that contributes
signifi-cantly to the atmospheric nitrate budget over Dome C. The strong negative correlation observed between theδ15N and
117O values of nitrate between October and December sug-gests that this unknown process scales with the intensity of the snowpack photochemistry. Potential explanations for this observation include (i) an increased117O transfer from OH due to its formation from the photolysis of HONO re-leased from the snowpack, (ii) heterogeneous hydrolysis of NO2 due to the high concentrations of NO2 in the
snow-pack interstitial air, and (iii) the co-emission of reactive halo-gen species that act as an intermediate in the transfer of
lines of evidence presented here, we hypothesize that this discrepancy is due to an unknown or misunderstood com-ponent of the NOx photochemical cycle over the Antarctic Plateau. Further research is needed to solve the many incon-sistencies (e.g., high NO2/NO ratio, high concentration of
NO2, unresolved HONO atmospheric concentration,
inter-ference such as HO2NO2, isotope mass balance) observed
during the OPALE experiments.
The Supplement related to this article is available online at doi:10.5194/acp-16-2659-2016-supplement.
Acknowledgements. The research leading to these results received
funding from the European Community’s Seventh Framework Programme (FP7/2007-2013) under the grant agreement number 237890. We would like to thank INSU for its financial support for lab experiments through its LEFE program. The Agence nationale de la recherche (ANR) is gratefully acknowledged for its financial support through the OPALE project (contract NT09-451281). The Institute Polaire Paul-Emile Victor (IPEV) supported the research and polar logistics through the program SUNITEDC No. 1011. This work has been partially supported by a grant from Labex OSUG@2020 (Investissements d’avenir – ANR10 LABX56). We would also like to thank all the field team members present during the OPALE campaign. Meteorological data were obtained from “IPEV/PNRA: Routine Meteorological Observation at Station Concordia”. B. Alexander and the anonymous reviewer are acknowledged for their critical comments and suggestions, which helped in improving the manuscript. Data are available in the Supplement.
Edited by: T. Röckmann
References
Adon, M., Galy-Lacaux, C., Yoboué, V., Delon, C., Lacaux, J. P., Castera, P., Gardrat, E., Pienaar, J., Al Ourabi, H., Laouali, D., Diop, B., Sigha-Nkamdjou, L., Akpo, A., Tathy, J. P., Lavenu, F., and Mougin, E.: Long term measurements of sulfur diox-ide, nitrogen dioxdiox-ide, ammonia, nitric acid and ozone in Africa using passive samplers, Atmos. Chem. Phys., 10, 7467-7487, doi:10.5194/acp-10-7467-2010, 2010.
Alexander, B., Savarino, J., Kreutz, K., and Thiemens, M. H.: Im-pact of preindustrial biomass-burning emissions on the oxidative pathways of tropospheric sulfur and nitrogen, J. Geophys. Res., 109, D08303, doi:10.1029/2003JD004218, 2004.
Alexander, B., Hastings, M. G., Allman, D. J., Dachs, J., Thorn-ton, J. A., and Kunasek, S. A.: Quantifying atmospheric nitrate formation pathways based on a global model of the oxygen iso-topic composition (117O) of atmospheric nitrate, Atmos. Chem. Phys., 9, 5043–5056, doi:10.5194/acp-9-5043-2009, 2009. Anastasio, C. and Chu, L.: Photochemistry of Nitrous Acid
(HONO) and Nitrous Acidium Ion (H2ONO+) in Aqueous
Solution and Ice, Environ. Sci. Technol., 43, 1108–1114, doi:10.1021/es802579a, 2009.
Atkinson, R., Baulch, D. L., Cox, R. A., Crowley, J. N., Hamp-son, R. F., Hynes, R. G., Jenkin, M. E., Rossi, M. J., and Troe, J.: Evaluated kinetic and photochemical data for atmospheric chem-istry: Volume I – gas phase reactions of Ox, HOx, NOxand SOx species, Atmos. Chem. Phys., 4, 1461–1738, doi:10.5194/acp-4-1461-2004, 2004.
Atkinson, R., Baulch, D. L., Cox, R. A., Crowley, J. N., Hampson, R. F., Hynes, R. G., Jenkin, M. E., Rossi, M. J., and Troe, J.: Eval-uated kinetic and photochemical data for atmospheric chemistry: Volume III – gas phase reactions of inorganic halogens, Atmos. Chem. Phys., 7, 981-1191, doi:10.5194/acp-7-981-2007, 2007. Bauguitte, S. J.-B., Bloss, W. J., Evans, M. J., Salmon, R. A.,
An-derson, P. S., Jones, A. E., Lee, J. D., Saiz-Lopez, A., Roscoe, H. K., Wolff, E. W., and Plane, J. M. C.: Summertime NOx mea-surements during the CHABLIS campaign: can source and sink estimates unravel observed diurnal cycles?, Atmos. Chem. Phys., 12, 989–1002, doi:10.5194/acp-12-989-2012, 2012.
Berhanu, T. A., Meusinger, C., Erbland, J., Jost, R., Bhattacharya, S. K., Johnson, M. S., and Savarino, J.: Laboratory study of nitrate photolysis in Antarctic snow. II. Isotopic effects and wavelength dependence, J. Chem. Phys., 140, 244305, doi:10.1063/1.4882899, 2014.
Bhattacharya, S. K., Pandey, A., and Savarino, J.: Determina-tion of intramolecular isotope distribuDetermina-tion of ozone by oxida-tion reacoxida-tion with silver metal, J. Geophys. Res., 113, D03303, doi:10.1029/2006jd008309, 2008.
Bloss, W. J., Camredon, M., Lee, J. D., Heard, D. E., Plane, J. M. C., Saiz-Lopez, A., Bauguitte, S. J.-B., Salmon, R. A., and Jones, A. E.: Coupling of HOx, NOxand halogen chemistry in the antarctic boundary layer, Atmos. Chem. Phys., 10, 10187– 10209, doi:10.5194/acp-10-10187-2010, 2010.
Bolton, D.: The Computation of Equivalent Potential Temperature, Mon. Weather Rev., 108, 1046–1053, 1980.
Casciotti, K. L., Sigman, D. M., Galanter Hastings, M., Böhlke, J. K., and Hilkert, A.: Measurement of the Oxygen Isotopic Com-position of Nitrate in Seawater and Freshwater Using the Deni-trifier Method, Anal. Chem., 74, 4905–4912, 2002.
Chen, G., Davis, D., Crawford, J., Nowak, J. B., Eisele, F., Mauldin, R. L., Tanner, D., Buhr, M., Shetter, R., Lefer, B., Arimoto, R., Hogan, A., and Blake, D.: An investigation of South Pole HOx chemistry: Comparison of model results with ISCAT observations, Geophys. Res. Lett., 28, 3633–3636, doi:10.1029/2001GL013158, 2001.
Chen, G., Davis, D., Crawford, J., Hutterli, L. M., Huey, L. G., Slusher, D., Mauldin, L., Eisele, F., Tanner, D., Dibb, J., Buhr, M., McConnell, J., Lefer, B., Shetter, R., Blake, D., Song, C. H., Lombardi, K., and Arnoldy, J.: A reassess-ment of HOx South Pole chemistry based on observations recorded during ISCAT 2000, Atmos. Environ., 38, 5451–5461, doi:10.1016/j.atmosenv.2003.07.018, 2004.
Coplen, T. B.: Guidelines and recommended terms for expression of stable-isotope-ratio and gas-ratio measurement results, Rapid Commun. Mass Sp., 25, 2538–2560, doi:10.1002/rcm.5129, 2011.
ozone at the South Pole surface, Geophys. Res. Lett., 28, 3641– 3644, doi:10.1029/2001GL013055, 2001.
Crowley, J. N., Ammann, M., Cox, R. A., Hynes, R. G., Jenkin, M. E., Mellouki, A., Rossi, M. J., Troe, J., and Wallington, T. J.: Evaluated kinetic and photochemical data for atmospheric chem-istry: Volume V – heterogeneous reactions on solid substrates, Atmos. Chem. Phys., 10, 9059–9223, doi:10.5194/acp-10-9059-2010, 2010.
Davis, D., Nowak, J. B., Chen, G., Buhr, M., Arimoto, R., Hogan, A., Eisele, F., Mauldin, L., Tanner, D., Shetter, R., Lefer, B., and McMurry, P.: Unexpected high levels of NO observed at South Pole, Geophys. Res. Lett., 28, 3625–3628, doi:10.1029/2000GL012584, 2001.
Davis, D., Seelig, J., Huey, G., Crawford, J., Chen, G., Wang, Y., Buhr, M., Helmig, D., Neff, W., and Blake, D.: A reassessment of Antarctic plateau reactive nitrogen based on ANTCI 2003 airborne and ground based measurements, Atmos. Environ., 42, 2831–2848, doi:10.1016/j.atmosenv.2007.07.039, 2008. Dibb, J.: Soluble reactive nitrogen oxides at South Pole
during ISCAT 2000, Atmos. Environ., 38, 5399–5409, doi:10.1016/j.atmosenv.2003.01.001, 2004.
Dubey, M. K., Mohrschladt, R., Donahue, N. M., and Anderson, J. G.: Isotope specific kinetics of hydroxyl radical (OH) with water (H2O): Testing models of reactivity and atmospheric fractiona-tion, J. Phys. Chem., 101, 1494–1500, 1997.
EPICA community members: Eight glacial cycles from an Antarctic ice core, Nature, 429, 623–628, doi:10.1038/nature02599, 2004. Erbland, J., Vicars, W. C., Savarino, J., Morin, S., Frey, M. M., Frosini, D., Vince, E., and Martins, J. M. F.: Air–snow transfer of nitrate on the East Antarctic Plateau – Part 1: Isotopic evi-dence for a photolytically driven dynamic equilibrium in sum-mer, Atmos. Chem. Phys., 13, 6403–6419, doi:10.5194/acp-13-6403-2013, 2013.
Fan, S.-M. and Jacob, D. J.: Surface ozone depletion in Arctic spring sustained by bromine reactions on aerosols, Nature, 359, 522–524, 1992.
Feilberg, K. L., Johnson, M. S., and Nielsen, C. J.: Relative rates of reaction of 13C16O, 12C18O, 12C17O and 13C18O with OH and OD radicals, Phys. Chem. Chem. Phys., 7, 2318, doi:10.1039/b503350k, 2005.
Finlayson-Pitts, B. J.: Reactions at surfaces in the atmosphere: integration of experiments and theory as necessary (but not necessarily sufficient) for predicting the physical chem-istry of aerosols, Phys. Chem. Chem. Phys., 11, 7760–7779, doi:10.1039/b906540g, 2009.
France, J. L., King, M. D., Frey, M. M., Erbland, J., Picard, G., Preunkert, S., MacArthur, A., and Savarino, J.: Snow optical properties at Dome C (Concordia), Antarctica; implications for snow emissions and snow chemistry of reactive nitrogen, At-mos. Chem. Phys., 11, 9787–9801, doi:10.5194/acp-11-9787-2011, 2011.
Frey, M. M., Savarino, J., Morin, S., Erbland, J., and Martins, J. M. F.: Photolysis imprint in the nitrate stable isotope signal in snow and atmosphere of East Antarctica and implications for reactive nitrogen cycling, Atmos. Chem. Phys., 9, 8681–8696, doi:10.5194/acp-9-8681-2009, 2009.
Frey, M. M., Brough, N., France, J. L., Anderson, P. S., Traulle, O., King, M. D., Jones, A. E., Wolff, E. W., and Savarino, J.: The diurnal variability of atmospheric nitrogen oxides (NO and
NO2) above the Antarctic Plateau driven by atmospheric
stabil-ity and snow emissions, Atmos. Chem. Phys., 13, 3045–3062, doi:10.5194/acp-13-3045-2013, 2013.
Frey, M. M., Roscoe, H. K., Kukui, A., Savarino, J., France, J. L., King, M. D., Legrand, M., and Preunkert, S.: Atmospheric ni-trogen oxides (NO and NO2) at Dome C, East Antarctica, dur-ing the OPALE campaign, Atmos. Chem. Phys., 15, 7859–7875, doi:10.5194/acp-15-7859-2015, 2015.
Gane, M. P., Williams, N. A., and Sodeau, J. R.: A reflection-absorption infrared spectroscopy (RAIRS) investigation of the low-temperature heterogeneous hydrolysis of bromine nitrate, J. Phys. Chem. A, 105, 4002–4009, 2001.
Geyh, A., Wolfson, J. M., and Koutrakis, P.: Development and Eval-uation of a Small Active Ozone Sampler, Environ. Sci. Technol., 31, 2326–2330, 1997.
Granger, J. and Sigman, D. M.: Removal of nitrite with sul-famic acid for nitrate N and O isotope analysis with the den-itrifier method, Rapid Commun. Mass Sp., 23, 3753–3762, doi:10.1002/rcm.4307, 2009.
Grannas, A. M., Jones, A. E., Dibb, J., Ammann, M., Anastasio, C., Beine, H. J., Bergin, M., Bottenheim, J., Boxe, C. S., Carver, G., Chen, G., Crawford, J. H., Dominé, F., Frey, M. M., Guzmán, M. I., Heard, D. E., Helmig, D., Hoffmann, M. R., Honrath, R. E., Huey, L. G., Hutterli, M., Jacobi, H. W., Klán, P., Lefer, B., McConnell, J., Plane, J., Sander, R., Savarino, J., Shepson, P. B., Simpson, W. R., Sodeau, J. R., von Glasow, R., Weller, R., Wolff, E. W., and Zhu, T.: An overview of snow photochemistry: evi-dence, mechanisms and impacts, Atmos. Chem. Phys., 7, 4329– 4373, doi:10.5194/acp-7-4329-2007, 2007.
Hastings, M. G., Sigman, D. M., and Steig, E. J.: Glacial/interglacial changes in the isotopes of nitrate from the Greenland Ice Sheet Project 2 (GISP2) ice core, Global Biogeochem. Cy., 19, GB4024, doi:10.1029/2005gb002502, 2005.
Hastings, M. G., Jarvis, J. C., and Steig, E. J.: Anthropogenic impacts on nitrogen isotopes of ice-core nitrate, Science, 324, 1288–1288, doi:10.1126/science.1170510, 2009.
Honrath, R. E., Peterson, M. C., Guo, S., Dibb, J. E., Shepson, P. B., and Campbell, B.: Evidence of NOxproduction within or upon ice particles in the Greenland snowpack, Geophys. Res. Lett., 26, 695–698, 1999.
Honrath, R. E., Guo, S., Peterson, M. C., Dziobak, M. P., Dibb, J. E., and Arsenault, M. A.: Photochemical production of gas phase NOxfrom ice crystal NO3, J. Geophys. Res., 105, 24183–24190,
2000.
Hutterli, M. A., McConnell, J. R., Bales, R. C., and Stewart, R. W.: Sensitivity of hydrogen peroxide (H2O2) and formaldehyde
(HCHO) preservation in snow to changing environmental condi-tions: Implications for ice core records, J. Geophys. Res.-Atmos., 108, 4023, doi:10.1029/2002JD002528, 2003.
Jacobi, H. W. and Hilker, B.: A mechanism for the photochemical transformation of nitrate in snow, J. Photoch. Photobiol. A, 185, 371–382, doi:10.1016/j.jphotochem.2006.06.039, 2007. Janssen, C. and Tuzson, B.: A diode laser spectrometer for
symme-try selective detection of ozone isotopomers, Appl. Phys. B, 82, 487–494, doi:10.1007/s00340-005-2044-6, 2006.
Johnston, J. C. and Thiemens, M. H.: The isotopic composition of tropospheric ozone in three environments, J. Geophys. Res., 102, 25395–25404, 1997.
Jones, A. E., Weller, R., Wolff, E. W., and Jacobi, H.-W.: Speciation and rate of photochemical NO and NO2production in Antarctica
snow, Geophys. Res. Lett., 27, 345–348, 2000.
Jones, A. E., Weller, R., Anderson, P. S., Jacobi, H. W., Wolff, E. W., Schrems, O., and Miller, H.: Measurements of NOx emissions from the Antarctic snowpack, Geophys. Res. Lett., 28, 1499– 1502, 2001.
Jourdain, B., Preunkert, S., Cerri, O., Castebrunet, H., Udisti, R., and Legrand, M.: Year-round record of size-segregated aerosol composition in central Antarctica (Concordia station): Implica-tions for the degree of fractionation of sea-salt particles, J. Geo-phys. Res., 113, D14308, doi:10.1029/2007jd009584, 2008. Kaiser, J., Hastings, M. G., Houlton, B. Z., Röckmann, T., and
Sigman, D. M.: Triple oxygen isotope analysis of nitrate using the denitrifier method and thermal decomposition of N2O, Anal.
Chem., 79, 599–607, 2007.
Koutrakis, P., Wolfson, J. M., Bunyaviroch, A., Froehlich, S. E., Hirano, K., and Muliki, J. D.: Measurement of Ambient Ozone Using a Nitrite-Coated Filter, Anal Chem, 65, 209–214, 1993. Krankowsky, D., Bartecki, F., Klees, G. G., Mauersberger, K.,
Schellenbach, K., and Stehr, J.: Measurement of heavy iso-tope enrichment in tropospheric ozone, Geophys. Res. Lett., 22, 1713–1716, 1995.
Krzyzanowski, J.: Ozone variation with height in a forest canopy – results from a passive sampling field campaign, Atmos. Environ., 38, 5957–5962, doi:10.1016/j.atmosenv.2004.07.017, 2004. Kukui, A., Legrand, M., Preunkert, S., Frey, M. M., Loisil, R.,
Gil Roca, J., Jourdain, B., King, M. D., France, J. L., and An-cellet, G.: Measurements of OH and RO2 radicals at Dome
C, East Antarctica, Atmos. Chem. Phys., 14, 12373–12392, doi:10.5194/acp-14-12373-2014, 2014.
Legrand, M., Preunkert, S., Jourdain, B., Gallée, H., Goutail, F., Weller, R., and Savarino, J.: Year-round record of sur-face ozone at coastal (Dumont d’Urville) and inland (Concor-dia) sites in East Antarctica, J. Geophys. Res., 114, D20306, doi:10.1029/2008jd011667, 2009.
Legrand, M., Preunkert, S., Frey, M., Bartels-Rausch, Th., Kukui, A., King, M. D., Savarino, J., Kerbrat, M., and Jourdain, B.: Large mixing ratios of atmospheric nitrous acid (HONO) at Concordia (East Antarctic Plateau) in summer: a strong source from surface snow?, Atmos. Chem. Phys., 14, 9963–9976, doi:10.5194/acp-14-9963-2014, 2014.
Legrand, M., Preunkert, S., Savarino, J., Frey, M. M., Kukui, A., Helmig, D., Jourdain, B., Jones, A., Weller, R., Brough, N., and Gallée, H.: Inter-annual variability of surface ozone at coastal (Dumont d’Urville, 2004–2014) and inland (Concordia, 2007– 2014) sites in East Antarctica, Atmos. Chem. Phys. Discuss., doi:10.5194/acp-2016-95, in review, 2016.
Liao, W. and Tan, D.: 1-D Air-snowpack modeling of atmospheric nitrous acid at South Pole during ANTCI 2003, Atmos. Chem. Phys., 8, 7087–7099, doi:10.5194/acp-8-7087-2008, 2008. Luz, B. and Barkan, E.: Variations of 17O/16O and18O/16O in
meteoric waters, Geochim. Cosmochim. Ac., 74, 6276–6286, doi:10.1016/j.gca.2010.08.016, 2010.
Mauldin, R. L., Eisele, F. L., Tanner, D. J., Kosciuch, E., Shetter, R., Lefer, B., Hall, S. R., Nowak, J. B., Buhr, M., Chen, G., Wang,
P., and Davis, D.: Measurements of OH, H2SO4, and MSA at the
South Pole during ISCAT, Geophys. Res. Lett., 28, 3629–3632, 2001.
McCabe, J. R., Boxe, C. S., Colussi, A. J., Hoffman, M. R., and Thiemens, M. H.: Oxygen isotopic fractionation in the photo-chemistry of nitrate in water and ice, J. Geophys. Res., 110, D15310, 10.1029/2004jd005484, 2005.
McCabe, J. R., Thiemens, M. H., and Savarino, J.: A record of ozone variability in South Pole Antarctic snow: Role of nitrate oxygen isotopes, J. Geophys. Res., 112, D12303, doi:10.1029/2006jd007822, 2007.
McNamara, J. P. and Hillier, I. H.: Mechanism of the hydrolysis of halogen nitrates in small water clusters studied by electronic structure methods, J. Phys. Chem. A, 105, 7011–7024, 2001. Michalski, G., Savarino, J., Bohlke, J. K., and Thiemens, M.:
Deter-mination of the total oxygen isotopic composition of nitrate and the calibration of a Delta O-17 nitrate reference material, Anal. Chem., 74, 4989–4993, doi:10.1021/ac0256282, 2002.
Michalski, G., Scott, Z., Kabiling, M., and Thiemens, M. H.: First measurements and modeling of 117O in atmospheric nitrate, Geophys. Res. Lett., 30, 1870, doi:10.1029/2003gl017015, 2003. Michalski, G., Böhlke, J. K., and Thiemens, M.: Long term atmo-spheric deposition as the source of nitrate and other salts in the Atacama Desert, Chile: New evidence from mass-independent oxygen isotopic compositions, Geochim. Cosmochim. Ac., 68, 4023–4038, doi:10.1016/j.gca.2004.04.009, 2004.
Michalski, G., Bhattacharya, S. K., and Girsch, G.: NOxcycle and the tropospheric ozone isotope anomaly: an experimental inves-tigation, Atmos. Chem. Phys., 14, 4935–4953, doi:10.5194/acp-14-4935-2014, 2014.
Morin, S., Savarino, J., Bekki, S., Gong, S., and Bottenheim, J. W.: Signature of Arctic surface ozone depletion events in the isotope anomaly (117O) of atmospheric nitrate, Atmos. Chem. Phys., 7, 1451–1469, doi:10.5194/acp-7-1451-2007, 2007.
Morin, S., Savarino, J., Yan, N., Frey, M. M., Bottenheim, J., Bekki, S., and Martins, J.: Tracing the origin and fate of NOx in the Arctic atmosphere using stable isotopes, Science, 322, 730–732, doi:10.1126/science.1161910, 2008.
Morin, S., Savarino, J., Frey, M. M., Domine, F., Jacobi, H. W., Kaleschke, L., and Martins, J. M. F.: Comprehensive isotopic composition of atmospheric nitrate in the Atlantic Ocean bound-ary layer from 65◦S to 79◦N, J. Geophys. Res., 114, D05303, doi:10.1029/2008jd010696, 2009.
Morin, S., Sander, R., and Savarino, J.: Simulation of the diur-nal variations of the oxygen isotope anomaly (117O) of reac-tive atmospheric species, Atmos. Chem. Phys., 11, 3653–3671, doi:10.5194/acp-11-3653-2011, 2011.
Morin, S., Erbland, J., Savarino, J., Domine, F., Bock, J., Friess, U., Jacobi, H. W., Sihler, H., and Martins, J. M. F.: An isotopic view on the connection between photolytic emissions of NOxfrom the Arctic snowpack and its oxidation by reactive halogens, J. Geo-phys. Res.-Atmos., 117, D00R08, doi:10.1029/2011jd016618, 2012.