ACPD
15, 24041–24083, 2015Oxygen isotope mass balance of atmospheric nitrate at Dome C during the
OPALE campaign
J. Savarino et al.
Title Page
Abstract Introduction
Conclusions References
Tables Figures
◭ ◮
◭ ◮
Back Close
Full Screen / Esc
Printer-friendly Version
Interactive Discussion
Discussion
P
a
per
|
Discussion
P
a
per
|
Discussion
P
a
per
|
Discussion
P
a
per
|
Atmos. Chem. Phys. Discuss., 15, 24041–24083, 2015 www.atmos-chem-phys-discuss.net/15/24041/2015/ doi:10.5194/acpd-15-24041-2015
© Author(s) 2015. CC Attribution 3.0 License.
This discussion paper is/has been under review for the journal Atmospheric Chemistry and Physics (ACP). Please refer to the corresponding final paper in ACP if available.
Oxygen isotope mass balance of
atmospheric nitrate at Dome C, East
Antarctica, during the OPALE campaign
J. Savarino1,2, W. C. Vicars1,2,a, M. Legrand1,2, S. Preunkert1,2, B. Jourdain1,2,
M. M. Frey3, A. Kukui4,5, N. Caillon1,2, and J. Gil Roca4,5
1
Université Grenoble Alpes, Laboratoire de Glaciologie et Géophysique de l’Environnement (LGGE), 38000 Grenoble, France
2
CNRS, Laboratoire de Glaciologie et Géophysique de l’Environnement (LGGE), 38000 Grenoble, France
3
British Antarctic Survey, Natural Environment Research Council, Cambridge, UK
4
Laboratoire Atmosphère, Milieux et Observations Spatiales (LATMOS), UMR8190,
CNRS-Université de Versailles Saint Quentin, Université Pierre et Marie Curie, Paris, France
5
Laboratoire de Physique et Chimie de l’Environnement et de l’Espace (LPC2E), UMR6115 CNRS-Université d’Orléans, 45071 Orléans CEDEX 2, France
a
ACPD
15, 24041–24083, 2015Oxygen isotope mass balance of atmospheric nitrate at Dome C during the
OPALE campaign
J. Savarino et al.
Title Page
Abstract Introduction
Conclusions References
Tables Figures
◭ ◮
◭ ◮
Back Close
Full Screen / Esc
Printer-friendly Version
Interactive Discussion
Discussion
P
a
per
|
Discussion
P
a
per
|
Discussion
P
a
per
|
Discussion
P
a
per
|
Received: 26 June 2015 – Accepted: 11 August 2015 – Published: 7 September 2015
Correspondence to: J. Savarino ([email protected])
ACPD
15, 24041–24083, 2015Oxygen isotope mass balance of atmospheric nitrate at Dome C during the
OPALE campaign
J. Savarino et al.
Title Page
Abstract Introduction
Conclusions References
Tables Figures
◭ ◮
◭ ◮
Back Close
Full Screen / Esc
Printer-friendly Version
Interactive Discussion
Discussion
P
a
per
|
Discussion
P
a
per
|
Discussion
P
a
per
|
Discussion
P
a
per
|
Abstract
Variations in the stable oxygen isotope composition of atmospheric nitrate act as novel tools for studying oxidative processes taking place in the troposphere. They provide both qualitative and quantitative constraints on the pathways determining the fate of at-mospheric nitrogen oxides (NO+NO2=NOx). The unique and distinctive
17
O-excess 5
(∆17O=δ17O−0.52×δ18O) of ozone, which is transferred to NOx via oxidation, is a
particularly useful isotopic fingerprint in studies of NOx transformations. Constraining the propagation of17O-excess within the NOxcycle is critical in polar areas where there exists the possibility of extending atmospheric investigations to the glacial/interglacial time scale using deep ice core records of nitrate. Here we present measurements of 10
the comprehensive isotopic composition of atmospheric nitrate collected at Dome C (East Antarctic plateau) during the austral summer of 2011/12. Nitrate isotope analysis has been here combined for the first time with key precursors involved in nitrate produc-tion (NOx, O3, OH, HO2, RO2, etc.) and direct observations of the transferrable∆17O of surface ozone, which was measured at Dome C throughout 2012 using our recently 15
developed analytical approach. Assuming that nitrate is mainly produced in Antarctica in summer through the OH+NO2pathway and using concurrent measurements of OH and NO2, we calculated a ∆
17
O signature for nitrate in the order of (21–22±3) ‰.
These values are lower than the measured values that ranged between 27 and 31 ‰. This discrepancy between expected and observed∆17O(NO−3) values suggests the ex-20
istence of an unknown process that contributes significantly to the atmospheric nitrate budget over this east Antarctic region.
1 Introduction
The search for ice core proxies related to past change of oxidative properties of the atmosphere is motivated by the need to model simulations of ozone and OH 25
ACPD
15, 24041–24083, 2015Oxygen isotope mass balance of atmospheric nitrate at Dome C during the
OPALE campaign
J. Savarino et al.
Title Page
Abstract Introduction
Conclusions References
Tables Figures
◭ ◮
◭ ◮
Back Close
Full Screen / Esc
Printer-friendly Version
Interactive Discussion
Discussion
P
a
per
|
Discussion
P
a
per
|
Discussion
P
a
per
|
Discussion
P
a
per
|
core reconstructions of oxidants based on H2O2 (Sigg and Neftel, 1991) and HCHO (Staffelbach et al., 1991) measurements were hampered by the occurrence of post-depositional alteration of H2O2 and HCHO concentrations in the upper snowpack
prior to preservation in the ice (Hutterli et al., 2003). More recently, the 17O-excess (∆17O=δ17O−0.52×δ18O) of nitrate, a unique isotopic signature inherited from ozone
5
via bimolecular chemical reactions in the atmosphere, has shown promise as a con-served proxy for past oxidant concentrations (McCabe et al., 2005; Alexander et al., 2004). The∆17O signal of nitrate reflects the relative importance of NOxtransformation mechanisms and recent studies suggest that the measurement of this isotopic signal in ice cores and ancient sediments may provide relevant information regarding the role of 10
ozone in the overall oxidative capacity of the paleo-atmosphere (McCabe et al., 2007; Michalski et al., 2004, 2003; Savarino et al., 2007; Thiemens, 2006). Parallel studies of the nitrogen isotope ratios (δ15N) of nitrate in polar ice and snow suggest that this isotopic tracer may serve as a proxy for past variations in natural sources of atmo-spheric NOx (Hastings et al., 2009, 2005; Jarvis et al., 2008). However, the chemical
15
and physical factors governing the oxygen and nitrogen isotopic composition of atmo-spheric nitrate and its nitrogen oxide precursors are not fully understood (Alexander et al., 2009; Morin et al., 2009). This is particularly true in the polar troposphere, where the UV-photolysis of trace species present in the snowpack or marine aerosols initiates complex boundary layer oxidation processes involving reactive halogen species (Bloss 20
et al., 2010; Grannas et al., 2007; Wang et al., 2007) and results in distinctive∆17O andδ15N signatures in atmospheric nitrate (Morin et al., 2012, 2007, 2008).
Here we present measurements ofδ15N andδ17O and δ18O isotopic composition of atmospheric nitrate collected at Dome C between October 2011 and January 2012. These measurements were conducted within the framework of the OPALE project (Ox-25
ACPD
15, 24041–24083, 2015Oxygen isotope mass balance of atmospheric nitrate at Dome C during the
OPALE campaign
J. Savarino et al.
Title Page
Abstract Introduction
Conclusions References
Tables Figures
◭ ◮
◭ ◮
Back Close
Full Screen / Esc
Printer-friendly Version
Interactive Discussion
Discussion
P
a
per
|
Discussion
P
a
per
|
Discussion
P
a
per
|
Discussion
P
a
per
|
was to reconcile observations of∆17O for atmospheric nitrate at Dome C with quan-titative predictions based on nitrate isotope mass balance and atmospheric chemistry parameters, a unique opportunity offered by the OPALE campaign.
2 Methods
2.1 Site description and scientific context
5
Dome C is situated 3233 m a.s.l. on the East Antarctic Plateau (75◦06′S, 123◦23′E), approximately 1100 km from the coastal research station Dumont d’Urville and 560 km from the Vostok station. Deep ice cores were extracted at Dome C in the frame-work of the European Project for Ice Coring in Antarctica (EPICA) covering approx-imately 800 000 yr (EPICA-community-members, 2004) and Vostok covering the last 10
420 000 years (Petit et al., 1999). In parallel, studies aiming to understand the me-teorological, chemical, and physical factors governing the variability of trace con-stituents preserved in the ice were initiated. This was done for aerosol in the frame-work of the French environmental observation service CESOA (Etude du cycle atmo-sphérique du Soufre en relation avec le climat aux moyennes et hautes latitudes Sud, 15
http://cesoa.ore.fr) dedicated to the study of the sulfur cycle (Jourdain et al., 2008; Preunkert et al., 2008).
Although the Antarctic plateau is extraordinarily dry, cold, and far removed from sources of anthropogenic emissions, first atmospheric measurements of oxidants con-ducted in 1998–1999 during the ISCAT (Investigation of Sulfur Chemistry in the Antarc-20
tic Troposphere) field campaign revealed a high level of photochemical activity. For ex-ample, the average summertime OH concentration (2×106cm−3) over the South Pole
was found to be similar to that of the tropical marine boundary layer (MBL) (Mauldin et al., 2001). Unexpectedly high levels of nitric oxide (NO) were also detected, with concentrations one to two orders of magnitude higher than that typically observed in 25
ACPD
15, 24041–24083, 2015Oxygen isotope mass balance of atmospheric nitrate at Dome C during the
OPALE campaign
J. Savarino et al.
Title Page
Abstract Introduction
Conclusions References
Tables Figures
◭ ◮
◭ ◮
Back Close
Full Screen / Esc
Printer-friendly Version
Interactive Discussion
Discussion
P
a
per
|
Discussion
P
a
per
|
Discussion
P
a
per
|
Discussion
P
a
per
|
concentrations observed at South Pole were a result of the elevated NO level, which catalyzes a rapid cycling of HO2 to OH (Chen et al., 2004, 2001). The high
concen-trations of NOx were also inferred to drive in situ photochemical production of ozone during the ISCAT campaign (Crawford et al., 2001). Surface ozone and NOx mea-surements at Dome C suggest a similar level of enhanced oxidant production during 5
November–January (Frey et al., 2013, 2014; Legrand et al., 2009).
The high levels of photochemical activity observed at South Pole and Dome C are now understood in terms of NOx release from the snowpack (Honrath et al., 2000,
1999; Jones et al., 2001, 2000; Zhou et al., 2001). This process is initiated by the photolysis of nitrate, which can lead to large fluxes of NO2, NO, and HONO from per-10
manently sunlit snow (Anastasio and Chu, 2009; Grannas et al., 2007; Jacobi and Hilker, 2007; Legrand et al., 2014; Frey et al., 2013). Observed and modeled NOx pro-duction rates are largely capable of explaining the high levels of photochemical activity observed on the Antarctic plateau during spring (France et al., 2011; Liao and Tan, 2008; Wang et al., 2007) although detailed and speciation of nitrogen oxides chemistry 15
remain largely unknown in this rich NOx/poor VOCs environment (Kukui et al., 2014; Frey et al., 2014; Legrand et al., 2014; Davis et al., 2008).
2.2 High-volume sampling
Bulk atmospheric samples were collected at Dome C on glass fiber filters using a high-volume air sampler (HVAS), which was installed on a platform 1 m above the ground. 20
The HVAS was run by applying an average STP flow rate of 0.7 m3min−1that ensures the collection of a sufficient amount of nitrate for isotopic analysis. The atmospheric NO−3 collected on glass fiber filters represents the sum of atmospheric particulate NO−3 (pNO−3) and gaseous nitric acid (HNO3) (Frey et al., 2009; Savarino, unpublished data). 11 HVAS samples were obtained during the OPALE campaign (from October 2011 to 25
ACPD
15, 24041–24083, 2015Oxygen isotope mass balance of atmospheric nitrate at Dome C during the
OPALE campaign
J. Savarino et al.
Title Page
Abstract Introduction
Conclusions References
Tables Figures
◭ ◮
◭ ◮
Back Close
Full Screen / Esc
Printer-friendly Version
Interactive Discussion
Discussion
P
a
per
|
Discussion
P
a
per
|
Discussion
P
a
per
|
Discussion
P
a
per
|
extracted in 40 mL of ultra-pure water via centrifugation using Millipore Centricon™filter units. Nitrate concentration was then determined for each filter extract solution using a colorimetric technique (Frey et al., 2009).
2.3 Ozone collection
The nitrite-coated filter technique for ozone isotope analysis has been described in de-5
tail in (Vicars et al., 2012; Vicars and Savarino, 2014). The principle of ozone collection underlying this technique is the filter-based chemical trapping of ozone via aqueous phase reaction with nitrite (Adon et al., 2010; Geyh et al., 1997; Koutrakis et al., 1993; Krzyzanowski, 2004):
NO−2+O3→NO −
3+O2 (R1)
10
By coupling this routine ozone measurement technique with recent analytical devel-opments in the∆17O analysis of nanomole quantities of nitrate (Kaiser et al., 2007), the17O-excess transferred by one of the two O3 terminal atoms through bimolecular
chemical reactions, denoted ∆17O(O3)term, as well as ozone’s bulk ∆ 17
O value, de-noted∆17O(O3)bulk(=2/3×∆17O(O3)termsince all17O-excess is located at the two O3
15
terminal atoms (Bhattacharya et al., 2008; Janssen and Tuzson, 2006), can be inferred from the oxygen isotopic composition of the nitrate produced via R1 within the coated filter matrix.
Ambient ozone collections were performed using an active air sampler consisting of 1/4′′ Teflon™ (PFA) tubing connecting three main sampler components: (i) a stan-20
dard low-volume vacuum pump (Welch™, Model 2522C-02) equipped with a volume counter and needle valve (or flow meter) for flow rate regulation, (ii) a closed PFA fil-ter holder assembly (Savillex™) containing a pre-coated 47 mm glass fiber sampling substrate (Whatman™, GF/A type), and (iii) an open-faced PFA filter holder assembly containing a 47 mm PTFE membrane filter (Zylon™, 5 µm pore size) for the removal of 25
ACPD
15, 24041–24083, 2015Oxygen isotope mass balance of atmospheric nitrate at Dome C during the
OPALE campaign
J. Savarino et al.
Title Page
Abstract Introduction
Conclusions References
Tables Figures
◭ ◮
◭ ◮
Back Close
Full Screen / Esc
Printer-friendly Version
Interactive Discussion
Discussion
P
a
per
|
Discussion
P
a
per
|
Discussion
P
a
per
|
Discussion
P
a
per
|
coated prior to sample collection with 1 mL of a nitrite-based ozone sampling solution (0.1 M NaNO2, 0.05 M K2CO3, 0.1 M glycerol) (Koutrakis et al., 1993), allowed to dry at
75◦C for approximately 10 min, and then stored frozen in the dark in individual plastic PetriSlide™ containers (Millipore™). Samples were collected by loading pre-coated fil-ters into the sampling filter holder, which was then connected to the prefilter (upstream) 5
and needle valve/pump (downstream) and covered in aluminum foil to limit light expo-sure, a step that is necessary to limit the blank production rate during sample collection (Vicars et al., 2012). Air was then pumped through the sampling system at a target flow rate of 3.0 L min−1.
Sampling was conducted during the OPALE campaign (December 2011– 10
January 2012) from a climate-controlled shelter, and a total of 28 samples were col-lected. However, due to difficulties in the application of our analytical technique to the unique environmental conditions encountered in Antarctica, the results obtained from these samples were inconclusive (i.e. unrealistic variability) due to the lack of light pro-tection of the filter holder (Vicars et al., 2012, 2013). Sampling and isotopic analysis of 15
ozone was therefore repeated in 2012, and a complete annual record of∆17O(O3) was
obtained (n=60). Procedural filter blanks were also collected at regular intervals and were subjected to all of the same preparation, storage, handling, and analytical proce-dures as field samples. After sample collection, filter samples and procedural blanks were returned to their containers, which were covered in aluminum foil and stored at 20
−20◦C before processing and analysis.
Filter samples were extracted in 18 mL of deionized water (18.2 MΩ, hereafter re-ferred to as “MQ water”). In order to remove the excess (i.e., unreacted) nitrite reagent from the sample extracts, the solutions were treated with 1 mL of a 1 M sulfamic acid solution and then neutralized with a corresponding addition of high-purity sodium hy-25
ACPD
15, 24041–24083, 2015Oxygen isotope mass balance of atmospheric nitrate at Dome C during the
OPALE campaign
J. Savarino et al.
Title Page
Abstract Introduction
Conclusions References
Tables Figures
◭ ◮
◭ ◮
Back Close
Full Screen / Esc
Printer-friendly Version
Interactive Discussion
Discussion
P
a
per
|
Discussion
P
a
per
|
Discussion
P
a
per
|
Discussion
P
a
per
|
2.4 Isotopic analysis
The comprehensive isotopic composition of nitrate (15N/14N,17O/16O,18O/16O) was measured on a Finnigan™MAT253 isotope ratio mass spectrometer (IRMS), equipped with a GasBench II™ and coupled to an in-house built nitrate interface (Morin et al., 2009). Nitrate in both the nitrite-coated filter and aerosol sample extracts was prepared 5
for isotopic analysis by conversion to N2O via the bacterial denitrifier method (Casciotti
et al., 2002; Kaiser et al., 2007; Michalski et al., 2002; Sigman et al., 2001). The de-tailed analytical procedure has been described elsewhere (see Morin et al., 2009) and is here briefly presented.
Denitrifying bacteria (Pseudomonas aureofaciens) were cultured in nitrate-amended 10
soy broth and incubated for 5 days in stoppered glass bottles. Bacterial cultures, after concentration by centrifugation and re-suspension, were dispensed as 2 mL aliquots into 20 mL glass vials, which were then crimped and purged with helium for 3 h. Ap-proximately 100 nmol of sample nitrate was then injected into the purged vials and conversion of the sample nitrate to nitrous oxide (N2O) via bacterial denitrification was 15
allowed to proceed overnight. The N2O sample was then cryo-focused in a liquid
ni-trogen trap and introduced into a gold furnace where it was thermally decomposed at 900◦
C into O2 and N2. Following separation via gas chromatography, the O2 and N2sample gases were directed into the ionization chamber of the IRMS. All analytical
steps were simultaneously performed on nitrate isotopic standards and their equimo-20
lar mixtures (International Atomic Energy Agency USGS 32, USGS 34, and USGS 35), which were prepared in an identical background matrix as the samples. Individ-ual analyses were normalized through comparison with these three nitrate reference materials (Coplen, 2011; Werner and Brand, 2001). All isotopic enrichment values for nitrate are reported relative to VSMOW and air N2 for oxygen and nitrogen,
respec-25
ACPD
15, 24041–24083, 2015Oxygen isotope mass balance of atmospheric nitrate at Dome C during the
OPALE campaign
J. Savarino et al.
Title Page
Abstract Introduction
Conclusions References
Tables Figures
◭ ◮
◭ ◮
Back Close
Full Screen / Esc
Printer-friendly Version
Interactive Discussion
Discussion
P
a
per
|
Discussion
P
a
per
|
Discussion
P
a
per
|
Discussion
P
a
per
|
their expected values. For the results reported here, the average uncertainty obtained forδ18O,∆17O, andδ15N were 1.6, 0.5, and 1.0 ‰, respectively.
2.5 Complementary measurements
Concurrent chemical measurements conducted at Dome C during the campaign in-clude HONO (Legrand et al., 2014), HOx (=OH+HO2+RO2) radicals (Kukui et al.,
5
2014), O3(Legrand et al., in preparation) and NO and NO2 (Frey et al., 2014).
Photol-ysis rate coefficients and meteorological parameters were also documented.
3 Results and discussion
3.1 Isotope ratios of ozone and atmospheric nitrate
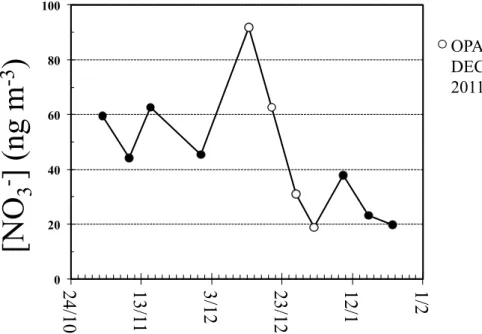
Atmospheric nitrate concentrations observed at Dome C during the campaign are pre-10
sented in Fig. 1, the corresponding nitrate∆17O andδ15N values in Fig. 2. Atmospheric nitrate concentrations ranged between 20 and 90 ng m−3
, with the maximum values oc-curring in mid December 2011, concurrent with the period of intensive of atmospheric sampling of the OPALE field campaign. These values are in good agreement with those observed during the 2007–2008 and 2009–2010 field studies conducted at Dome C by 15
Frey et al. (2009) and Erbland et al. (2013), respectively.
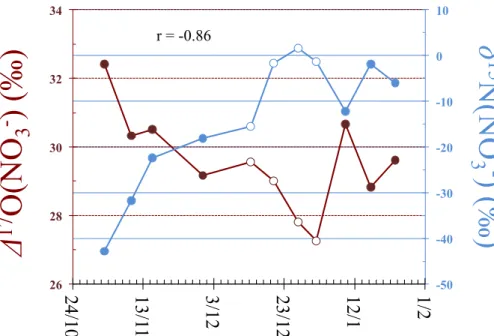
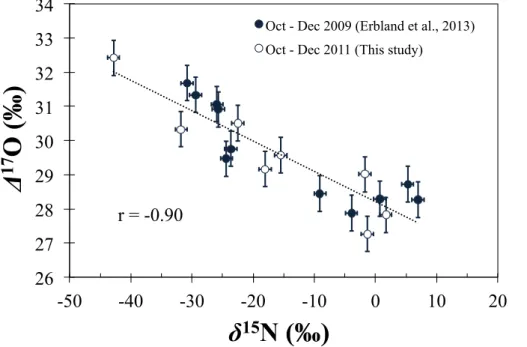
∆17O values for atmospheric nitrate ranged between 27.3 and 32.4 ‰, δ15N be-tween−42.8 and 1.7 ‰. The observed strongly depletedδ15N(NO−
3) values are in good
agreement with those previously reported and having unambiguously attributed to the transformation of local snowpack NOx emissions via photochemistry in the boundary 20
layer, which led to peaks in atmospheric nitrate concentration during the period from October to December (Erbland et al., 2013). As seen in Fig. 2, variations in∆17O and
δ15N were negatively correlated (r value of −0.86) and again show similar amplitude
and phase than those reported in previous studies (Erbland et al., 2013; Frey et al., 2009).
ACPD
15, 24041–24083, 2015Oxygen isotope mass balance of atmospheric nitrate at Dome C during the
OPALE campaign
J. Savarino et al.
Title Page
Abstract Introduction
Conclusions References
Tables Figures
◭ ◮
◭ ◮
Back Close
Full Screen / Esc
Printer-friendly Version
Interactive Discussion
Discussion
P
a
per
|
Discussion
P
a
per
|
Discussion
P
a
per
|
Discussion
P
a
per
|
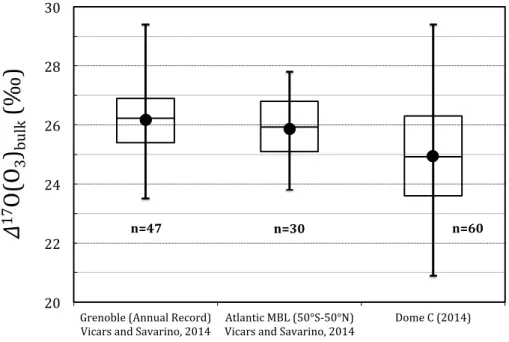
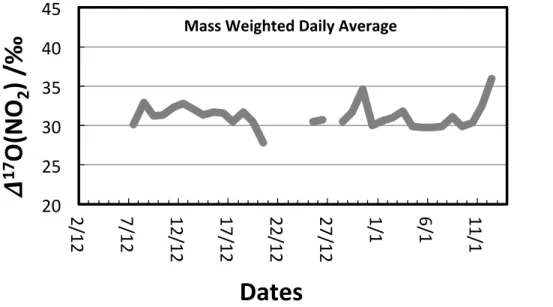
A time series showing the year-round record of∆17O(O3)bulkat Dome C in 2012 is
presented in Fig. 3.∆17O(O3)bulk averaged 24.9±1.9 ‰ over 2012, corresponding to
∆17O(O3)term values of 37.4±1.9 ‰. As shown in Fig. 4, these ∆ 17
O(O3)bulk values
are consistent with those observed in Grenoble (France), as well as with measure-ments conducted along a latitudinal transect from 50◦
S to 50◦
N in the Atlantic Ocean 5
(Vicars and Savarino, 2014). Although the∆17O(O3)bulk seasonal cycle reveals some
interesting features, like the winter maximum, probably in response of the permanent winter darkness and stratospheric air mass intrusions, a complete description is be-yond the scope of the present paper. What should be kept in mind here is the pretty stable∆17O(O3)bulk value close to 26 ‰ that can be considered as representative for
10
the OPALE campaign hold in November–January.
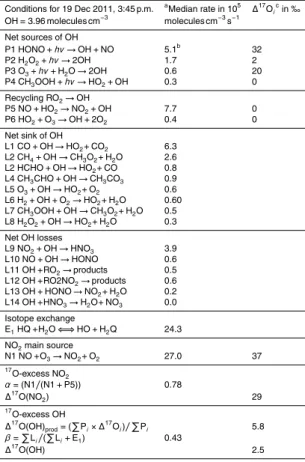
3.2 Nitrate isotope mass balance
The availability of a large database of trace chemical species measurements at Dome C during a portion of the OPALE field campaign (December 2011) offers a unique opportunity to compare observed∆17O(NO−
3) values in the atmosphere to estimated
15
ones calculated from concurrent observations. As discussed at length in recent studies (for example, by Morin et al., 2011 and Vicars et al., 2013), the 17O-excess transfer functions associated with the various nitrate production pathways (i.e., ∆17O(NO−3)i values) can be estimated as a function of the ∆17O of nitrate precursor gases (i.e., NOx, O3, OH, etc.) using mass balance calculations that trace the origin of oxygen
20
atoms transferred during the chemical transformation of NOx in the atmosphere. All atmospheric nitrate production channels involve either NO2or a NOxreservoir species derived from NO2 (e.g., N2O5). The first step in determining the ∆
17
O signature of each pathway is therefore a quantitative assessment of the steady state ∆17O value of NO2, which is typically calculated as a function of the ∆17O value of O3 and the 25
ACPD
15, 24041–24083, 2015Oxygen isotope mass balance of atmospheric nitrate at Dome C during the
OPALE campaign
J. Savarino et al.
Title Page
Abstract Introduction
Conclusions References
Tables Figures
◭ ◮
◭ ◮
Back Close
Full Screen / Esc
Printer-friendly Version
Interactive Discussion
Discussion
P
a
per
|
Discussion
P
a
per
|
Discussion
P
a
per
|
Discussion
P
a
per
|
permanently under sunlight, photochemical inter-conversion of NOx is permanent:
NO2+hv→NO+O (R2)
NO+O3→NO2 (R3)
NO+HO2/RO2→NO2 (R4)
At photochemical steady state (i.e. Reactions R2–R4 being faster than NO2net sink
5
reactions), an assumption that can be reasonably applied throughout the day at Dome C during summer, we have (Morin et al., 2011):
∆17O(NO2)=α×
1.18×∆17(O3)bulk+6.6
(1)
where the term in bracket represents the laboratory deduced anomaly transfer function of the NO+O3 reaction (Savarino et al., 2008), ∆17O(O3)bulk the 17O-excess of the 10
bulk O3andα represents the fraction of the atmospheric NO2reservoir that has been
produced through oxidation by O3rather than HO2/RO2at photochemical equilibrium
(Alexander et al., 2009; Michalski et al., 2003; Morin et al., 2011; Röckmann et al., 2001):
α= kNO+O3[NO][O3]
kNO+O3[NO][O3]+kNO+HO2[NO][HO2]∗
(2) 15
with [HO2] ∗
=[HO2]+[RO2].
It is important to note here that Eqs. (1) and (2) although established under the NOx steady-state approximation, are independent of NO2 concentration for which a bias in
measurement cannot be ruled out. Indeed, as discussed by Frey et al. (2013, 2014), bias in NO2 measurements is suspected partly because it remains difficult to explain 20
the observed ratio of NO2/NO which is systematically higher (up to a factor of 7)
than predicted by calculations made by assuming photochemical steady state con-sidering the NO2 photolysis and reaction of NO with O3, HO2/RO2 and BrO.
Equa-tion (2) also assumes that [HO2]∗
ACPD
15, 24041–24083, 2015Oxygen isotope mass balance of atmospheric nitrate at Dome C during the
OPALE campaign
J. Savarino et al.
Title Page
Abstract Introduction
Conclusions References
Tables Figures
◭ ◮
◭ ◮
Back Close
Full Screen / Esc
Printer-friendly Version
Interactive Discussion
Discussion
P
a
per
|
Discussion
P
a
per
|
Discussion
P
a
per
|
Discussion
P
a
per
|
and R+O2 during the OPALE campaign (Kukui et al., 2014), resulting in the forma-tion of [HO2]∗
devoid of any significant17O-excess (Morin et al., 2011). Using OPALE measurements of NO, O3, OH and HO2/RO2 (Frey et al., 2014; Kukui et al., 2014),
along with temperature dependent reaction kinetics data obtained from (Atkinson et al., 2004), we have calculated the diurnally mass averaged trend in α for the month of 5
December 2011 at Dome C. Measurements of ∆17O(O3)bulk at Dome C during the
OPALE campaign averaged 25±2 ‰, corresponding to∆17O(O3)termvalues of 37±2 ‰
(Fig. 4). Samples collected in December indicate∆17O(O3)bulk values close to 26 ‰
(∆17O(O3)term=3/2×∆ 17
O(O3)bulk=39–40 ‰, Fig. 3), and we have therefore adopted
a ∆17O(O3)term value of 40 ‰ in the subsequent mass balance calculations, in good 10
agreement with the predicted value from a 1-D atmospheric model (Zahn et al., 2006). The diurnally mass average trend in∆17O(NO2) calculated using a∆
17
O(O3)bulkvalue
of 26 ‰ and Eq. (2) is shown in Fig. 5. No trend is observed during the OPALE cam-paign and on average the predicted value is∆17O(NO2)=31±2 ‰ throughout
Decem-ber, corresponding to averageα value of 0.83. In other words, at steady state, the con-15
centrations of O3and HO2∗
measured during OPALE predicts that around 83 % of NO2 is formed via Reaction (R3) (see also Table 1). In the absence of theα dilution effect introduced by the HO2
∗
reaction,∆17O(NO2) would equal 37 ‰, a value 8 ‰ lower than
an estimation obtained from modeling only NOx-O3chemistry at standard temperature and pressure (Michalski et al., 2014). This difference is essentially explained by the 20
use of different∆17O(O3)bulk (32 ‰ Michalski’s simulation, 26 ‰ for our observations),
which possibly correspond to different conditions of the two studies.
By accounting for the origin of the oxygen atom transferred during the conversion of NO2 to nitrate, the∆
17
O signature of the nitrate produced through different reaction mechanisms can be calculated. For summer conditions at Dome C, it is reasonable 25
to assume that the dominant atmospheric nitrate formation pathway is the gas-phase association of NO2and the OH radical (Alexander et al., 2009):
ACPD
15, 24041–24083, 2015Oxygen isotope mass balance of atmospheric nitrate at Dome C during the
OPALE campaign
J. Savarino et al.
Title Page
Abstract Introduction
Conclusions References
Tables Figures
◭ ◮
◭ ◮
Back Close
Full Screen / Esc
Printer-friendly Version
Interactive Discussion
Discussion
P
a
per
|
Discussion
P
a
per
|
Discussion
P
a
per
|
Discussion
P
a
per
|
leading to the following17O-excess mass balance (Michalski et al., 2003 ; Morin et al., 2011):
∆17O(NO− 3)=
2 3∆
17
O(NO2)+
1 3∆
17
O(OH) (3)
In order to predict the∆17O value of the nitrate produced through Reaction (R5) by mass balance, the isotopic composition of tropospheric OH must be known. The OH 5
radical participates in a rapid isotopic exchange with atmospheric water vapor, which represents a very large oxygen reservoir relative to OH, with a∆17O that is negligible compared to ozone or nitrate (Luz and Barkan, 2010). This exchange tends to erase the17O-excess of OH under humidity and temperature conditions typical of the mid-latitudes (Dubey et al., 1997); therefore, the∆17O of OH is normally assumed to be zero 10
in modeling studies applied to these regions. As discussed by Morin et al. (2007), this assumption of∆17O(OH)=0 is not valid under the low humidity conditions encountered in the polar atmosphere. The degree of isotopic equilibration between OH and H2O can
be determined as a function of the relative rates of the isotope exchange reaction and the main OH sink reactions:
15
β= L
L+kH2O+OH[H2O]
(4)
whereLrepresents the total chemical loss rate of OH.βis the factor relating the initial ∆17O transferred to OH upon its formation, denoted∆17O(OH)prod., to its steady state
∆17O value (Morin et al., 2007):
∆17O(OH)=β×∆17O(OH)prod. (5)
20
In plain words, Eqs. (4) and (5) predict that when the isotopic exchange reaction dominates over OH chemical losses (i.e.,β≪1), the steady state∆17O value of OH
will be equal to that of water (i.e.,∆17O≈0 ‰). Conversely, when water vapor
ACPD
15, 24041–24083, 2015Oxygen isotope mass balance of atmospheric nitrate at Dome C during the
OPALE campaign
J. Savarino et al.
Title Page
Abstract Introduction
Conclusions References
Tables Figures
◭ ◮
◭ ◮
Back Close
Full Screen / Esc
Printer-friendly Version
Interactive Discussion
Discussion
P
a
per
|
Discussion
P
a
per
|
Discussion
P
a
per
|
Discussion
P
a
per
|
exchange, then∆17O(OH)= ∆17O(OH)prod.. Kukui et al. (2014), using a Master
Chem-ical Mechanism box model, constrained by the OPALE meteorologChem-ical conditions and concurrent chemical observations, give the rate of the OH chemical sources and sinks. NO2 as measured by Frey et al. (2014) represents at most only ca. 10 % (equivalent
of ca. 1 ‰) of the total sink of OH, which is predominantly dominated by reactions with 5
CO, CH4, aldehydes and to a lesser extent by reactions with O3, H2, and NO. Thus, the possible overestimation of NO2concentration has only a minor effect onβcalculation
and is well embedded within the total uncertainty of such calculation. To assess the value of∆17O(OH), we have computed β for the conditions found during the OPALE campaign using the same 0-D box model that is used to evaluate the budget of OH and 10
RO2 during the OPALE campaign (see Kukui et al., 2014 and Table 1) and used the
exchange kinetic rates given in Dubey et al. (1997). The absolute water vapor concen-tration is deduced from relative humidity and temperature measurements using Bolton, (1980) (i.e. Pwater=6.112×e
(17.67×(T−273)
T−29.5 , withP
water in hPa and T in K). The results of
this calculation (Fig. 6), indicate thatβvaries between 0.70±0.10 (1σ) and 0.30±0.10
15
from midnight to noon for conditions prevailing during the OPALE campaign, suggest-ing that on daily average basis approximately 43 % of the∆17O value originally present in OH is preserved from exchange with H2O, consistent with estimates for an Arctic
site described by Morin et al. (2007).
The value of ∆17O(OH)prod. is more difficult to assess because of the interplay
20
of HOx family and the different sources involved in OH formation. In the rich NOx atmosphere at Dome C in summer, the O(1D)+H2O reaction forming OH is a mi-nor reaction pathway. When multiple pathways are involved in the production of OH, ∆17O(OH)prod. can be estimated by a simple isotope mass balance equation where
∆17O(OH)prod= P
iPi×∆17Oi with Pi the relative production rate of the ith reaction
25
sig-ACPD
15, 24041–24083, 2015Oxygen isotope mass balance of atmospheric nitrate at Dome C during the
OPALE campaign
J. Savarino et al.
Title Page
Abstract Introduction
Conclusions References
Tables Figures
◭ ◮
◭ ◮
Back Close
Full Screen / Esc
Printer-friendly Version
Interactive Discussion
Discussion
P
a
per
|
Discussion
P
a
per
|
Discussion
P
a
per
|
Discussion
P
a
per
|
nificant sources of OH at Dome C during the period of seasonal snowpack emissions (Kukui et al., 2014). However, the measurement of HONO (around pmol mol−1) during OPALE, probably biased by HO2NO2 interference (Legrand et al., 2014) is
incompati-ble with the HOx (=OH+HO2/RO2) radical budget. Best agreement is achieved when HONO at Dome C is assumed to originate from snow emissions with the emission 5
strength evaluated by Legrand et al. (2014). Using a 1-D model, Kukui et al. (2014) show that the concentrations of HONO corresponding to about 20–30 % of measured HONO are consistent with those calculated from the budget analysis of OH radicals with the concentrations of NO2 either calculated from NO measurements assuming
PSS or observed by Frey et al. (2014). Therefore, the production of OH by HONO pho-10
tolysis is adjusted consequently and the 0-D box model (Kukui et al., 2014) is used to calculate all other production rates of OH. Note that even lowering HONO to 20–30 % of the measured values, this species remains the major primary source of radicals at Dome C. Applying the isotope17O-excess transfer (Morin et al., 2011) and the OHprod. isotope mass balance,∆17O(OH)prod. on average equals 5±2 ‰ (1σ). Because the
15
major process leading to the emission of HONO from the snowpack is the photolysis of nitrate, which possesses a∆17O value of approximately 32 ‰, both in the snow “skin layer” (Erbland et al., 2013) and in the top 10 cm of snow (Frey et al., 2009), we have assumed that∆17O(HONO)atm= ∆17O(NO−
3)snowas both oxygen atoms of HONO can
be tracked back to the nitrate. An example of the isotope mass balance calculation 20
is given in Table 1. Figure 7 shows the diurnally-integrated average of the∆17O(OH). ∆17O(OH) varies in a narrow range, between 1 and 3 ‰. An estimation of the∆17O signature for the NO2+OH channel,∆
17
O(NO−3)R2, that accounts for the 17
O-excess carried by the OH radical results in values ranging between 20 and 23 ‰. Averaging over the same time period as the nitrate atmospheric sampling, diurnally-integrated av-25
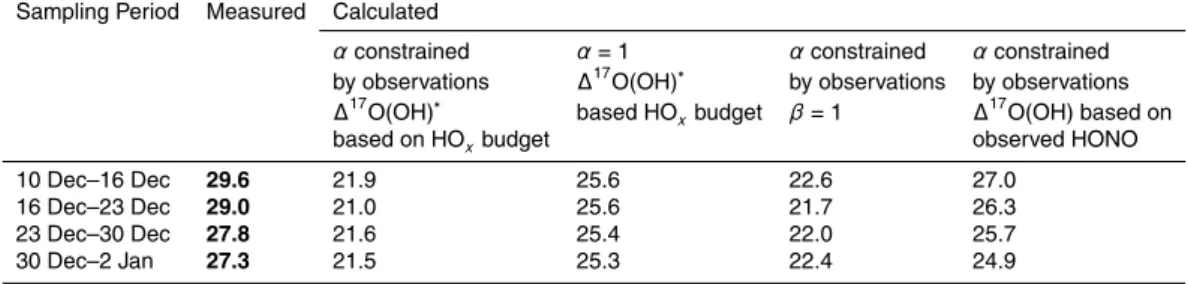
erage∆17O(NO−3) values of 21–22 ‰±3 ‰ can be estimated for December (Table 2).
ob-ACPD
15, 24041–24083, 2015Oxygen isotope mass balance of atmospheric nitrate at Dome C during the
OPALE campaign
J. Savarino et al.
Title Page
Abstract Introduction
Conclusions References
Tables Figures
◭ ◮
◭ ◮
Back Close
Full Screen / Esc
Printer-friendly Version
Interactive Discussion
Discussion
P
a
per
|
Discussion
P
a
per
|
Discussion
P
a
per
|
Discussion
P
a
per
|
served and modeled∆17O(NO−3) is presently unknown. A critical evaluation may offer nevertheless some clues.
4 Discussion
4.1 Alternative sources of NO2
A possible explanation for the underestimation of ∆17O(NO−3) involves the potential 5
role of reactive halogen chemistry in the troposphere over the Antarctic plateau (Bloss et al., 2010; Morin et al., 2008). Reactive halogen oxides (XO=BrO, ClO, IO, etc.) are produced through the reaction of halogen radicals (X) with ozone, a pathway that plays an important role in the catalytic process responsible for ozone depletion events (ODEs) observed in the Arctic boundary layer since the 1980s (Fan and Jacob, 1992; 10
Simpson et al., 2007):
X+O3→XO+O2 (R6)
In terms of the chemical budget of NOx, the impact of XO can occur via two chem-ical mechanisms (see Sect. 4.2 for the second mechanism involving the formation of halogen nitrate,XONO2). First,XO can oxidize NO to NO2, a pathway that competes
15
with the NO+O3and NO+HO2/RO2reactions in terms of NO oxidation:
XO+NO→X+NO2 (R7)
For conditions typical of the Antarctic boundary layer, 1 pmol mol−1
ofXO has roughly the same oxidizing power as 4 nmol mol−1of ozone in terms of NO oxidation (Atkinson et al., 2007). Therefore, when halogen oxides are present at relevant levels, the R7 20
ACPD
15, 24041–24083, 2015Oxygen isotope mass balance of atmospheric nitrate at Dome C during the
OPALE campaign
J. Savarino et al.
Title Page
Abstract Introduction
Conclusions References
Tables Figures
◭ ◮
◭ ◮
Back Close
Full Screen / Esc
Printer-friendly Version
Interactive Discussion
Discussion
P
a
per
|
Discussion
P
a
per
|
Discussion
P
a
per
|
Discussion
P
a
per
|
of NO with O3or HO2/RO2(i.e., the extended Leighton mechanism):
[NO2]
[NO] =
kNO+O3[O3]+kNO+HO2[HO2]+kNO+RO2[RO2]+kNO+XO[XO]
jNO2
(6)
The interaction of XO in the NOx cycle at Dome C would have important
implica-tions for the ∆17O of atmospheric nitrate. The production of halogen oxide radicals proceeds through a direct transfer of a terminal oxygen atom from ozone to the XO 5
product (Zhang et al., 1997). Therefore, it is expected that the∆17O ofXO is equal to ∆17O(O3)term., which means that the reaction of NO with XO is roughly equivalent to
the NO+O3reaction in terms of∆ 17
O transfer to NO2(note that the NO+XO transfer
is greater than NO+O3 as in the later case, part of the central O3 atom participates in the reaction). The participation ofXO species in the oxidation of NO thus leads to 10
a greater∆17O transfer to NO2by effectively increasing the value ofα. However, on the
Antarctic plateau, BrO did not exceed 2–3 pmol mol−1
at most during OPALE campaign (Frey et al., 2014). Including BrO chemistry would only increaseα by 2 % (due to the specific form ofα≡1/(1+x)) of which is to low to significantly influence∆17O(NO2) and
ultimately∆17O(NO−3). In the absence of measurements of other halogens we cannot 15
completely rule out a role of the halogen chemistry there. However, even withα=1, its maximum but unrealistic value due to the high concentration of HO2,∆
17
O(NO−3) would reach the range of 23–25 ‰, in better agreement with the observations but still signif-icantly lower. Similarly, in the event of a non isotopic steady state of NO2 (Michalski et al., 2014), it is very unlikely that∆17O(NO2) could reach values greater than its
pri-20
mary snow nitrate source (i.e.∆17O(NO2)>∆ 17
O(NO−3)snow=30–35 ‰ in summer at
ACPD
15, 24041–24083, 2015Oxygen isotope mass balance of atmospheric nitrate at Dome C during the
OPALE campaign
J. Savarino et al.
Title Page
Abstract Introduction
Conclusions References
Tables Figures
◭ ◮
◭ ◮
Back Close
Full Screen / Esc
Printer-friendly Version
Interactive Discussion
Discussion
P
a
per
|
Discussion
P
a
per
|
Discussion
P
a
per
|
Discussion
P
a
per
|
4.2 Alternative oxidation pathways of NO2
Considering Reaction (R5) as the main source of HNO3, an alternative approach is to
consider that OH bears a higher∆17O than the estimate calculated previously. Assum-ing aβof one, which seems again unrealistic, will increase∆17O(NO−3) by 1 ‰ at most (Table 2), still insufficient to explained atmospheric observations as NO+HO2remain
5
a major source of OH, independently of the assumedβ.
Alternatively, if measured HONO concentrations are considered instead of those as-sumed to constrain by the HOx budget (i.e. 4 times lower than measured), average ∆17O(NO−3) values of 23–24 ‰ are calculated (Table 2), again systematically lower than the observed range of 27–30 ‰. However, given the significant uncertainty sur-10
rounding the isotopic composition of HONO and its relative contribution to total OH production at Dome C, it is not possible to make a firm conclusion in this regard.
Therefore, neither the common sources of NO2 nor the daytime formation of HNO3 seems to be able to explain the high∆17O(NO−3) values of atmospheric nitrate observed at Dome C in summer. When this observation is taken together with the high NO2/NO
15
ratio observed by Frey et al. during two summer seasons at Dome C (Frey et al., 2013, 2014), clearly our current understanding of the NOx chemistry on the Antarctic plateau seems to be incomplete.
There are several other processes that possibly account for the disagreement be-tween the measurements and mass balance calculations. Indeed, in addition to its 20
impact on NOxcycling through the R7 pathway, an increasing body of evidence points towards reactive halogen chemistry as a major NOx sink and source of nitrate via the production and subsequent hydrolysis ofXNO3species (Sander et al., 1999; Savarino et al., 2013; Vogt et al., 1996):
XO+NO2+M→XNO3+M (R8)
25
ACPD
15, 24041–24083, 2015Oxygen isotope mass balance of atmospheric nitrate at Dome C during the
OPALE campaign
J. Savarino et al.
Title Page
Abstract Introduction
Conclusions References
Tables Figures
◭ ◮
◭ ◮
Back Close
Full Screen / Esc
Printer-friendly Version
Interactive Discussion
Discussion
P
a
per
|
Discussion
P
a
per
|
Discussion
P
a
per
|
Discussion
P
a
per
|
A critical analysis of the CHABLIS data led Bauguitte et al. (2012) to conclude that the Reactions (R8) and (R9) pathway exerted predominant control over the chemical loss rate of NOx during the campaign, despite the significant uncertainties involved in the parameterization of the uptake processes (Finlayson-Pitts, 2009). This implies thatXNO3uptake may also represent a significant source of nitrate at Dome C should
5
halogen oxide radicals (XO) be present at the required concentration. Experimental (Gane et al., 2001) and theoretical (McNamara and Hillier, 2001) studies suggest that the oxygen atom initially associated withXO combines with the N atom of NO2to form
nitrate, thus transferring the isotopic signature of bothXO and NO2. The specific∆ 17
O value induced by XNO3 hydrolysis can thus be expressed as follows (Morin et al.,
10
2007):
∆17O(NO− 3)R6=
2 3∆
17
O(NO2)+
1 3∆
17
O(O3)term (7)
efficiently bypassing the OH 17O-excess budget. Through consideration of the in-creased∆17O transfer associated with Reaction (R8), the observations of∆17O(NO−
3)
during December can be reconciled with the values calculated by mass-balance if ap-15
proximately 10–20 % of total nitrate production is assumed to occur viaXNO3
hydroly-sis. However, no sufficient halogen concentration has been observed on the Antarctic plateau to sustain such chemical pathway but we note that chlorine chemistry has never been probed on the Antarctic plateau.
There is increasing body of evidence that heterogeneous hydrolysis of NO2 can be 20
a possible source of HONO and HNO3in acidic conditions (Finlayson-Pitts, 2009), with
the potential to explain the difference between the calculated and measured atmo-spheric∆17O(NO−
3) values. This mechanism would represent a source of nitrate with
a ∆17O value roughly equivalent to the nitrate originally present in the surface snow (i.e., 30–35 ‰), a signature significantly higher than that induced by Reaction (R5). If 25
ACPD
15, 24041–24083, 2015Oxygen isotope mass balance of atmospheric nitrate at Dome C during the
OPALE campaign
J. Savarino et al.
Title Page
Abstract Introduction
Conclusions References
Tables Figures
◭ ◮
◭ ◮
Back Close
Full Screen / Esc
Printer-friendly Version
Interactive Discussion
Discussion
P
a
per
|
Discussion
P
a
per
|
Discussion
P
a
per
|
Discussion
P
a
per
|
it would act to increase the∆17O value of nitrate in the boundary layer relative to the local∆17O(NO−3)R5 oxidation signature. However, considering the propensity of nitric
acid to stick on snow (Crowley et al., 2010), the snowpack to act as a sink rather than a source of nitric acid (Dibb, 2004; Erbland et al., 2013) and the fast NOx recycling that should take place within the snowpack, it is very unlikely that∆17O(NO−3) could be 5
explained by a direct nitric acid emissions from snow, which has been ultimately shown to be limited (Slusher et al., 2010; Erbland et al., 2013; Berhanu et al., 2014).
A critical analysis of ∆17O(NO−3) shows in fact that such high values correspond mainly to the nighttime chemistry of NOx (Michalski et al., 2003; Morin et al., 2008). Nighttime chemistry involves species like N2O5 and NO3 in the process of forming
10
HNO3 and again efficiently by-pass the OH pathway. It is conceivable that below the
photic zone, within the snowpack, N2O5and NO3could be produced when O3and NO2 are transported at depth but there is no reason to think that such dark NOx chemistry
could in a way or in another survive the photic zone transition and thus influences the overlying atmosphere.
15
Stratospheric nitrate deposited to the surface snow during winter, which has been observed to possess∆17O(NO−3) values in the range of 35–41 ‰ (Erbland et al., 2013) and possibly more, may act to buffer the∆17O of the atmospheric nitrate reservoir via evaporation late into the spring and summer. However, this seems again unlikely given the rapidity of NOx cycling and oxidative loss at Dome C during this time (Frey et al., 20
2013; Legrand et al., 2009).
While it is presently difficult to determine the precise nature of the process(es) lead-ing to the relatively large17O-excess values observed for atmospheric nitrate at Dome C, the correlation observed between theδ15N and∆17O values of atmospheric nitrate (see Sect. 3.1) provides at least one direct line of evidence that the high∆17O(NO−
3)
25
ACPD
15, 24041–24083, 2015Oxygen isotope mass balance of atmospheric nitrate at Dome C during the
OPALE campaign
J. Savarino et al.
Title Page
Abstract Introduction
Conclusions References
Tables Figures
◭ ◮
◭ ◮
Back Close
Full Screen / Esc
Printer-friendly Version
Interactive Discussion
Discussion
P
a
per
|
Discussion
P
a
per
|
Discussion
P
a
per
|
Discussion
P
a
per
|
δ15N and∆17O values of atmospheric nitrate (Fig. 8). In other words, the atmospheric nitrate sampled in early spring, which is heavily depleted in15N due its formation from snowpack NOxemissions, possessed consistently higher∆17O values than the nitrate sampled directly after this period of maximum snow photochemistry. This finding sug-gests that the mechanism producing enhanced ∆17O(NO−3) values observed during 5
this time is tightly coupled in time and space with the intensity of NOx emissions from the snowpack, an observation very similar to that of Morin et al. (2012), who detected a similar relationship betweenδ15N and∆17O for atmospheric nitrate in the springtime boundary layer over Barrow, Alaska (71◦
N). The authors of this study attributed the observed correlation to the coupling of snowpack NOx emissions and reactive halo-10
gen chemistry, suggesting that these two processes were interrelated and mutually strengthening. In the case of the OPALE 2011–2012 data, the correlation betweenδ15N and∆17O could arise from any of the potential pathways previously discussed. For ex-ample, as proposed by Morin et al. (2012), the R8 and R9 pathways may be enhanced under periods of intense snowpack emissions. Alternatively, a correlation could result 15
from an increased contribution to total OH production from the photolysis of HONO, which is co-emitted with NOx via nitrate photochemistry (Grannas et al., 2007) and may induce a larger17O-excess in OH as compared to the conventional O(1D)+H2O pathway. Furthermore, the hydrolysis of NO2in snow, should it contribute significantly to nitrate production at Dome C, is likely amplified during periods when concentrations 20
NO2are high in the snowpack interstitial air due to nitrate/nitrite photochemistry.
There-fore, while the processes responsible for driving the formation of atmospheric nitrate at Dome C during summer cannot be unambiguously identified, the isotopic results pre-sented here clearly indicate that snowpack emissions result in enhanced∆17O transfer to nitrate. Our understanding of NOx chemistry above the snow surface at Dome C is 25
ACPD
15, 24041–24083, 2015Oxygen isotope mass balance of atmospheric nitrate at Dome C during the
OPALE campaign
J. Savarino et al.
Title Page
Abstract Introduction
Conclusions References
Tables Figures
◭ ◮
◭ ◮
Back Close
Full Screen / Esc
Printer-friendly Version
Interactive Discussion
Discussion
P
a
per
|
Discussion
P
a
per
|
Discussion
P
a
per
|
Discussion
P
a
per
|
5 Conclusions
Constraining the propagation of ozone’s17O-excess signature within the NOx cycle is critical in polar areas where the opportunity is offered to extend atmospheric investiga-tions based on∆17O measurements to the glacial/interglacial time scale using deep ice core records of nitrate. However, the factors governing the present-day isotopic com-5
position of atmospheric nitrate over the Antarctic plateau remain poorly understood, primarily due to the complex nature of the boundary layer photochemistry initiated dur-ing sprdur-ing by NOx emissions from the snowpack.
An isotopic mass balance performed for atmospheric nitrate during December 2011, informed by in situ oxidant concentration measurements conducted within the frame-10
work of the OPALE field study, suggests the existence of an unexpected process by-passing the commonly accepted daytime chemistry of NO2 (i.e. NO2+OH) that
con-tributes significantly to the atmospheric nitrate budget over Dome C. The strong neg-ative correlation observed between theδ15N and ∆17O values of nitrate between Oc-tober and December suggests that this unknown process is enhanced during periods 15
of intense emissions from the snowpack. Potential explanations for this observation in-clude: (i) an increased∆17O transfer from OH due to its formation from the photolysis of HONO released from the snowpack, (ii) heterogeneous hydrolysis of NO2 due to
the high concentrations of NO2in the snowpack interstitial air, and (iii) the co-emission of reactive halogen species that act as an intermediate in the transfer of ∆17O from 20
ozone to nitrate. Further research is needed to solve the many inconsistencies (e.g. high NO2/NO ratio, high concentration of NO2, unresolved HONO atmospheric
con-centration, interference such as HO2NO2, isotope mass balance) observed during the OPALE experiments.
Acknowledgements. The research leading to these results has received funding from the
Euro-25
Insti-ACPD
15, 24041–24083, 2015Oxygen isotope mass balance of atmospheric nitrate at Dome C during the
OPALE campaign
J. Savarino et al.
Title Page
Abstract Introduction
Conclusions References
Tables Figures
◭ ◮
◭ ◮
Back Close
Full Screen / Esc
Printer-friendly Version
Interactive Discussion
Discussion
P
a
per
|
Discussion
P
a
per
|
Discussion
P
a
per
|
Discussion
P
a
per
|
tute Polaire Paul-Emile Victor (IPEV) supported the research and polar logistics through the program SUNITEDC No. 1011. This work has been partially supported by a grant from Labex OSUG@2020 (Investissements d’avenir – ANR10 LABX56. We would also like to thank all the field team members present during the OPALE campaign. Meteorological data were obtained from “IPEV/PNRA: Routine Meteorological Observation at Station Concordia”.
5
References
Adon, M., Galy-Lacaux, C., Yoboué, V., Delon, C., Lacaux, J. P., Castera, P., Gardrat, E., Pienaar, J., Al Ourabi, H., Laouali, D., Diop, B., Sigha-Nkamdjou, L., Akpo, A., Tathy, J. P., Lavenu, F., and Mougin, E.: Long term measurements of sulfur dioxide, nitrogen dioxide, ammonia, nitric acid and ozone in Africa using passive samplers, Atmos. Chem. Phys., 10,
10
7467–7487, doi:10.5194/acp-10-7467-2010, 2010.
Alexander, B., Savarino, J., Kreutz, K., and Thiemens, M. H.: Impact of preindustrial biomass-burning emissions on the oxidative pathways of tropospheric sulfur and nitrogen, J. Geophys. Res., 109, D08303, doi:10.1029/2003JD004218, 2004.
Alexander, B., Hastings, M. G., Allman, D. J., Dachs, J., Thornton, J. A., and Kunasek, S. A.:
15
Quantifying atmospheric nitrate formation pathways based on a global model of the oxy-gen isotopic composition (∆17O) of atmospheric nitrate, Atmos. Chem. Phys., 9, 5043–5056, doi:10.5194/acp-9-5043-2009, 2009.
Anastasio, C. and Chu, L.: Photochemistry of nitrous acid (HONO) and nitrous acid-ium ion (H2ONO+) in aqueous solution and ice, Environ. Sci. Technol., 43, 1108–1114,
20
doi:10.1021/es802579a, 2009.
Atkinson, R., Baulch, D. L., Cox, R. A., Crowley, J. N., Hampson, R. F., Hynes, R. G., Jenkin, M. E., Rossi, M. J., and Troe, J.: Evaluated kinetic and photochemical data for at-mospheric chemistry: Volume I – gas phase reactions of Ox, HOx, NOx and SOx species, Atmos. Chem. Phys., 4, 1461–1738, doi:10.5194/acp-4-1461-2004, 2004.
25
ACPD
15, 24041–24083, 2015Oxygen isotope mass balance of atmospheric nitrate at Dome C during the
OPALE campaign
J. Savarino et al.
Title Page
Abstract Introduction
Conclusions References
Tables Figures
◭ ◮
◭ ◮
Back Close
Full Screen / Esc
Printer-friendly Version
Interactive Discussion
Discussion
P
a
per
|
Discussion
P
a
per
|
Discussion
P
a
per
|
Discussion
P
a
per
|
Bauguitte, S. J.-B., Bloss, W. J., Evans, M. J., Salmon, R. A., Anderson, P. S., Jones, A. E., Lee, J. D., Saiz-Lopez, A., Roscoe, H. K., Wolff, E. W., and Plane, J. M. C.: Summertime NOx measurements during the CHABLIS campaign: can source and sink estimates unravel ob-served diurnal cycles?, Atmos. Chem. Phys., 12, 989–1002, doi:10.5194/acp-12-989-2012, 2012.
5
Berhanu, T. A., Meusinger, C., Erbland, J., Jost, R., Bhattacharya, S. K., Johnson, M. S., and Savarino, J.: Laboratory study of nitrate photolysis in Antarctic snow, II. Isotopic effects and wavelength dependence, J. Chem. Phys., 140, 244305, doi:10.1063/1.4882899, 2014. Bhattacharya, S. K., Pandey, A., and Savarino, J.: Determination of intramolecular isotope
dis-tribution of ozone by oxidation reaction with silver metal, J. Geophys. Res., 113, D03303,
10
doi:10.1029/2006jd008309, 2008.
Bloss, W. J., Camredon, M., Lee, J. D., Heard, D. E., Plane, J. M. C., Saiz-Lopez, A., Baugui-tte, S. J.-B., Salmon, R. A., and Jones, A. E.: Coupling of HOx, NOxand halogen chemistry in the antarctic boundary layer, Atmos. Chem. Phys., 10, 10187–10209, doi:10.5194/acp-10-10187-2010, 2010.
15
Bolton, D.: The computation of equivalent potential temperature, Mon. Weather Rev., 108, 1046–1053, 1980.
Casciotti, K. L., Sigman, D. M., Galanter Hastings, M., Böhlke, J. K., and Hilkert, A.: Mea-surement of the oxygen isotopic composition of nitrate in seawater and freshwater using the denitrifier method, Anal. Chem., 74, 4905–4912, 2002.
20
Chen, G., Davis, D., Crawford, J., Nowak, J. B., Eisele, F., Mauldin, R. L., Tanner, D., Buhr, M., Shetter, R., Lefer, B., Arimoto, R., Hogan, A., and Blake, D.: An investigation of South Pole HOx chemistry: comparison of model results with ISCAT observations, Geophys. Res. Lett., 28, 3633–3636, doi:10.1029/2001GL013158, 2001.
Chen, G., Davis, D., Crawford, J., Hutterli, L. M., Huey, L. G., Slusher, D., Mauldin, L.,
25
Eisele, F., Tanner, D., Dibb, J., Buhr, M., McConnell, J., Lefer, B., Shetter, R., Blake, D., Song, C. H., Lombardi, K., and Arnoldy, J.: A reassessment of HOx South Pole chem-istry based on observations recorded during ISCAT 2000, Atmos. Environ., 38, 5451–5461, doi:10.1016/j.atmosenv.2003.07.018, 2004.
Coplen, T. B.: Guidelines and recommended terms for expression of
stable-isotope-30
ACPD
15, 24041–24083, 2015Oxygen isotope mass balance of atmospheric nitrate at Dome C during the
OPALE campaign
J. Savarino et al.
Title Page
Abstract Introduction
Conclusions References
Tables Figures
◭ ◮
◭ ◮
Back Close
Full Screen / Esc
Printer-friendly Version
Interactive Discussion
Discussion
P
a
per
|
Discussion
P
a
per
|
Discussion
P
a
per
|
Discussion
P
a
per
|
Crawford, J. H., Davis, D. D., Chen, G., Buhr, M., Oltmans, S., Weller, R., Mauldin, L., Eisele, F., Shetter, R., Lefer, B., Arimoto, R., and Hogan, A.: Evidence for photochemi-cal production of ozone at the South Pole surface, Geophys. Res. Lett., 28, 3641–3644, doi:10.1029/2001GL013055, 2001.
Crowley, J. N., Ammann, M., Cox, R. A., Hynes, R. G., Jenkin, M. E., Mellouki, A., Rossi, M. J.,
5
Troe, J., and Wallington, T. J.: Evaluated kinetic and photochemical data for atmospheric chemistry: Volume V – heterogeneous reactions on solid substrates, Atmos. Chem. Phys., 10, 9059–9223, doi:10.5194/acp-10-9059-2010, 2010.
Davis, D., Nowak, J. B., Chen, G., Buhr, M., Arimoto, R., Hogan, A., Eisele, F., Mauldin, L., Tanner, D., Shetter, R., Lefer, B., and McMurry, P.: Unexpected high levels of NO observed
10
at South Pole, Geophys. Res. Lett., 28, 3625–3628, doi:10.1029/2000GL012584, 2001. Davis, D., Seelig, J., Huey, G., Crawford, J., Chen, G., Wang, Y., Buhr, M., Helmig, D.,
Neff, W., and Blake, D.: A reassessment of Antarctic plateau reactive nitrogen based on ANTCI 2003 airborne and ground based measurements, Atmos. Environ., 42, 2831–2848, doi:10.1016/j.atmosenv.2007.07.039, 2008.
15
Dibb, J.: Soluble reactive nitrogen oxides at South Pole during ISCAT 2000, Atmos. Environ., 38, 5399–5409, doi:10.1016/j.atmosenv.2003.01.001, 2004.
Dubey, M. K., Mohrschladt, R., Donahue, N. M., and Anderson, J. G.: Isotope specific kinet-ics of hydroxyl radical (OH) with water (H2O): testing models of reactivity and atmospheric fractionation, J. Phys. Chem.-US, 101, 1494–1500, 1997.
20
EPICA-community-members: Eight glacial cycles from an Antarctic ice core, Nature, 429, 623– 628, doi:10.1038/nature02599, 2004.
Erbland, J., Vicars, W. C., Savarino, J., Morin, S., Frey, M. M., Frosini, D., Vince, E., and Mar-tins, J. M. F.: Air–snow transfer of nitrate on the East Antarctic Plateau – Part 1: Isotopic evidence for a photolytically driven dynamic equilibrium in summer, Atmos. Chem. Phys., 13,
25
6403–6419, doi:10.5194/acp-13-6403-2013, 2013.
Fan, S.-M. and Jacob, D. J.: Surface ozone depletion in Arctic spring sustained by bromine reactions on aerosols, Nature, 359, 522–524, 1992.
Finlayson-Pitts, B. J.: Reactions at surfaces in the atmosphere: integration of experiments and theory as necessary (but not necessarily sufficient) for predicting the physical chemistry of
30
aerosols, Phys. Chem. Chem. Phys., 11, 7760–7779, doi:10.1039/b906540g, 2009.
ACPD
15, 24041–24083, 2015Oxygen isotope mass balance of atmospheric nitrate at Dome C during the
OPALE campaign
J. Savarino et al.
Title Page
Abstract Introduction
Conclusions References
Tables Figures
◭ ◮
◭ ◮
Back Close
Full Screen / Esc
Printer-friendly Version
Interactive Discussion
Discussion
P
a
per
|
Discussion
P
a
per
|
Discussion
P
a
per
|
Discussion
P
a
per
|
snow emissions and snow chemistry of reactive nitrogen, Atmos. Chem. Phys., 11, 9787– 9801, doi:10.5194/acp-11-9787-2011, 2011.
Frey, M. M., Savarino, J., Morin, S., Erbland, J., and Martins, J. M. F.: Photolysis imprint in the nitrate stable isotope signal in snow and atmosphere of East Antarctica and implications for reactive nitrogen cycling, Atmos. Chem. Phys., 9, 8681–8696, doi:10.5194/acp-9-8681-2009,
5
2009.
Frey, M. M., Brough, N., France, J. L., Anderson, P. S., Traulle, O., King, M. D., Jones, A. E., Wolff, E. W., and Savarino, J.: The diurnal variability of atmospheric nitrogen oxides (NO and NO2) above the Antarctic Plateau driven by atmospheric stability and snow emissions, Atmos. Chem. Phys., 13, 3045–3062, doi:10.5194/acp-13-3045-2013, 2013.
10
Frey, M. M., Roscoe, H. K., Kukui, A., Savarino, J., France, J. L., King, M. D., Legrand, M., and Preunkert, S.: Atmospheric nitrogen oxides (NO and NO2) at Dome C, East Antarctica, during the OPALE campaign, Atmos. Chem. Phys., 15, 7859–7875, doi:10.5194/acp-15-7859-2015, 2015.
Gane, M. P., Williams, N. A., and Sodeau, J. R.: A reflection-absorption infrared spectroscopy
15
(RAIRS) investigation of the low-temperature heterogeneous hydrolysis of bromine nitrate, J. Phys. Chem.-US, 105, 4002–4009, 2001.
Geyh, A., Wolfson, J. M., and Koutrakis, P.: Development and evaluation of a small active ozone sampler, Environ. Sci. Technol., 31, 2326–2330, 1997.
Granger, J. and Sigman, D. M.: Removal of nitrite with sulfamic acid for nitrate N and O
20
isotope analysis with the denitrifier method, Rapid Commun. Mass Sp., 23, 3753–3762, doi:10.1002/rcm.4307, 2009.
Grannas, A. M., Jones, A. E., Dibb, J., Ammann, M., Anastasio, C., Beine, H. J., Bergin, M., Bottenheim, J., Boxe, C. S., Carver, G., Chen, G., Crawford, J. H., Dominé, F., Frey, M. M., Guzmán, M. I., Heard, D. E., Helmig, D., Hoffmann, M. R., Honrath, R. E., Huey, L. G.,
Hut-25
terli, M., Jacobi, H. W., Klán, P., Lefer, B., McConnell, J., Plane, J., Sander, R., Savarino, J., Shepson, P. B., Simpson, W. R., Sodeau, J. R., von Glasow, R., Weller, R., Wolff, E. W., and Zhu, T.: An overview of snow photochemistry: evidence, mechanisms and impacts, Atmos. Chem. Phys., 7, 4329–4373, doi:10.5194/acp-7-4329-2007, 2007.
Hastings, M. G., Sigman, D. M., and Steig, E. J.: Glacial/interglacial changes in the isotopes of
30