Telephone - delivered quality of life after 365 male stress
urinary incontinence (SUI) operations
_______________________________________________
Katharina Maria Bretterbauer
1, Erik Randall Huber
2, Mesut Remzi
2, Wilhelm Huebner
21 Landesklinikum Mistelbach – Urology Mistelbach, Lower Austria, Austria; 2 Landesklinikum Korneuburg
– Urology Korneuburg, Austria
ABSTRACT
ARTICLE
INFO
______________________________________________________________ ______________________
Objectives: To assess patient satisfaction and quality of life and factors that may be related to these outcomes.
Materials and Methods: Between 2000 and 2008 a retrospective chart review and te-lephone survey of all surgeries for male SUI was performed. Average age at times of operation was 69.4 ± 7.4 (median 69). As part of the survey 270 of 365 patients were available (response rate: 74%). The average follow up time (from operation to telepho-ne survey) was 34.8 ± 22.8 months (median 32).
Results: Pad use per day improved significantly after operation from 6.23±5.3 to 1.61±2.92 pads/day (p=0.001). 74.7% (n=198) declared to be continent with one safety pad and 87.7% (n=236) confirmed the postoperative improvement of incontinence. 189 (70.5%) patients were “very satisfied” and “satisfied”. In 81% (n=218) the expectation in operation could be met, therefore 84.3% (n=226) would undergo it again and 90.3% (n=243) would recommend it to others. Lower age (rs=0.211), few postoperative pads per day (rs=0.58), high reduction of pads (rs=-0.35) and physical activity level (rs=0.2) correlate significantly with better satisfaction.
Conclusions: Eighty-seven pint seven percent (87.7%) of our incontinence operations (n=236) lead to an improvement, which is independent from the number of prior in-continence operations and preoperative pad count. The postoperative quality of life remains constant over the observed follow up time. Certain subgroups of patients (younger age, high physical activity level, large reduction of pads) demonstrated su-perior satisfaction rates.
Keywords:
Urinary Incontinence; Prostate; Neoplasms
Int Braz J Urol. 2016; 42: 986-92
_____________________
Submitted for publication: April 05, 2015
_____________________
Accepted after revision: January 25, 2016
INTRODUCTION
Stress urinary incontinence (SUI) is a com-mon adverse event of prostate surgery associated with significant alteration in quality of life for the patients and is a frustrating problem for the urologist (1). The incidence of post-prostatectomy incontinence (PPI) reported in the literature ranges between 5.0% to 48% (2). PPI continues to be a bothersome complication after surgery although
conservative and includes the use of pads, pelvic floor exercise, penile clamps or collecting systems. In patients with persistent post-prostatectomy SUI surgical treatment is recommended. In general, a surgery should be recommended if conservative treatments fail after 6-12 months (2). The surgi-cal armamentarium for SUI in men ranges from bulking agents, Pro adjustable continence therapy (ACT), various sling insertions to artificial urinary sphincters (AUS). To our knowledge there is no publication that compared the objective and sub-jective outcome of different procedures performed in one department when evaluated by an outsider of the clinic and thus preventing a major bias - namely the patient who sometimes tries to please the surgeon by giving a more positive feedback than the physical situation would allow (7).
MATERIALS AND METHODS
A retrospective chart review of all patients undergoing surgeries for male urinary incontinen-ce between February 2000 and October 2008 was performed. Overall 365 patients that had undergo-ne surgeries for male urinary incontiundergo-nence were identified and included into our review. Patient’s data for preoperative daily pad use, age at time of operation, duration of operation, time from onset of incontinence to definite treatment and time of last follow-up in our department were collected. A telephone questionnaire was conducted to assess patient’s follow-up data.
Being a referral center for male SUI this cohort includes 116 patients (43%) with procee-ding failed treatment attempts, thus representing a
difficult patient’s selection. All identified patients were included into a telephone survey performed by an external contractor, who had access to the collected patient’s data.
In those patients in which the number was absent or changed we used an online telephone book or called for phone assistance. The resident’s registration office was used to identify patients that where still not reachable and might have been deceased in the meanwhile.
Data to all answers were documented on Excel 2003 (Microsoft®). The statistic was perfor-med on SPSS 20. Parametric tests (t test, paired t Test, ANOVA) were used for normally distributed data. Non-parametric tests (Wilcoxon rank sum test, Kruskal-Wallis test) were used for data with slate distribution and chi-square test for categori-cal data. Bivariate correlation analysis was perfor-med with spearman’s rank correlation.
RESULTS
The main cause for male urinary inconti-nence in this study was radical prostatectomy in 89.3% (n=326), TURP in 7% (n=26) and other ope-rations in 3.7% (n=13).
The basic data of 365 patients that had un-dergone surgeries for male urinary incontinence are shown in Table-1. Two hundred eighty-five (78.3%) patients could be reached by phone. Of these 15 (4.4%) declined participation in a tele-phone survey concerning their state of continen-ce. Thirty-six (9.9%) patients were deceased at the time of the survey and 43 (11.8%) patients could not be reached by any means, which in part might
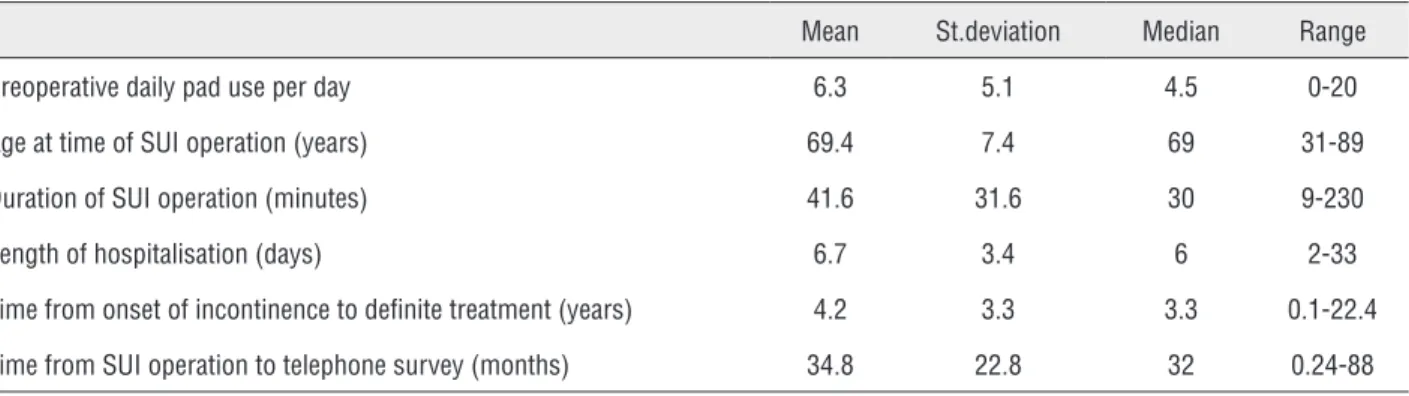
Table 1 - Shows basic data of 365 patients.
Mean St.deviation Median Range
Preoperative daily pad use per day 6.3 5.1 4.5 0-20
Age at time of SUI operation (years) 69.4 7.4 69 31-89
Duration of SUI operation (minutes) 41.6 31.6 30 9-230
Length of hospitalisation (days) 6.7 3.4 6 2-33
Time from onset of incontinence to definite treatment (years) 4.2 3.3 3.3 0.1-22.4
be due to the fact that we get referrals from fo-reign countries as well. In 270 (74%) patients the survey was conducted.
The performed incontinence surgeries were composed of 149 (55.3%) cases of Pro ACT, 57 (21.1%) cases of Argus slings, 54 (20.0%) cases of AUS, 10 (3.7%) cases of Flow Secure, Invance or Reemex. 78.1% of operations were performed by the same surgeon.
The results of the telephone survey ques-tionnaire are shown in Table-2.
We compared the preoperative pad count per day 6.23±5.3 with postoperative 1.61±2.92 and analyzed the change of pad use/day. A sta-tistically significant difference in pad usage could be found (p=0.001). Two hundred thirty-five men (88.7%) assessed their postoperative incontinence situation with “satisfactory” or better.
Table 2 - Questions and results of the telephone survey.
n (%) Mean (SD) Median
(IQR)
1a. What is your daily pad use today including a safety pad for activities? (Pads per day)
267 (100) 1.6 (2.9) 1 (2)
1b. How would you define your continence? 265 (100) 2 (1.2) 2 (2)
1 - Excellent, Dry 123 (46.4)
2 - Good 75 (28.3)
3 - Satisfactory 37 (14.0)
4 - Poor 15 (5.7)
5 - Unsatisfactory, Complete Incontinent 15 (5.7)
1c. How is your state of incontinence compared to before operation? 269 (100)
Better 236 (87.7)
Same 24 (8.9)
Worse 9 (3.3)
2. What is your overall satisfaction with the procedure ? 268 (100) 2.0 (1.3) 2 (2)
1 - Excellent 129 (48.1)
2 - Good 60 (22.4)
3 - Satisfactory 43 (16)
4 - Poor 13 (4.9)
5 - Unsatisfactory 23 (8.6)
3a. Did the incontinence surgery meet your expectations? 269 (100)
Yes 218 (81)
No 51 (19)
3b. Would you undergo the same operation again? 268 (100)
Yes 226 (84.3)
No 42 (15.7)
3c. Would you recommend the operation to others? 269 (100)
Yes 243 (90.3)
No 26 (9.7)
4. How physically active are you? 267 (100) 2 (1.1) 2 (2)
1 - High Physical Activitiy Level 121 (45.3)
2 - Very Active 72 (27)
3 - Active 39 (14.6)
4 - Little Active 24 (9.0)
Furthermore, we divided the patients into 4 grades of incontinence (dry (0 pad), mild (1-2 pads/day), moderate (3-5 pads/day) and severe (>5 pads/day)) and tracked the changes in satisfaction rate and reduction of pads within these groups.
Before the operation zero patients were dry (0 pad), 64 (25.6%) suffered from mild incontinen-ce (1-2 pads/day), 100 (40%) moderate (3-5 pads/ day) and 86 (34.4%) severe (>5 pads/day). After the operation 75 (27.9%) patients were dry (0 pad), 138 (51.3%) had mild incontinence (1-2 pads/day), 45 (16.7%) moderate (3-5 pads/day) and 11 (4.1%) severe (>5 pads/day).
The best results in satisfaction rate were reached in patients who were dry or had mild in-continence. A significant difference in satisfaction depending on the 4 grades of incontinence can be observed (p=0.001): Patients with severe preope-rative incontinence have the highest reduction in pad use per day on average 8 pads/day. Two hun-dred thirty-two patients (86.5%) rated their satis-faction rate with “satisfactory” or better.
In Table-3 we looked at different metho-ds of incontinence operations and it can be seen, that there is a significant difference in preopera-tive pads per day (p=0.001), reduction of pads per day (p=0.008) as well as satisfaction rate (p=0.04) in favor of the AUS subgroup.
A high reduction of pads correlates with a good satisfaction rate (rs=-0.35) and therefore people with AUS are more satisfied (p=0.04) and would recommend it again (p=0.04) compared to patients with other treatment operations.
Moreover, it must be stated that 71.1% of our patients with Pro ACT need 0-1 pads/day pos-toperatively and 76% of Pro ACTs were performed by the same surgeon.
Forty-three percent of our patients had one or more prior incontinence operations. To identify any differences in outcome as a function of prior operations for SUI we classified the sur-vey patients into 3 groups: no prior SUI operation, one prior and more than one. Results are shown in Table-4.
To analyze the differences in the survey results for different times of follow-up we divided into 3 follow-up groups: a short term follow-up group (<12 months), an intermediate follow-up of (12-36 months) and a long term follow-up group of (>36 months). Table-5 presents the comparison for the different parameters of the survey.
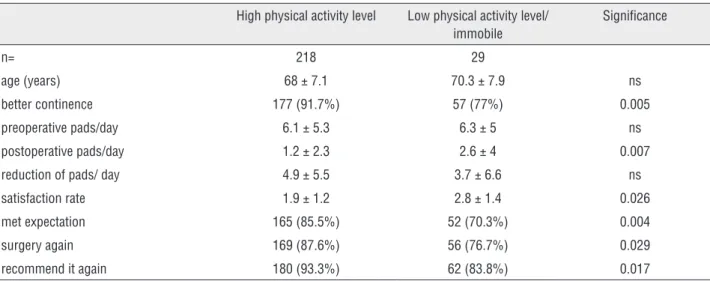
As the physical activity level plays a major role in PPI, patients were also asked about their physical activity. One hundred twenty-one (45.3%) considered themselves as “highly physically acti-ve”; 72 (27%) as “very actiacti-ve”; 39 (14.4%) as “ac-tive”; 24 (9%) as “little active” and 11 (4.1%) as “less physically active/immobile”.
In order to see if activity had an impact on surgery outcome we separated all patients into two different activity groups and compared satis-faction rate and pad use at time of the survey as well as the change in pad use (Table-6).
We searched for variables which correlate with a better satisfaction rate and found out that lower age (rs=0.211), few postoperative pads per
Table 3 - Illustrates an overview over the collected data accordin to different methods of SUI operations.
Pro ACT Argus sling AUS Significance
n=270 149 57 54
preoperative pads/day 5.3±4.6 6.0±5.0 8.8±6.8 0.001
postoperative pads/day
1.4±2.6 1.9±4.0 1.7±2.9 0.85
reduction of pads/day 3.8±4.7 4.1±6.4 7.1±7.5 0.008
satisfaction rate 2.1±1.3 2.0±1.3 1.7±1.0 0.04
met expectation 119 (79.9%) 43 (76.8%) 49 (90.7%) 0.18
surgery again 125 (84.5%) 42 (75.0%) 52 (94.4%) 0.05
Table 4 - Summary of collected data according to the number of prior SUI operations.
Number of prior SUI operations No prior 1 prior >1 prior Significance
n= 270 154 70 46
Better Continence 136 (88.3%) 61 (87%) 40 (87%) ns
Pads/Day 1.4 ± 2.6 1.8 ± 3.5 2 ± 3.1 ns
Reduction Of Pads/Day 5.1 ± 5 5.7 ± 5.5 6.4 ± 4.8 ns
Satisfaction Rate 2 ± 1.3 2 ± 1.2 2.1 ± 1.4 ns
Met Expectations 128 (83.1%) 53 (76.8%) 37 (80.4%) ns
Surgery Again 133 (86.4%) 54 (78.3%) 39 (86.7%) ns
Recommend It Again 143 (92.9%) 61 (88.4%) 39 (84.8%) ns
Table 5 - Collection of data dependent on follow up time.
Short follow-up (<12 Months)
Intermediate follow Up (12- 36 months)
Long Term Follow-up (>36 months)
Significance
n= 63 95 112
Better continence 57 (90.5%) 82 (86.3%) 97 (86.6%) ns
Pads/day 1.2 ± 1.3 1.7 ± 3.2 1.8 ± 3.4 ns
Satisfaction rate 2 ± 1.24 2.1 ± 1.3 2 ± 1.2 ns
Met expectations 50 (79.4%) 76 (80.9%) 92 (82.1%) ns
Surgery again 53 (84.1%) 81(86.2%) 92 (82.9%) ns
Recommend it again 55 (87.3%) 86 (91.5%) 102 (91.9%) ns
Table 6 - This chart shows the collected data depending on physical activity level.
High physical activity level Low physical activity level/ immobile
Significance
n= 218 29
age (years) 68 ± 7.1 70.3 ± 7.9 ns
better continence 177 (91.7%) 57 (77%) 0.005
preoperative pads/day 6.1 ± 5.3 6.3 ± 5 ns
postoperative pads/day 1.2 ± 2.3 2.6 ± 4 0.007
reduction of pads/ day 4.9 ± 5.5 3.7 ± 6.6 ns
satisfaction rate 1.9 ± 1.2 2.8 ± 1.4 0.026
met expectation 165 (85.5%) 52 (70.3%) 0.004
surgery again 169 (87.6%) 56 (76.7%) 0.029
recommend it again 180 (93.3%) 62 (83.8%) 0.017
day (rs=0.58), a high reduction of pads per day (rs=-0.35) and high physical activity level corre-late significantly with a better satisfaction rate. Factors for low postoperative pads per day are low age at time of SUI operation (rs=0.17), few
leng-th of hospitalization. The present correlations are significant at the 0.01 level (2-tailed).
DISCUSSION
Male incontinence has gained significant in-terest in the past 10 years and has become an essen-tial part of most major urology conferences. The opti-mal postoperative results depend on many individual patient, device and surgeon-related factors. Comiter et al. claimed that it is not clear which device should be offered to which patient, because no single device should be exclusively considered the gold-standard option for PPI therapy (8).
As Martin et al. described, comparison of di-fferent methods in didi-fferent set-ups and for didi-fferent initial situations continues to be difficult, as we lack standardized methods and validated questionnaires used widely to evaluate the incontinence status in a particular patient (9, 10).
In addition, our patients may have diffe-rent habits and expectations. In a study by Kumar et al. when men with PPI are offered the choice of a mechanical device (AUS) vs. a male sling, they are willing to go against the surgeon’s recommendation to avoid a mechanical device (11).
Furthermore, different systems are difficult to compare, as indications as well as contraindications depend on various factors. Therefore, it is not easy to predict the subjective outcome after surgery for male incontinence in a particular patient (12).
According to the EAU guidelines the AUS is the therapy of choice for moderate to severe incon-tinence (13). Studies have shown that the success rates of AUS are highest compared with all other treatment options for male SUI (2). It must be indi-cated, that AUS implantation carries a well known risk of revision surgery secondary to infection, ero-sion, urethral atrophy and mechanical failure (14, 15). However, it must be stated that the comparison of pads/day between operation procedures is misle-ading because of the fact that patients with severe incontinence would get an AUS. Unsurprisingly, there was a significant difference in preoperative pad count, reduction of pads as well as satisfaction rate in favor of the AUS subgroup.
It was not our intent to compare different surgical techniques but rather get an idea which
pa-tients would subjectively profit most from surgery for their incontinence. To compare this, a prospec-tive study design would be needed. Furthermore, the study population is non-homogenous, no va-lidated quality of life questionnaire was used and 63 (23.3%) patients had a follow-up time less than one year. These mentioned points can also be seen as a limitation of this study.
In the context of the survey 84.3% claimed to undergo the operation again, but nearly 90.3% (n=243) would recommend it to others. Most of the people questioned argued with the uniqueness of mankind. Walsh et al. investigated the satisfaction after AUS implantation in irradiated patients, asked the same questions above and found the opposite result. Eighty-nine percent would undergo the sur-gery again, but only 87% would recommend it to a friend (16).
Men with severe preoperative incontinence have the highest reduction of pads postoperative. In-terestingly enough preoperative pad count does not correlate with better postoperative satisfaction rate.
Furthermore, no difference in satisfaction rate can be shown according to the number of prior incontinence operations even though pads/day is slightly higher at time of survey in patients with prior operations for SUI. It must be highlighted that a low number of prior incontinence operations cor-relates with low postoperative pad count, but not with satisfaction rate. In addition, it is noteworthy that patients with more than one prior operation would undergo surgery again if necessary.
Seventy-one point one percent (71.1%) of our patients with Pro ACT need 0-1 pads/day. These good results compared to literature can be explai-ned by the fact that the success rate increases with experience. In our study, 76% of Pro ACTs were performed by the same surgeon (17).
Our collected data makes it possible to com-pare postoperative pad count and satisfaction rate over various follow-up times (range: 1-88 months) and it revealed that although the pad count slightly increased, the satisfaction rate stayed constantly.
and satisfaction rate. People who regard themselves as highly active, are typically younger and have a better outcome than people with a low activity self awareness. By asking specifically about their desire of activity, we think this is not due to a recall bias and people with a higher postoperative incontinen-ce rate are just more prone to dismiss activities that could result in incontinence. The qualities young and active are probably linked together due to the fact that younger men are more active than older and may also be more confident with their lives. The reason why younger and active patients will profit more remains unclear. It might be due to the fact that a higher muscular tone will also improve pelvic floor function. Furthermore, their grade of injury to the continence mechanism may be overrated com-pared to the inactive group due to higher demands. A correlation for low postoperative pad count was found for young age at time of SUI ope-ration, few incontinence operations and few pads before SUI operation. However, the satisfaction rate was only influenced by low age, high reduction in pad usage, physical activity level and few posto-perative pads. Hence, the amount of preoposto-perative incontinence operations correlates with low posto-perative pads but not with the satisfaction rate.
CONCLUSIONS
Eighty-seven point seven percent (87.7%) of our incontinence operations (n=236) lead to an improvement, which is irrespective of the number of prior incontinence operations and preoperative pad count. The postoperative satisfaction rate re-mains constant over the observed follow-up time. Certain subgroups of patients (younger age, high physical activity level, large reduction of pads) de-monstrated superior satisfaction rates.
REFERENCES
1. Herr HW. Quality of life of incontinent men after radical prostatectomy. J Urol. 1994;151:652-4.
2. Bauer RM, Gozzi C, Hübner W, Nitti VW, Novara G, Peterson A, et al. Contemporary management of postprostatectomy incontinence. Eur Urol. 2011;59:985-96.
3. Singla AK. Male incontinence: Pathophysiology and management. Indian J Urol. 2007;23:174-9.
4. Haab F, Yamaguchi R, Leach GE. Postprostatectomy incontinence. Urol Clin North Am. 1996;23:447-57.
5. Stanford JL, Feng Z, Hamilton AS, Gilliland FD, Stephenson RA, Eley JW, et al. Urinary and sexual function after radical prostatectomy for clinically localized prostate cancer: the Prostate Cancer Outcomes Study. JAMA. 2000;283:354-60. 6. Resnick MJ, Koyama T, Fan KH, Albertsen PC, Goodman
M, Hamilton AS, et al. Long-term functional outcomes after treatment for localized prostate cancer. N Engl J Med. 2013;368:436-45.
7. Thüroff JW, Abrams P, Andersson KE, Artibani W, Chapple CR, Drake MJ, et al. EAU guidelines on urinary incontinence. Eur Urol. 2011;59:387-400.
8. Comiter C. Surgery for postprostatectomy incontinence: which procedure for which patient? Nat Rev Urol. 2015;12:91-9. 9. Tran MG, Yip J, Uveili K, Biers SM, Thiruchelvam N. Patient
reported outcome measures in male incontinence surgery. Ann R Coll Surg Engl. 2014;96:521-5.
10. Martin JL, Williams KS, Sutton AJ, Abrams KR, Assassa RP. Systematic review and meta-analysis of methods of diagnostic assessment for urinary incontinence. Neurourol Urodyn. 2006;25:674-83; discussion 684.
11. Kumar A, Litt ER, Ballert KN, Nitti VW. Artificial urinary sphincter versus male sling for post-prostatectomy incontinence--what do patients choose? J Urol. 2009;181:1231-5.
12. Trost L, Elliott DS. Male stress urinary incontinence: a review of surgical treatment options and outcomes. Adv Urol. 2012;2012:287489.
13. Lucas MG, Bosch RJ, Burkhard FC, Cruz F, Madden TB, Nambiar AK, et al. European Association of Urology. EAU guidelines on surgical treatment of urinary incontinence. Eur Urol. 2012;62:1118-29.
14. Kim SP, Sarmast Z, Daignault S, Faerber GJ, McGuire EJ, Latini JM. Long-term durability and functional outcomes among patients with artificial urinary sphincters: a 10-year retrospective review from the University of Michigan. J Urol. 2008;179:1912-6. 15. Lai HH, Hsu EI, Teh BS, Butler EB, Boone TB. 13 years of
experience with artificial urinary sphincter implantation at Baylor College of Medicine. J Urol. 2007;177:1021-5.
16. Walsh IK, Williams SG, Mahendra V, Nambirajan T, Stone AR. Artificial urinary sphincter implantation in the irradiated patient: safety, efficacy and satisfaction. BJU Int. 2002;89:364-8. 17. Hübner WA, Schlarp OM. Adjustable continence therapy
(ProACT): evolution of the surgical technique and comparison of the original 50 patients with the most recent 50 patients at a single centre. Eur Urol. 2007;52:680-6.