ABSTRACT
Objective: To determine the presence of glycosaminoglycans in the extracellular matrix of connective tissue from neoplastic and non-neoplastic colorectal tissues, since it has a central role in
tumor development and progression. Methods: Tissue samples from
neoplastic and non-neoplastic colorectal tissues were obtained from 64 operated patients who had colorectal carcinoma with no distant metastases. Expressions of heparan sulphate, chondroitin sulphate, dermatan sulphate and their fragments were analyzed by electrospray ionization mass spectrometry, with the technique for extraction and quantification of glycosaminoglycans after proteolysis and electrophoresis. The statistical analysis included mean, standard
deviation, and Student’s t test. Results: The glycosaminoglycans
extracted from colorectal tissue showed three electrophoretic bands in agarose gel. Electrospray ionization mass spectrometry showed characteristic disaccharide fragments from glycosaminoglycans, indicating their structural characterization in the tissues analyzed. Some peaks in the electrospray ionization mass spectrometry were not characterized as fragments of sugars, indicating the presence of fragments of the protein structure of proteoglycans generated during the glycosaminoglycan purification. The average amount of chondroitin and dermatan increased in the neoplastic tissue compared to normal tissue (p=0.01). On the other hand, the average amount of heparan decreased in the neoplastic tissue compared to normal
tissue (p= 0.03). Conclusion: The method allowed the determination
of the glycosaminoglycans structural profile in colorectal tissue from neoplastic and non-neoplastic colorectal tissue. Neoplastic tissues showed greater amounts of chondroitin sulphate and dermatan sulphate compared to non-neoplastic tissues, while heparan sulphate was decreased in neoplastic tissues.
Keywords: Glycosaminoglycans; Proteoglycans; Chondroitin; Dermatan sulfate; Heparitin sulfate; Extracellular matrix; Colorectal neoplasms; Spectrometry, mass, electrospray ionization
RESUMO
Objetivo: Determinar a presença de glicosaminoglicanos na matriz extracelular do tecido conjuntivo colorretal neoplásico e não neoplásico, tendo em vista seu papel central no desenvolvimento e na progressão
dos tumores. Métodos: Amostras de tecidos colorretais neoplásicos
e não neoplásicos foram obtidas de 64 pacientes operados com carcinoma colorretal sem metástases a distância. As expressões de heparan sulfato, sulfato de condroitina e sulfato de dermatan e seus fragmentos foram analisadas por espectrometria de massa por
ionização por electrospray, com técnica de extração e quantificação
de glicosaminoglicanos após proteólise e eletroforese. Para análise
estatística, utilizaram-se média, desvio padrão e teste t de Student.
Resultados: Em gel de agarose, os glicosaminoglicanos extraídos de tecido colorretal mostraram três bandas eletroforéticas. A
1 Universidade Federal de São Paulo, São Paulo, SP, Brazil.
2 Hospital do Servidor Público Estadual, São Paulo, SP, Brazil.
3 Faculdade de Medicina do ABC, Santo André, SP, Brazil.
4 Faculdade de Medicina da Universidade de São Paulo, São Paulo, SP, Brazil.
Corresponding author: Jaques Waisberg – Avenida Ibirapuera, 981, 2nd floor – Vila Clementino – Zip code: 04029-000 – São Paulo, SP, Brazil – Phone: (55 11) 4573-9344 E-mail: [email protected]
Received on: Aug 22, 2015 – Accepted on: Oct 9, 2015
Conflict of interest: none.
DOI: 10.1590/S1679-45082015AO3477
Glycomics expression analysis of sulfated
glycosaminoglycans of human colorectal cancer tissues
and non-neoplastic mucosa by electrospray ionization
mass spectrometry
Análise da expressão de glicosaminoglicanos sulfatados no tecido humano neoplásico colorretal
e na mucosa não neoplásica por espectrometria de massa por ionização por
electrospray
Ana Paula Cleto Marolla1, Jaques Waisberg2,3, Gabriela Tognini Saba3, Daniel Reis Waisberg4,
establish the length of an oligosaccharide chain and the presence of specific functional groups.(1,2,16) Sample
preparation for these sensitive techniques often requires enzymatic treatments to produce oligosaccharide sequences for subsequent analysis.(7,17-20)
There are two techniques for ionizing large biological molecules: first, matrix-assisted desorption laser ionization, a mass spectrometry technique based on desorption and laser ionization of proteins aided by a matrix, which analyzes the mass by the flight time of ion analysis of the tube (time of flight – ToF), and second, the mass spectrometry based on ionization by electric pulses in liquid medium (electrospray ionization mass spectrometry – ESI-MS).(1,2,21)
OBJECTIVE
To describe an experimental method of analyzing sulfated glycosaminoglycans in neoplastic and non-neoplastic tissue specimens from patients with colorectal carcinoma, using electrospray ionization mass spectrometry-based method analysis. While there are various techniques for studying the interaction of sulfated glycosaminoglycans with proteins, the broad applicability of this method offers an insight into how changes in cell surface and extracellular sulfated glycosaminoglycans composition and sequence influence the ability of the cells and tissues to dynamically alter responses to signaling molecules in colorectal cancer tissues.
METHODS
Tissue samples were obtained from 64 adult patients with colorectal carcinoma without metastatic disease, who had been consecutively operated on during the period of 2005 to 2006, in the Department of surgery of our organization. Thirty-seven (57.8%) patients were female. The mean age was 68.5±7.3 years (range: 44 to 81 years). All the patients were caucasian. The carcinoma was located in the rectum in 32 (50.0%) patients, and in the colon, in the other 32 (50.0%) − 17 (26.6%) in the right colon and 15 (23.4%) in the left colon.
For mass spectrometry assays, we used two tissue samples of the large intestine of each patient: one tissue sample obtained from a representative macroscopic area of the colorectal carcinoma, and another from non-neoplastic mucosa, located 10cm cranially to the neoplasia.
The neoplastic and non-neoplastic tissues, biopsies from patients, were ground and homogenized with twice the volume of acetone, for 24 hours, and acetone
espectrometria de massa por ionização por electrospray mostrou
fragmentos de dissacarídeos característicos de glicosaminoglicanos e indicou sua característica estrutural. Alguns picos na espectrometria
de massa por ionização por electrospray não foram caracterizados
como fragmentos de açúcares, sugerindo a presença de fragmentos de proteínas estruturais dos proteoglicanos, formadas durante a purificação dos glicosaminoglicanos. A quantidade média de condroitina e dermatan aumentou no tecido neoplástico em relação ao tecido normal (p=0,01). Por outro lado, a quantidade média de heparan foi menor no tecido
neoplásico em relação ao tecido normal (p=0,03). Conclusão:
O método empregado permitiu determinar o perfil estrutural dos glicosaminoglicanos nas amostras. Tecidos neoplásicos apresentaram maiores quantidades de sulfato de condroitina e sulfato de dermatan em comparação com os não neoplásicos, enquanto o sulfato de heparan foi encontrado em menores quantidades nos tecidos neoplásicos.
Descritores: Glicosaminoglicanas; Proteoglicanas; Condroitina; Dermatan sulfato; Heparitina sulfato; Matriz extracelular; Neoplasias colorretais;
Espectrometria de massas por ionização por electrospray
INTRODUCTION
Homeostasis of extracellular matrix depends on the integrity and assembly of collagens, glycoproteins, proteoglycans (PG), and sulfated glycosaminoglycans (S-GAG).(1-3) S-GAG bind to specific proteins altering
their essential roles in development, organogenesis, cell growth, cell adhesion, inflammation, angiogenesis modulation, apoptosis, cell cycle control, and growth factor signaling.(4-7) Also, S-GAG play vital roles in
every step of tumor progression, allowing cancer cells to proliferate, escape from immune response, invade neighboring tissues, and metastasize to distal sites away from the primary site.(5,8,9) Chondroitin sulfate (CS) and
dermatan sulfate (DS), both galactosaminoglycans, and heparan sulfate (HS), a glycosaminoglycan, are S-GAG involved in these biological events.(10-12)
Several techniques were revised to identify glycans selectively at the reducing end, with a group that could enhance the sensitivity to detect and facilitate chromatographic separations.(3,13,14) However, the analysis
of S-GAG and PG derived from small amounts of tissue or cells, and the development of methods to characterize these carbohydrates have progressed comparatively slowly.(1-3)
Mass spectrometry is an analytical technique used to identify unknown compounds, quantify known materials, and elucidate the chemical and structural properties of molecules, based on the generation of ions that are subsequently detected.(3,15) This
approach facilitates an appreciation of how changes in the structure of S-GAG can regulate physiology as well as pathology.(8,13) Mass spectrometry and gel
was changed four times. These homogenates were kept at room temperature for 48 hours. The material was then centrifuged at 1,300Xg, for 20 minutes, discarding the supernatant and drying the precipitate under vacuum. The dry powder tissue obtained was weighed and submitted to proteolysis in the presence of maxatase (Biocon, Rio de Janeiro, (RJ), Brazil), 2mg/100mg of dry tissue, in a 0.05M Tris HCl buffer, pH 8.0, containing 0.15M NaCl, at a ratio of 10mL enzyme solution per 1g of dry tissue. Trichloroacetic acid TCA (10% end concentration) was added to the mixture and maintained at 4°C, for 15 minutes. After incubation for approximately 48 hours, at 60°C, nucleic acids and proteins remaining in solution were precipitated in an ice bath by adding TCA (10% end concentration). After 10 minutes, the solution was centrifuged (1,300Xg, during 15 minutes) to remove the precipitate. Two volumes of methanol for precipitation of S-GAG were added slowly and with constant stirring to the supernatant. The supernatant containing S-GAG was obtained after centrifugation (10 minutes, 3,500Xg, 4°C). S-GAG were precipitated by adding two volumes of methanol (24 hours, -20°C). The precipitate was collected by centrifugation (20 minutes, 3,500Xg, 4°C), dried, and dissolved in distillated water (50mL of water per gram of acetone powder). An aliquot of this solution was separated, dried under vacuum, and resuspended in DNase solution to inactivate the nucleic acids.
Identification and quantification of sulfated
glycosaminoglycans
Aliquots of S-GAG (50 to 100µL) were incubated with condroitinases B, AC, and heparitinases I, II, and III, isolated from Flavobacterium heparinum,(18) in 0.05M
ethylenediamine-acetate buffer (EDA), pH 8.0, with a final volume of 30µL. After 16 hours incubation at 3rC, the volume was divided into two parts: one aliquot (5µL) was subjected to electrophoresis on agarose gel, and the other was used for identification of compounds and their fragments by mass spectrometry.
Both extracellular matrix and cellular S-GAG were co-purified following the described procedure. S-GAG were identified and quantified by agarose gel electrophoresis in 0.05M 1.3-diaminopropane-acetate buffer (PDA), pH 9.0. After electrophoresis, S-GAG were precipitated in agarose gel using 0.1% acetyl-trimethylammonium-bromide (Sigma-Aldrich, Saint Louis, Missouri, United States), for 2 hours, at room temperature. The gel was dried and stained with toluidine blue (0.1% in acetic acid: ethanol: water; 0.1:5:4.9, v/v).
S-GAG quantification was carried out by densitometry at 530nm. The extinction coefficients of the S-GAG were calculated using standards of chondroitin 4-sulfate (from whale cartilage), DS (from pig skin), and HS (from bovine pancreas) (Seikagaku Kogyo Co., Tokyo, Japan). The agarose gel electrophoresis method error was of the order of 5%. Identification of the S-GAG was based on migration of the compounds compared with that of the standards. The identity of the different S-GAG was confirmed by degradation with specific lyases: chondroitinases B, AC (Seikagaku Kogyo Co., Tokyo, Japan) and heparatinases obtained as previously described.(19)
The substrate specificity of chondroitinases B, AC were CS A and C, chondroitin, and hyaluronic acid. The chondroitinase AC acts in the regions of CS, while chondroitinase B acts in the regions of DS containing links 13(1-4) between N-acetylgalactosamine and QL-iduronic acid.(18)
Heparitinases I and II degrade HS, and unsaturated disaccharides formed as degraded products are a non-sulfate compound (ΔDiHS-OS) and a small amount of uronic acid-glucosamine-N-sulfate (ΔDiHS-NS). Heparitinase I acts on N-acetylated or N-sulfated glucosamine-glucuronic acid links of the HS. Sulfate groups at the 6-position of the glucosamine moiety of the HS chains seem to be impeditive for heparitinase I action. Heparitinase II acts upon HS producing disulfated, N-sulfated, and N-acetylated-6-sulfated disaccharides, and small amounts of N-acetylated disaccharide. Heparitinase II acts preferentially upon N-6-sulfated glucosamine-glucuronic acid links. Heparitinase III degrades HS, and unsaturated disaccharides formed as degraded products are the non-sulfate compound (ΔDiHS-OS) and uronic acid-glucosamine-N-sulfate (ΔDiHS-NS). The total degradation of HS is only achieved by the combined action of these heparitinases.(17)
The produced disaccharides were purified and digested with either chondroitinase B, AC or a mix of heparitinases I, II, and III, as described elsewhere.(22)
Electrospray ionization mass spectrometry
S-GAG obtained from the tissues were degraded or not with specific lyases, diluted in acetonitrile phosphoric acid (1:1), centrifuged at 1.400Xg, injected into the ESI-MS apparatus with a mass-load ratio of 4kDa, and subjected to nebulization. The device was programmed to act in a negative way, i.e., selecting only negative ions with energy in the cone of 80V and subjected to a 5µL/minute flow.
The composition of the electrospray solvent was the same used for S-GAG oligosaccharides, i.e., acetonitrile-phosphoric acid, and the corresponding flow rate was 5µL/minute.
S-GAG or their degradation products were analyzed by electrophoresis on agarose gel in 0.05M PDA, pH 9.0 buffer. After electrophoresis (5V/cm, for 1 hour), the blade was dipped into a 0.1% cetrimide solution for precipitation of S-GAG, for a minimum of 2 hours.
The samples were applied to agarose gel blades, and were then subjected to electrophoresis (5V/cm for hour) in the box cooled to 5°C. Since these compounds possess anionic charge, the origin of the gel corresponded to the negative pole.
The gel was dried under a hot air stream and artificial lighting, and after approximately 90 minutes, the compounds were stained with a toluidine blue solution, and the excess removed with a solution of 1% acetic acid and 50% ethanol.
The system of electrophoresis in agarose gel allows the identification of S-GAG, separating them according to the interaction with the cap. The 0.05M PDA buffer, pH 9.0, distinguishes the compounds according to the differential interaction with the diamine, discriminating, in order of decreasing electrophoretic mobility: CS, DS, and HS.(10) Quantification of S-GAG was performed by
densitometry using a wavelength of 560nm.
This study was conducted in accordance with the regulations of the Human Research Ethics Committees under number 090/04 at our organizations and with the ethical principles of the Declaration of Helsinki of 1975, as revised in 2000.
Statistical analysis
The values obtained in the study of each continuous variable were organized and expressed as mean and standard deviation. Absolute and relative frequencies were used for categories. Statistical associations were determined using Student’s t-test. The statistical significance level was set at 5% (p<0.05), and the data were analyzed using the Statistical Package for Social Sciences software (SPSS™, Chicago, IL, United States), version 15.0.
RESULTS
S-GAG obtained from tissues of colorectal carcinoma and non-neoplastic tissue were identified and quantified by agarose gel electrophoresis, after extraction and precipitation by proteolysis. Thus, this assay avoided any material losses that normally occur during the process.
In the agarose gel, the S-GAG extracted from colorectal tissue showed three electrophoretic bands. Two of them corresponded to the migration of HS and DS, and the third band was delayed when compared to the standard CS migration, making it difficult to separately quantify the compounds CS and DS. Consequently, the two galactosaminoglycans (CS + DS) were quantified together as a single band (Figure 1). However, to ensure the presence of DS and CS in the colorectal tissue samples, the S-GAG extracted from the degradation by enzymatic proteolysis with maxatase were subjected to incubation with specific enzymes (lyases), and the degradation products obtained were analyzed by ESI-MS.
CS: chondroitin sulphate; DS: dermatan sulphate; HS: heparan sulphate. Standard, non-neoplastic colorectal tissue (N), colorectal carcinoma tissue (B, C).
Figure 1. Sulphated glycosaminoglycan electrophoresis of colorectal tissues (5µg each)
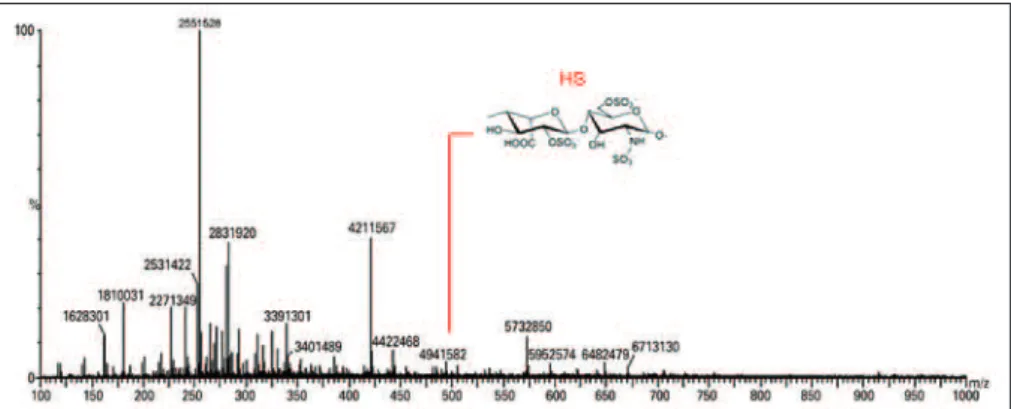
degradation of colorectal tissue with chondroitinase B showed the presence of DS disaccharides and possible fragments (Figure 3). The degradation of colorectal tissue samples with the enzyme heparitinase I, II, and III showed the presence of HS, as well
as possible oligosaccharide fragments characteristic of disaccharides and HS (Figure 4). Heparitinases from Flavobacterium heparinum degraded a linkage region containing L-iduronic acid, D-glucosamine-N-sulfated, and 6-sulfated.
HS: heparan sulphate.
Figure 4. Mass spectroscopy to identify heparan sulphate oligosaccharides. Heparan sulphate oligosaccharides and disaccharides were obtained after heparitinase I and II digestion. The products were compared with the standard of heparan sulphate products
CS: chondroitin sulphate.
Figure 2. Mass spectroscopy to identify chondroitin sulphate oligosaccharides. Chondroitin sulphate oligosaccharides and disaccharides were obtained after chondroitinase AC digestion. The products were compared with the standard of chondroitin-4-sulphated and chondroitin-6-sulphated products
DS: dermatan sulphate.
The ESI-MS showed a characteristic disaccharide profile obtained from CS, DS, and HS, indicating the presence of S-GAG in the colorectal tissues analyzed. However, some peaks in the ESI-MS were not characterized as sugar fragments, indicating the presence of protein fragments obtained from PG proteolysis.
The percentages of S-GAG as galactosaminoglycans (CS and DS) and HS in neoplastic and non-neoplastic colorectal tissue specimens, obtained by agarose gel electrophoresis and degradation with specific lyases
(chondroitinases B, AC and heparatinases), in the different locations of colorectal carcinoma, are showed in table 1 and figure 5.
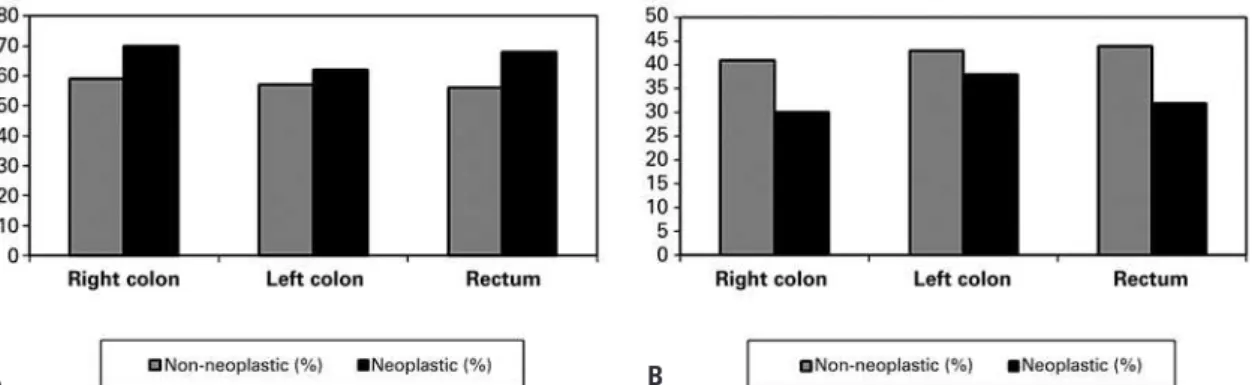
The results showed that the average amount of CS and DS increased in the neoplastic tissue in the right colon, left colon, and rectum compared to the normal tissue in these segments of the large bowel (p=0.01). On the other hand, the average amount of HS decreased in the neoplastic tissue in the right colon, left colon, and rectum, compared to the normal tissue in these segments of the large bowel (p=0.03).
Table 1. Sulphated glycosaminoglycan* profile in neoplastic and non-neoplastic tissue specimens from colorectal carcinoma
Glycosaminoglycans**
Right colon Left colon Rectum
Neoplastic (%)
Non-neoplastic (%)
Neoplastic (%)
Non-neoplastic (%)
Neoplastic (%)
Non-neoplastic (%)
Galactosaminoglycans 70 59 62 57 68 56
Heparan sulphate 30 41 38 43 32 44
Total 100 100 100 100 100 100
* The values of sulphated glycosaminoglycans in neoplastic and non-neoplastic tissue specimens from patients with colorectal carcinoma are expressed as percentage of total sulphated glycosaminoglycans (%); ** the quantification was performed by agarose gel electrophoresis, as described in Methods, and the values represent triplicates obtained from two different assays.
Figure 5. Sulphated glycosaminoglycan profile in neoplastic and non-neoplastic tissue specimens from colorectal carcinoma. (A) Galactosaminoglycans (chondroitin sulphate and dermatan sulphate) increased in neoplastic tissues when compared to non-neoplastic tissues (p=0.01). (B) Heparan sulphate decreased in neoplastic tissues when compared to non-neoplastic tissue (p=0.03)
A B
DISCUSSION
Interactions between glycans and proteins are crucial to many biological regulatory processes.(4,5,23) The
development of analytical methodologies that enable structural characterization of S-GAG oligosaccharides fostered improved understanding of the specificity of these biomolecular interactions and biological functions.(3-5,16)
S-GAG are difficult molecules for analysis by mass spectrometric due to their high diversity and complexity in saccharide composition, polydispersity, and sequence heterogeneity.(11,23,24)
Various procedures were devised to tag glycans selectively at the reducing end with a group that would enhance the sensitivity of detection and facilitate chromatographic separations.(6,9,25,26) These methods
provide new opportunities for the development of glycomic approaches to study the structure and function of the HS, CS, and DS family of glycans.(1-3,10,14) Thus,
structural characterization of oligosaccharides from PG and other glycoproteins is greatly enhanced through the use of mass spectrometric and gel electrophoresis.(1,2,14)
oligosaccharide sequences for subsequent analysis.(2,3,17)
Overall, the modularity of these techniques provides ease and flexibility for use in conjunction with mass spectrometric and electrophoretic tools for glycomic research studies.(10,12)
This study describes a technique to elucidate the structural information inherent in S-GAG species. First, the use of depolymerizing enzymes that cleave polysaccharides at specific sites is described. Then, the agarose gel electrophoresis technique was employed to characterize the S-GAG species present in an enzymatically cleaved polysaccharide sample. Mass spectrometric procedures were further used to establish the length of an oligosaccharide chain and the presence of specific functional oligosaccharide and disaccharide groups.
To our knowledge, the present study was the first to describe the application of ESI-MS in the identification of S-GAG from the extracellular matrix of non-neoplastic and neoplastic colorectal tissues. After digestion with chondroitinase AC and chondroitinase B, the pool of disaccharides could be directly separated by liquid chromatography onto a porous graphitized carbon column and identified by online electrospray mass spectrometric under negative ionization conditions. The relative intensities of the fragment ions obtained by the mass spectrometric-based method allow one to distinguish the sulphate position. Calibration with standard disaccharides allows quantification of the different isomers.
During tumor growth, transformed cells remodel the extracellular space for dynamic growth conditions.(5,8)
As PG and S-GAG are negatively charged ubiquitous components of all matrices, and during the process of tumor growth, they constitute a real interface in the dynamic exchange between transformed cells and normal tissue.(4,5,8,9)
Actually, PG and S-GAG have contradictory properties in tumor progression during stromal reaction.(15,25)
Stromal PG have antiproliferative properties, while the S-GAG liberated after PG degradation, and its degradation oligosaccharides promote cancer cell migration.(2,17) The results of this study showed that
neoplastic tissues present higher amounts of CS/DS, as compared to the non-neoplastic tissues, while HS was decreased in neoplastic tissues. This finding of reduced amount of HS corroborates with literature data demonstrating HS as important glycosaminoglycan for cell-cell recognition and cell cycle inhibition.(5,27) On the
other hand, increased CS and DS in neoplastic tissues may be explained by increased cell proliferation, due to the fact that blocking chondroitin synthesis results in
cytokinesis defects in early embryogenesis.(4,5,8) Reversion
of cytokinesis is often observed in chondroitin-depleted embryos, and cell division eventually stops, resulting in early embryonic death, proving that CS is required for embryonic cytokinesis and cell division.(4,5,21,28) The
progression of the tumor may change S-GAG and PG, especially depending on the initial expression pattern of the source cell, which leads to the loss or alteration of the expression pattern.(21,28) This occurs because most
PG present a hybrid molecule, and thereby, the core of the protein can be either glycanated with CS or HS, an event that changes the function of the molecule.(4,5)
Furthermore, protein core fragments, emerging from PG degradation, may also possess biological activity.(6,29)
The broad applicability of this powerful platform offers an insight into how changes in cell surface, extracellular matrix, and S-GAG composition and sequence influence the ability of the cells and tissues to dynamically alter responses to signaling molecules in colorectal carcinoma.(5,8,15) Thus, this approach provides a
window into how changes at the structural disaccharides composition level of each glycosaminoglycan could affect the cellular phenotype in the malignant disease or non-neoplastic tissue, due to the fact that glycosaminoglycan chain composition defines specific binding and promotes defined biological function.(6,15,16,30)
The technique of ESI-MS allowed the study of structural fragments generated by ionizing the sample, and the agarose gel electrophoresis was able to identify and quantify S-GAG (CS, DS, and HS) in colorectal carcinoma and colorectal non-neoplastic tissues.(24)
This method provides new opportunities for developing glycomic approaches to study the structure and function of CS, DS, and HS in colorectal carcinoma and colorectal non-neoplastic tissues.(4,8,21)
CONCLUSION
The structural profile of glycosaminoglycans in the colorectal tissue can be determined by electrospray ionization mass spectrometry after proteolysis and electrophoresis. The increased amount of chondroitin and dermatan suggests that they play a role in neoplastic spread, while the reduced amount of heparan indicate its role as an inhibitor of neoplastic proliferation.
REFERENCES
1. Antonopoulos A, Favetta P, Jacquinet JC, Lafosse M. Tandem mass spectrometry for the characterization of sulphated-phosphorylated analogues of the carbohydrate-protein linkage region of proteoglycans. J Mass Spectrom. 2005;40(12):1628-36.
2. Barroso B, Didraga M, Bischoff R. Analysis of proteoglycans derived sulphated disaccharides by liquid chromatography/mass spectrometry. J Chromatogr A. 2005;1080(1):43-8.
3. Bielik AM, Zaia J. Extraction of chondroitin/dermatan sulfate glycosaminoglycans from connective tissue for mass spectrometric analysis. Methods Mol Biol. 2010;600:215-25.
4. Hatabe S, Kimura H, Arao T, Kato H, Hayashi H, Nagai T, et al. Overexpression of heparan sulfate 6-O-sulfotransferase-2 in colorectal cancer. Mol Clin Oncol. 2013;1(5):845-50.
5. Raman K, Kuberan B. Chemical Tumor Biology of Heparan Sulfate Proteoglycans. Curr Chem Biol. 2010;4(1):20-31.
6. Nikitovic D, Chatzinikolaou G, Tsiaoussis J, Tsatsakis A, Karamanos NK, Tzanakakis GN. Insights into targeting colon cancer cell fate at the level of proteoglycans / glycosaminoglycans. Curr Med Chem. 2012;19(25):4247-58.
7. Yang XY, Li YX, Li M, Zhang L, Feng LX, Zhang N. Hyaluronic acid-coated nanostructured lipid carriers for targeting paclitaxel to cancer. Cancer Lett. 2013;334(2):338-45.
8. Jeronimo SA, Sales AO, Fernandes MZ, Melo FP, Sampaio LO, Dietrich CP, et al. Glycosaminoglycan structure and content differ according to the origins of human tumors. Braz J Med Biol Res. 1994;27(9):2253-8.
9. Wegrowski Y, Maquart FX. Involvement of stromal proteoglycans in tumour progression. Crit Rev Oncol Hematol. 2004;49(3):259-68. Review.
10. Estrella RP, Whitelock JM, Roubin RH, Packer NH, Karlsson NG. Small-scale enzymatic digestion of glycoproteins and proteoglycans for analysis of oligosaccharides by LC-EM and FACE gel electrophoresis. Methods Mol Biol. 2009;534:171-92. Review.
11. Hu P, Fang L, Chess EK. Source-induced fragmentation of heparin, heparan, and galactosaminoglycans and application. Anal Chem. 2009;81(6):2332-43. 12. Oguma T, Tomatsu S, Montano AM, Okazaki O. Analytical method for
the determination of disaccharides derived from keratan, heparan, and dermatan sulfates in human serum and plasma by high-performance liquid chromatography/turbo ionspray ionization tandem mass spectrometry. Anal Biochem. 2007;368(1):79-86.
13. Cain SA, McGovern A, Small E, Ward LJ, Baldock C, Shuttleworth A, et al. Defining elastic fiber interactions by molecular fishing: an affinity purification and mass spectrometry approach. Mol Cell Proteomics. 2009;8(12):2715-32. 14. Skidmore M, Atrih A, Yates E, Turnbull JE. Labeling heparan sulphate saccharides
with chromophore, fluorescence and mass tags for HPLC and MS separations. Methods Mol Biol. 2009;534:157-69. Review.
15. Jankova L, Chan C, Fung CL, Song X, Kwun SY, Cowley MJ, et al. Proteomic comparison of colorectal tumours and non-neoplastic mucosa from paired
patient samples using iTRAQ mass spectrometry. Mol Biosyst. 2011;7(11): 2997-3005.
16. Dündar M, Müller T, Zhang Q, Pan J, Steinmann B, Vodopiutz J, et al. Loss of dermatan-4-sulfotransferase 1 function results in adducted thumb-clubfoot syndrome. Am J Hum Genet. 2009;85(6):873-82.
17. Babu P, Kuberan B. Fluorescent-tagged heparan sulfate precursor oligosaccharides to probe the enzymatic action of heparitinase I. Anal Biochem. 2010;396(1):124-32.
18. Michelacci YM, Dietrich CP. Chondroitinase C from Flavobacterium heparinum. J Biol Chem. 1976;251(4)1154-8.
19. Nader HB, Porcionatto MA, Tersariol IL, Pinhal MA, Oliveira FW, Moraes CT, et al. Purification and substrate specificity of heparitinase I and heparitinase II from Flavobacterium heparinum. Analyses of the heparin and heparan sulfate degradation products by 13C NMR spectroscopy. J Biol Chem. 1990; 265(28):16807-13.
20. Hitchcock AM, Yates KE, Costello CE, Zaia J. Comparative glycomics of connective tissue glycosaminoglycans. Proteomics. 2008;8(7):1384-97. 21. Koshiyama A, Ichibangase T, Imai K. Comprehensive fluorogenic
derivatization-liquid chromatography/tandem mass spectrometry proteomic analysis of colorectal cancer cell to identify biomarker candidate. Biomed Chromatogr. 2013; 27(4):440-50.
22. Lyon M, Gallagher JT. Purification and partial characterization of the major cell-associated heparan sulphate proteoglycan of rat liver. Biochem J. 1991; 273(Pt 2):415-22.
23. Tímár J, Lapis K, Dudás J, Sebestyén A, Kopper L, Kovalszky I. Proteoglycans and tumor progression: Janus-faced molecules with contradictory functions in cancer. Semin Cancer Biol. 2002;12(3):173-86. Review.
24. Zamfir AD, Flangea C, Sisu E, Serb AF, Dinca N, Bruckner P, et al. Analysis of novel over- and under-sulfated glycosaminoglycan sequences by enzyme cleavage and multiple stage MS. Proteomics. 2009;9(13):3435-44.
25. Peerless Y, Simon E, Sabo E, Ben-Izhak O, Hershkovitz D. Normal colon tissue and colon carcinoma show no difference in heparanase promoter methylation. Exp Mol Pathol. 2013;94(2):309-13.
26. Wang C, Lin S, Nie Y, Jia X, Wang J, Xiao J, et al. Mechanism of antitumor effect of a novel bFGF binding peptide on human colon cancer cells. Cancer Sci. 2010;101(5):1212-8.
27. Porcionatto MA, Pinto CR, Dietrich CP, Nader HB. Heparan sulfate proteoglycan and control of cell proliferation: enhanced synthesis induced by phorbol ester (PMA) during G(1)-phase. Braz J Med Biol Res. 1994;27(9):2185-90. 28. Maes E, Valkenborg D, Mertens I, Broeckx V, Baggerman G, Sagaert X, et al.
Proteomic analysis of formalin-fixed paraffin-embedded colorectal cancer tissue using tandem mass tag protein labeling. Mol Biosyst. 2013;9(11):2686-95. 29. Martínez-Aguilar J, Chik J, Nicholson J, Semaan C, McKay MJ, Molloy MP.
Quantitative mass spectrometry for colorectal cancer proteomics. Proteomics Clin Appl. 2013;7(1-2):42-54. Review.