Cerebrospinal luid biomarkers for the differential
diagnosis of Alzheimer’s disease
Aplicação de biomarcadores do fluido cerebrospinal no diagnóstico
diferencial da doença de Alzheimer
Carolina A. Magalhães1; Micheli Figueiró1; Vanessa G. Fraga1; Elvis C. Mateo2; André A. S. F. Toledo1; Maria das Graças Carvalho1; Paulo Caramelli1; Karina B. Gomes1
1. Universidade Federal de Minas Gerais (UFMG). 2. Instituto Hermes Pardini.
First submission on 18/07/15; last submission on 02/09/15; accepted for publication on 03/09/15; published on 20/12/15
ABSTRACT
Introduction: Several studies have been conducted in order to validate cerebrospinal luid biomarkers for the diagnosis of Alzheimer’s disease (AD), aiming primarily to facilitate the early diagnosis. Objective: To evaluate CSF biomarkers on patients with probable AD and the applicability of the international references values in this population. Methods: 46 individuals were recruited and classiied as probable
AD (n = 19), mild cognitive impairment (MCI) (n = 5) and other dementias (n = 22). The cerebrospinal luid (CSF) biomarkers were measured using the INNOTEST kits for enzyme-linked immunosorbent assay (ELISA). Higher Tau protein values and lower Aβ and Innotest Amyloid Tau Index (IATI) values were observed in AD group when compared with MCI; higher levels of Tau and phosphorylated Tau (P-Tau), and lower Aβ and IATI values were observed in AD group when compared to patients with other dementias. No biomarker or IATI was able to distinguish between MCI and other dementias. The kappa index between biomarkers and the clinical diagnosis was regular to Tau and IATI, and weak to Aβ and P-tau. Conclusion: The cut-off values for each biomarker that showed better combined sensibility and speciicity differ from the reference values suggested by the manufacturer. The CSF biomarkers represent important resources that can help with the AD diagnosis, although the results interpretation must be made based on the analysis of the three analytes together. The cut-off values must be established to address the speciicities and characteristics of each population.
Key words: amyloid; tau proteins; Alzheimer’s disease; cerebrospinal luid.
INTRODUCTION
Dementia is a general term representing a number of neurodegenerative impairments, whose common characteristic is limitation on autonomy and poor quality of life. Intrinsically age-related, these clinical conditions have been increasing in social and public health contexts worldwide. According to the World Health Organization (2011)(1), developing countries such
as Brazil, currently have the most pronounced aging population rates that relects a rapid growth, especially among age groups over 65 years. A systematic review of articles published in our country found a prevalence of dementia between 5.1% and 19% in the elderly aged 60 years or over(2).
Dementia includes memory impairment with loss of ability to learn new information or remember information previously
learned, as well as the presence of at least one of the following alterations that may compromise the social and occupational activities of the individual: aphasia (language impairment); apraxia (impaired ability to carry out motor activities despite intact motor function); agnosia (failure to recognize or identify objects despite intact sensory function), and executive functions deicities (ie, planning, organizing, sequencing and abstraction). Among possible causes of dementia, Alzheimer’s disease (DA) is the most common, accounting for 50%-70% of cases(3, 4).
In the last decade, several studies have been conducted to validate biomarkers in cerebrospinal luid (CSF) for the diagnosis of AD, aiming primarily to facilitate the early diagnosis of this dementia syndrome. The studies are dedicated primarily for measuring, in the cerebrospinal luid, the two key proteins involved in the disease: a) beta-amyloid protein (Aβ1-42 or simply Aβ), the main component
of amyloid plaques, which is decreased in the CSF of patients with AD due to its deposition in brain parenchyma, and b) tau protein and phosphorylated Tau (P-tau), which are increased in the CSF of patients due to neuronal degeneration associated with the intracellular accumulation of neuroibrillary tangles(5-10).
The examination of these biomarkers in the CSF may increase the accuracy of diagnosis in clinical practice, both in dementia phase as in mild cognitive impairment (MCI), which is described as the intermediate state between normal cognitive aging and dementia, or more speciically, AD(11). Moreover, these biomarkers have been
correlated with the intensity of neuropathological lesions and have demonstrated sensitivity and speciicity of approximately 85%-90% for AD diagnosis(6, 12). CSF biomarker analysis may be applied for
identifying asymptomatic individuals at risk of developing and preclinical stages of AD, elucidation of atypical AD cases, monitoring disease progression, and evaluation of response to treatment(13).
Studies show that the results of biomarkers should always be evaluated as a whole to characterize the pathological signature in AD(5-10), which gives strength to the diagnostic laboratory
inding. Therefore, Innotest Amyloid Tau Index (IATI) obtained by the relation between Aβ and Tau values: (Aβ1-42/(240 + 1.18 × Tau) shows better performance diagnosis for AD than the isolated result of each biomarker(14, 15).
Despite the advantages of using biomarkers in CSF to aid in the diagnosis of AD, there some are still challenges in the implementation of these tools in the laboratory routine, especially regarding the reproducibility of results and the establishment of optimal cut-off values. This dificulty is exempliied by the fact that in multicenter studies, including different laboratories using the same biochemical assay, a large variability of these biomarkers
levels have been found(12). A number of reasons may explain the
interlaboratory variations of these measurements; among them:
demographic characteristics of patients, source of recruitment, severity of disease, and selection and diagnosis criteria. Other factors may also be involved, such as the process of obtaining the CSF, collection and sample transportation, besides the storage conditions. Other interfering include variations of the kits used in the assay, laboratory equipment and variations in test procedure(12). Therefore,
it is essential that each laboratory establish its own reference values or a reproducible methodology used in other laboratories(14).
OBJECTIVE
This study aimed at assessing biomarkers from the
cerebrospinal luid, Aβ, Tau and P-tau proteins, in a sample of the
Brazilian population, since there are no validation studies of these biomarkers in this population. Thus, our results may contribute
to the suitability of using these CSF biomarkers and determining
reference values in clinical laboratories in Brazil.
METHODS
Participants
We recruited 46 patients seen in the Neurology clinic at the Hospital das Clínicas da Universidade Federal de Minas Gerais (UFMG), Belo Horizonte (MG), from November 2012 to March 2014. The average age was 65.89 ± 9.65, of which 29 female patients and 17 male.
The participants underwent clinical and neurological exams, including cognitive and functional assessment. Diagnoses were based on the criteria of the National Institute on Aging and the Alzheimer’s Association workgroup(16) and the National Institute
of Neurological and Communicative Disorders and Stroke and the Alzheimer’s Disease and Related Disorders Association (NINCDS-ADRDA)(17). Based on the clinical diagnosis, the participants were
divided into the following groups: probable AD (n = 19), MCI (n = 5), other dementias/clinical conditions: behavioral variant frontotemporal dementia (bvFTD) (n = 19), primary progressive
aphasia (PPA) (n = 2), and antibodies anti-N-methyl-D-aspartate (NMDA) receptor encephalitis (n = 1), these conditions’ symptoms
overlap with MCI or AD.
This study was approved by the Research Ethics Committee of the UFMG, and all participants or their caregivers signed a consent form prior to collection.
CSF analysis
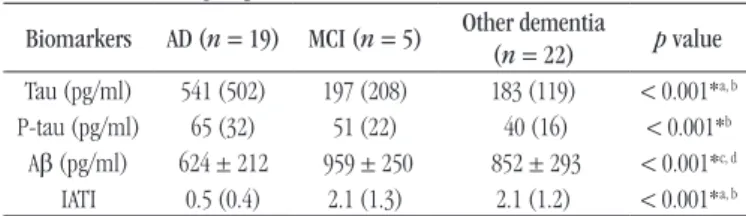
TABLE 1 − Comparison of Tau, P-tau and Aβ values and IATI in groups with AD, MCI and other dementia
Biomarkers AD (n = 19) MCI (n = 5) Other dementia
(n = 22) p value
Tau (pg/ml) 541 (502) 197 (208) 183 (119) < 0.001*a, b
P-tau (pg/ml) 65 (32) 51 (22) 40 (16) < 0.001*b
Aβ (pg/ml) 624 ± 212 959 ± 250 852 ± 293 < 0.001*c, d
IATI 0.5 (0.4) 2.1 (1.3) 2.1 (1.2) < 0.001*a, b
Variable expressed as median (interquartile range) or mean ± standard deviation.
P-tau: phosphorylated Tau protein; Aβ: amyloid beta-protein; IATI: Innotest Amyloid Tau
Index; AD: Alzheimer’s disease; MCI: mild cognitive impairment; a: p = 0.007 between
AD × MCI to Tau and IATI; b: p < 0.001 between AD × other dementia to Tau, P-tau and
IATI; c: p = 0.005 between AD × MCI to Aβ, d: p = 0.002 between AD × other dementia to
Aβ; * significant: p < 0.05.
TABLE 2 − Comparison of Tau, P-tau and Aβ values and IATI in groups with AD/MCI e other dementia
Biomarkers AD/MCI (n = 24) Other dementia
(n = 22) p value
Tau (pg/ml) 488 (603) 183 (119) < 0.001*
P-tau (pg/ml) 60 (26) 40 (16) < 0.001*
Aβ (pg/ml) 685 (252) 852 (293) 0.019*
IATI 0.6 (0.9) 2.1 (1.2) < 0.001*
Variable expressed as median (interquartile range) or mean ± standard deviation.
P-tau: phosphorylated Tau protein; Aβ: amyloid beta-protein; IATI: Innotest Amyloid Tau
Index; AD: Alzheimer’s disease; MCI: mild cognitive impairment; * significant: p < 0.05.
for the three biomarkers using kits of the same lot, and intra-assay variations based on replicates was < 5%. In all assays was used an internal quality control.
Statistical analysis
Statistical analyzes were performed using SPSS v. 13.0 software. Shapiro-Wilk test was used to evaluate the normality of the variables. The comparison for two groups was performed by the Mann-Whitney or t-test for non-parametric and parametric variables, respectively. The comparison between the three groups was performed by the Analysis of Variance (ANOVA) post-hoc least-signiicance difference (LSD) or Kruskall-Wallis, followed by Mann-Whitney test with Bonferroni correction, for parametric and nonparametric variables, respectively. Correlations were evaluated by Pearson, for parametric variables, or Spearman, for nonparametric. The agreement between the variables was evaluated by the kappa index. Receiver operating characteristic (ROC) curves were used to represent the sensitivity and speciicity to AD diagnose in different cut-off values. The best cut-off for each marker has been established by the highest value of the Youden index based on ROC curve. We considered p < 0.05 value
signiicant.
RESULTS
The median values and average concentration of each biomarker measured in the CSF and the IATI calculated are shown in Tables 1 and 2. In Table 1, individuals with probable AD, MCI and other dementia/other medical conditions; in Table 2, individuals with AD or MCI in relation to other dementias.
We observed higher values of Tau protein and lower values
of Aβ and IATI in the AD group when compared with MCI group. We was also observed increased levels of Tau e P-tau, as well as lower levels of Aβ and IATI in AD group when compared with patients with other dementias. However, no biomarker or IATI was able to distinguish between MCI and other dementias (Table 1). In addition, signiicant differences were found between AD/MCI groups and other dementias with higher levels of Tau, P-tau and lower levels of Aβ and IATI in the irst group.
Considering the diagnosis of AD based on IATI reference values provided by the manufacturer (< 0.8) compared with the clinical diagnosis (in this case considered the gold standard), sensitivity 63.6%, speciicity 89.6%, positive predictive value (PPV) 87.5%, negative predictive value (NPV) 68.4%, and accuracy 75.8% was
obtained for the diagnosis of AD. The result of the kappa index among the variables and the clinical diagnosis was regular for Tau and IATI (0.568 for both), and weak to Aβ (0.111) and P-tau (0.371).
The ROC curve was determined for the variables Tau, P-tau,
Aβ and IATI, considering the AD classiication according to the clinical diagnosis (Figure). It was observed an area under the
curve 0.821 for Tau and 0.817 for p-tau, and good the relationship between these biomarkers and clinical diagnosis is considered(18).
As for Aβ and IATI, the area under the curve was 0.701, and 0.777,
this relationship is considered poor and regular, respectively(18).
Analyzing the same ROC curves, we evaluated the sensitivity and speciicity criteria based on different concentrations of the markers, which were simulated as possible reference value or
TABLE 3 − Coordinates of each ROC curves in the diagnosis of probable AD for Tau, P-tau and Aβ variables and IATI in the group with clinical AD
Variable Positive if greateror less than Sensitivity 1-Speciicity
Tau
190 0.879 0.379
194.5 0.848 0.379
197.5 0.818 0.379
206.5 0.788 0.379
227 0.788 0.345
241.5 0.788 0.310
244.5 0.788 0.276
251 0.758 0.276
257.7 0.758 0.241
265.7 0.758 0.207
277.5 0.727 0.207
292.5 0.727 0.172
304 0.697 0.172
327.5 0.697 0.138
353.5 0.667 0.138
384 0.667 0.103
418.5 0.636 0.103
435.5 0.606 0.103
P-tau
42.2 0.879 0.379
44 0.879 0.345
45.5 0.848 0.345
46.7 0.818 0.276
47.7 0.818 0.241
50 0.788 0.241
53 0.758 0.207
54.5 0.606 0.207
Aβ
648.5 0.606 0.207
656.5 0.606 0.241
661.5 0.606 0.276
663 0.636 0.276
664.5 0.667 0.276
665.5 0.697 0.276
680 0.727 0.276
706 0.727 0.310
728 0.727 0.345
745 0.727 0.379
IATI
0.75 0.606 0.103
0.85 0.667 0.103
0.95 0.727 0.138
1.05 0.758 0.138
1.15 0.758 0.207
1.30 0.758 0.241
1.55 0.758 0.345
1.75 0.788 0.379
ROC: receiver operating characteristic; AD: Alzheimer’s disease; P-tau: phosphorylated Tau
protein; Aβ: amyloid beta-protein; IATI: Innotest Amyloid Tau Index.
better sensitivity and speciicity combined. For IATI the 1.05 cut-off showed best combined values of sensitivity and speciicity, around 75% and 84%, respectively.
When Tau, P-tau and Aβ variables were correlated, there was a strong positive correlation between Tau and P-tau levels (r =
0.917, p < 0.001) and strong negative correlation between Aβ and Tau levels (r = -0.659, p < 0.001), and Aβ and P-tau (r = -0.612, p < 0.001).
DISCUSSION
To our knowledge, this is the irst study to assess the concentration of CSF markers for the diagnosis of AD in Brazil. Although this is a preliminary study that requires a larger sample size to validate the indings, the obtained data demonstrate the need for the laboratory to establish the reference values, according to the characteristics of each population, for the diagnosis of the disease.
Currently, the majority of AD patients are diagnosed based on clinical criteria and exclusion of other diseases that cause dementia. While these criteria are widely used, their sensitivity varies around
70.9%-87.3% and speciicity between 44.3%-70.8%(19). Thus, a
large percentage of patients are misclassiied, particularly the cases of early AD, atypical AD or with multiple etiologies(20). CSF
FIGURE − ROC curve for Aβ (A), Tau (B), P-tau (C) and IATI (D) biomarkers considering the clinical diagnosis as reference
ROC: receiver operating characteristic; Aβ: amyloid beta-protein; P-tau: phosphorylated Tau
protein; IATI: Innotest Amyloid Tau Index.
B
D C
A ROC curve
ROC curve ROC curve ROC curve Sensitivity Sensitivity Sensitivity 1.0 0.8 0.6 0.4 0.2 0.0 1.0 0.8 0.6 0.4 0.2 0.0 1.0 0.8 0.6 0.4 0.2 0.0
1 - Specificity
1 - Specificity 1 - Specificity
0.0 0.2 0.4 0.6 0.8 1.0
0.0 0.2 0.4 0.6 0.8 1.0 0.0 0.2 0.4 0.6 0.8 1.0
Diagonal segments are produced by ties Diagonal segments are produced by ties
Sensitivity 1.0 0.8 0.6 0.4 0.2 0.0
1 - Specificity
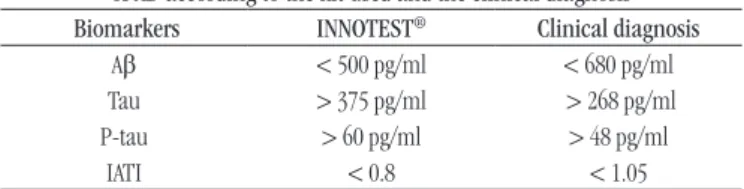
between the two criteria were suggested (Table 4), which differed from the values suggested by the kit manufacturer. However, choosing the best cut-off should be discussed with clinicians, since the impact of false positive or false negative results should be evaluated selectively. According to ABSI, because there is no yet an effective therapy for AD, it is better to incorrectly diagnose some patients who actually have the disease than patients classiied as healthy individuals(24). It will also be necessary to
establish, based on Brazilian large cohort studies, the “gray zone” or each biomarker and IATI value. Although commonly it has been used values 10% higher or lower than the reference value for determining test positivity or negativity(21), this value is
arbitrary and its interpretation must be done with caution – an um “unlikely AD” does not mean an “excluded AD”(24).
It should also be considered that the AD develops a dynamically and progressively, which means that the cut-off values can be modiied depending on the course of the disease (preclinical and clinical phase) and age group. The inal diagnosis should be complemented, whenever possible, with imaging tests such as magnetic resonance imaging (MRI) and positron emission tomography (PET)(25-27).
It is noteworthy that no biomarker provided suficient sensitivity and speciicity for the diagnosis of AD when assessed alone, which justiies the recommendation of a joint assessment of the three biomarkers. The mathematical calculation of the IATI, based on these markers, that although has demonstrated a strong correlation, meaning that they have the same tendency for the diagnosis, did not show suficient accuracy to be used alone for the diagnosis of AD. This fact conirms the need to include other parameters along with the cognitive tests and clinical features for the diagnosis to be completed.
biomarkers are important to optimize the diagnosis, especially in differentiating AD from other neurodegenerative disorders such as frontotemporal, vascular, psychiatric dementia or neuroinfectious
diseases.
According to members of Alzheimer’s Biomarkers Standardization Initiative (ABSI)(21), the measurement of CSF
biomarkers should be considered for patients with early AD, MCI or with atypical presentations of dementia with complex differential diagnosis. Furthermore, they must be evaluated in together with Tau, P-tau and Aβ values for greater accuracy in the AD diagnosis, which can be interpreted using in the IATI calculation.
In this study, the use of Tau, Aβ and IATI markers calculated was useful for the differential diagnosis of MCI or other dementia and AD, while the p-tau values differentiated only AD and other dementia groups, which conirms the usefulness of these markers
in the differential diagnosis and the need for the analysis to be
performed together. Furthermore, data suggest the use of markers for checking the conversion of prodromal MCI stage to AD. However, it should be noted that the CSF markers were unable to differentiate the individual with MCI from those with other types of dementia, and, therefore, it is not suitable for cases where the AD is unlikely.
When the AD and MCI groups were collected and the values of variables compared to the group with other dementia, all biomarkers and IATI showed differences between groups, suggesting its usefulness in the diagnosis of pre-clinical and clinical stages of AD compared with other dementias.
Although INNOTEST® kit is not the only kit commercially
available for the quantiication of these markers, it is known that its use is widespread, and in Brazil it is already being applied in the routine laboratory. Considering the clinical diagnosis of AD and diagnosis performed in our patients based on IATI provided by the manufacturer, were observed low sensitivity and NPV, as well as regular to weak relationship with the clinical diagnosis measured by the kappa index, which suggests that the cut-off value of IATI suggested by the manufacturer is not suitable for the population
studied.
In fact, the variability of the cut-off between different laboratories, using the same, can reach 20%-30%(14, 22). Since
these values are calculated using the results from patients with clinical diagnosis of AD, patients with other types of dementia and healthy individuals may exhibit altered biomarker values without necessarily demonstrate the clinical features of the disease, since AD may be present up to 20 years before the onset of symptoms(23).
There was variation in sensitivity and speciicity according to different cut-off values. The values that showed better balance
TABLE 4 − Comparative description of cut-off values for diagnosis of AD according to the kit used and the clinical diagnosis Biomarkers INNOTEST® Clinical diagnosis
Aβ < 500 pg/ml < 680 pg/ml
Tau > 375 pg/ml > 268 pg/ml
P-tau > 60 pg/ml > 48 pg/ml
IATI < 0.8 < 1.05
AD: Alzheimer’s disease; Aβ: amyloid beta-protein; P-tau: phosphorylated Tau protein;
IATI: Innotest Amyloid Tau Index.
CONCLUSION
assist the medical team. It is true that the search for predictive biomarkers for AD is a high priority on research related to neurodegenerative diseases and, in the near future, it is expected to establish cut-off values that meet specificities of each population, enabling the use of these tools in the search of early diagnosis of AD and modifying perspective of the course of the disease.
ACKNOWLEDGEMENTS
Conselho Nacional de Desenvolvimento Cientíico e Tecnológico (CNPq), Fundação de Amparo à Pesquisa do Estado de Minas Gerais (FAPEMIG) and Coordenação de Aperfeiçoamento de Pessoal de Nível Superior (CAPES).
MGC, PC and KBG are grateful to CNPq for productivity grant.
RESUMO
Introdução: Estudos têm sido conduzidos no sentido de validar biomarcadores no liquor para o diagnóstico da doença de Alzheimer (DA), objetivando, sobretudo, facilitar o diagnóstico precoce. Objetivo: Avaliar os biomarcadores do liquor em indivíduos com provável DA, bem como a aplicabilidade dos valores de referência internacionais nesta população. Métodos: Foram recrutados 46 indivíduos, sendo classificados como provável DA (n = 19), comprometimento cognitivo leve (CCL) (n = 5) e outras demências (n = 22). Os biomarcadores foram dosados no liquor utilizando-se os kits INNOTEST por ensaio imunossorvente ligado à enzima (ELISA). Maiores valores de proteína Tau e menores valores de Aβ e índice Innotest Amiloide Tau Index (IATI) foram observados no grupo de DA quando comparados com o de CCL; maiores níveis de Tau e Tau fosforilada (Tau-P) e menores valores de Aβ e IATI foram observados no grupo de DA quando comparados com os pacientes que apresentavam outras demências. Nenhum biomarcador ou o IATI foi capaz de discernir entre CCL e outras demências. O índice kappa entre os biomarcadores e o diagnóstico clínico foi regular para a Tau e IATI, e fraco para Aβ e Tau-P. Conclusão: Os valores de cut-off para cada biomarcador que apresentou melhor sensibilidade e especificidade conjugadas diferiram dos valores de referência sugeridos pelo fabricante. Os biomarcadores do liquor representam importantes recursos que podem auxiliar no diagnóstico da DA, mas a interpretação dos resultados deve ser feita com base na análise dos três analitos em conjunto. Os valores de cut-off devem ser estabelecidos de modo a atender as especificidades e as características de cada população.
Unitermos: amiloide; proteínas tau; doença de Alzheimer; líquido cefalorraquidiano.
REFERENCES
1. Global Health and Aging. World Health Organization, National Institute on Aging, 2011. Available at: www.who.int/. [Acessed on: 16 fev. 2015]. 2. Fagundes SD, Silva MT, Thees MFRS, Pereira MG. Prevalence of dementia among elderly Brazilians: a systematic review. Sao Paulo Med J. 2011; 129(1): 46-50.
3. Fratiglioni L, Ronche D, Agüero-Torres H. Worldwide prevalence and incidence of dementia. Drugs Aging. 1999; 15(5): 365-75.
4. Cacabelos R. Pharmacogenomics in Alzheimer’s disease. Methods Mol Biol. 2008; 448: 213-357.
5. Dubois B, Feldman HH, Jacova C, et al. Advancing research diagnostic criteria for Alzheimer’s disease: the IWG-2 criteria. Lancet Neurol. 2014; 13(6): 614-29.
6. Caramelli P, Teixeira AL, Buchpiguel CA, et al. Doença de Alzheimer: exames complementares. Dement Neuropsychol. 2011; 5(Suppl. 1): 11-20.
7. Hansson O, Zetterberg H, Buchhave P, Londos E, Blennow K, Minthon L. Association between CSF biomarkers and incipient Alzheimer’s disease
in patients with mild cognitive impairment: a follow-up study. Lancet Neurol. 2006; 5: 228-34.
8. Fei M, Jianghua W, Rujuan M, Wei Z, Qian W. The relationship of plasma Aβ levels to dementia in aging individuals with mild cognitive impairment. J Neurol Sci. 2011; 305: 92-6.
9. Buchhave P, Minthon L, Zetterberg H, Wallin AK, Blennow K, Hansson O. Cerebrospinal luid levels of β-amyloid 1-42, but not of tau, are fully changed already 5 to 10 years before the onset of Alzheimer dementia. Arch Gen Psychiatry. 2012; 69: 98-106.
10. Vlachos GS, Paraskevas GP, Naoumis D, Kapaki E. Cerebrospinal luid
β-amyloid 1-42 correlates with rate of progression in Alzheimer’s disease. J Neural Transm. 2012; 119: 799-804.
11. Petersen RC, Stevens JC, Ganguli M, et al. Practice parameter: early detection of dementia: mild cognitive impairment (an evidence based review). Report of the Quality Standards Subcommittee of the American Academy of Neurology. Neurology. 2001; 56: 1133-42.
13. Babic M, Strac DS, Mück-seler D, et al. Update on the core and developing cerebrospinal luid biomarkers for Alzheimer disease. Croat Med J. 2014; 55(4): 347-65.
14. Mattsson N, Andreasson U, Persson S, et al. CSF biomarker variability in the Alzheimer’s Association quality control program. Alzheimers Dement. 2013; 9: 251-61.
15. Vos SJ, Visser PJ, Verhey F, et al. Variability of CSF Alzheimer’s disease biomarkers: implications for clinical practice. PLoS One. 2014; 9(6): e100784.
16. Mckhann GM, Knopman AS, Chertkow H, et al. The diagnosis of dementia due to Alzheimer’s disease: recommendations from the National Institute on Aging-Alzheimer’s Association workgroups on diagnostic guidelines for Alzheimer’s disease. Alzheimers Dement. 2011; 7(3): 263-9. 17. Roman GC, Tatemichi TK, Erkinjuntti T, et al. Vascular dementia: diagnostic criteria for research studies. Report of the NINDS-AIREN International Workshop. Neurology. 1993; 43(2): 250-60.
18. Motta VT, Filho PFO. SPSS: análise de dados biomédicos. Rio de Janeiro; 2009.
19. Beach TG, Monseli SE, Phillips LE, Kukull W. Accuracy of the clinical diagnosis of Alzheimer disease at National Institute on Aging Alzheimer Disease Centers, 2005-2010. J Neuropathol Exp Neurol. 2012; 71: 266-73. 20. Balasa M, Gelpi E, Antonell A, et al. Clinical features and APOE genotype of pathologically proven early-onset Alzheimer disease. Neurology. 2011; 76: 1720-5.
21. Lewczuk P, Zimmermann R. Neurochemical dementia diagnostics: a simple algorithm for interpretation of the CSF biomarkers. J Neural Transm. 2009; 116: 1163-7.
22. Vanderstichele H, Bibi M, Engelborghs S, et al. Standardization of preanalytical aspects of cerebrospinal luid biomarker testing for Alzheimer’s disease diagnosis: a consensus paper from the Alzheimer’s Biomarkers Standardization Initiative. Alzheimers Dement. 2012; 8: 65-73. 23. Price JL, Morris JC. Tangles and plaques in nondemented aging and “preclinical” Alzheimer’s disease. Ann Neurol. 1999; 45: 358-68. 24. Molinuevo JL, Blennow K, Dubois B, et al. The clinical use of cerebrospinal luid biomarker testing for Alzheimer’s disease diagnosis: a consensus paper from the Alzheimer’s Biomarkers Standardization Initiative. Alzheimers Dement. 2014; 10(6): 808-17.
25. Ewers M, Brendel M, Rizk-Jackson A, et al. Reduced FDG-PET brain metabolism and executive function predict clinical progression in elderly healthy subjects. Neuroimage Clin. 2013; 4: 45-52.
26. Trzepacz PT, Yu P, Sun J, et al. Comparison of neuroimaging modalities for the prediction of conversion from mild cognitive impairment to Alzheimer’s dementia. Neurobiol Aging. 2014; 35: 143-51.
27. Takahashi R, Ishii K, Senda M, et al. Equal sensitivity of early and late scans after injection of FDG for the detection of Alzheimer pattern: an analysis of 3D PET data from J-ADNI, a multi-center study. Ann Nucl Med. 2013; 27: 452-9.
MAILING ADDRESS
Karina Braga Gomes