Autoverification of the automated blood cell counter
(CBC) in a reference laboratory in Bogota, Colombia
Autoverificação do contador de células automatizado de sangue (CBC)
em um laboratório de referência em Bogotá, Colômbia
Oscar Martinez-Nieto1; Adriana Lozano-Gaitán1; Paola Beltrán-Diaz1; Ivan Leonardo Mojica-Figueroa1; Olga Lucia Morales-Reyes1; Mario A. Isaza-Ruget2
1. Clínica Colsanitas S.A., Bogotá, Colômbia. 2. Organización Sanitas S.A., Bogotá, Colômbia.
First submission on 14/05/15; last submission on 16/05/15; accepted for publication on 31/08/15; published on 20/12/15
ABSTRACT
Introduction: The clinical laboratory is part of the group of actors in health systems that are under increasing pressure by users and administrators to increase their productivity in order to respond eficiently to the increased volume of patients, optimizing costs and professional time. This pressure forced laboratories to perform a full review of their procedures and develop technical, logistical and computational tools to enable excellent response times. Objective: This study aimed to evaluate the implementation of the automated blood cell counter autoveriication process and its impact on the safety of patients. Methods: Veriication rules were designed in the connectivity software, based on manual validation criteria for laboratory professionals, according to the guidelines of the Clinical and Laboratory Standards Institute (CLSI) Guideline Auto10-A and the International Consensus Group for Hematology Review (ISLH). The autoveriication percentage was established, and non-conforming product (NCP) percentages were estimated before and after the procedure. Pilot tests were also performed in different days so as to adjust the process. Results: 53.4% of automated blood cell counters autoveriication were achieved, and, subsequently in the audit of 18 months, 60% was reached due to veriication adjustments in the delta programmed ilter. The NCPs rose from 0.065% to 0.0036% from the beginning to the end of the process. Conclusion: The autoveriication process enabled to
reduce the variability associated with human intervention, therefore the professional is able to focus on the pathological report analysis, reducing the risk of errors and advocating greater importance on patient safety.
Key words: algorithms; interphase; automated data processing; blood cell count; patient safety; laboratory tests.
INTRODUCTION
The clinical laboratory is part of the group of actors in health systems that are daily under increasing pressured by users and administrators to increase their productivity in order to respond eficiently to the increasing volume of patients worldwide, optimizing costs and professional time. This pressure has forced laboratories to perform a full review of their procedures and develop technical, logistical and computational tools to enable excellent response times with a larger volume of samples, thus ensuring sample quality and, irst and foremost, patients safety(1). In 1999, the Institute of Medicine (IOM) published the report: “to err is human: building a safer health system”. This report showed the high rate of wrong procedures for which the medical community and staff related to healthcare are liable(2). Since that point, the development of different strategies aimed at decreasing
error possibilities in the clinical laboratory and pathology was strengthened, mistakes such as barcode sample marking, quality control program massiication, and implementation of technological tools to ensure and improve patient safety(3). The different strategies undertaken by clinical laboratories have made them “key friends” in patient safety programs(4). One of the critical procedures in the laboratory sample processing is the validation of the results obtained. Validation is the process by which the person responsible for processing the sample is liable for reviewing and analyzing the result consistency, according to the patient’s information available, before being delivered to the attending physician(4, 5). This step can be performed manually by the bacteriologist, or it can be part of a process called autoveriication or autovalidation, which mainly aims at controlling the error rate in the results validation process during the post-analytical phase(5). According to the College of American
Pathologists (CAP), autoveriication “is the process by which patient results are generated from interconnected instruments and are subsequently sent to the laboratory information system (LIS), where they are compared against acceptance parameters deined by the laboratory”(6). When the results are within the parameters set, these are released automatically without human intervention. All data outside of the deined parameters are checked by a professional in the laboratory before the reports’s release(6). The quality of the inal result will allow making correct clinical decisions. Classically, autoveriication has been conceived as a process that includes setting decision rules aimed at identifying the error. The concept has, however, become much broader until turning into a high-precision and accuracy computer tool, able to hold patient’s available information, detect analytical error, sample quality, quality control, and lab policy, and release results in real time(7). The group responsible for the autoveriication process must analyze the results release algorithms in order to deine the rules and criteria commonly used for the validation process, and determine which ilters will subsequently remain included in the inal autoveriication algorithm. As part of the continuous improvement program of the Clinical Laboratory, in 2009, it was decided to implement the automated blood cell counter (CBC) autoveriication process in the clinical hematology area, in order to reduce the error rate from the manual result validation and typing. The purpose of the present study is to show the results of such implementation and its impact in patient safety.
METHODS
The study took place in the area of hematology, in a reference laboratory located in the city of Bogota, Colombia; certiied under the ISO 9001-2008, with a local program to ensure patient safety. The laboratory processes about 5,000 samples per day, out of which an average of 1,000 correspond to automated blood cell counters. The hematology area has four laboratory professionals and a technology of the Hematology Transport System (HST) Line consisting of two XE2100 analyzers and two SP1000i slide-maker stainers (Sysmex®, Japan). An interdisciplinary group
conformed by laboratory professionals, the clinical laboratory’s clinical senior management, the systems engineer and technical support and quality control professional of the LIS provider were appointed, which is responsible for planning and implementing the autoveriication process. Each professional was assigned speciic responsibilities and competences to guarantee the results
and clinical decisions arising out of the process. The Figure 1
shows the different phases of the autoveriication implementation process.
The autoveriication was performed using the Process System Manager (PSM) middleware validation module (Roche Diagnostics). This module enables the parameterization of up to six different veriication ilters: quality control, instrument alarms, delta check, reference values, critical values, and clinical autoveriication algorithms.
Criteria and time span review
The development of an autoveriication algorithm seeks to transfer the structured and standardized validation trend of through of each test or group of tests to a series of decisions developed under Boolean logic, aiming at releasing laboratory results with no need for human intervention while maintaining good laboratory practices(1). Based on manual validation criteria, the variables that were subsequently taken into consideration for autoveriication ilters programming were reviewed.
Filter description and programming
The following veriication ilters were deined for each of the 32 parameters of the automated CBC: instrument alarms, delta check, critical values, and clinical autoveriication algorithms. The quality control ilter was not included in this process as it corresponds to a prerequisite to the samples processing, neither was the reference values ilter as it is already included in the instrument alarm ilter. The ilters used are described below:
Delta check values
Delta check is a quality assurance tool based on the differences of an analyte values in the current measurement with respect to a previous measurement or set of measurements. If a patient is
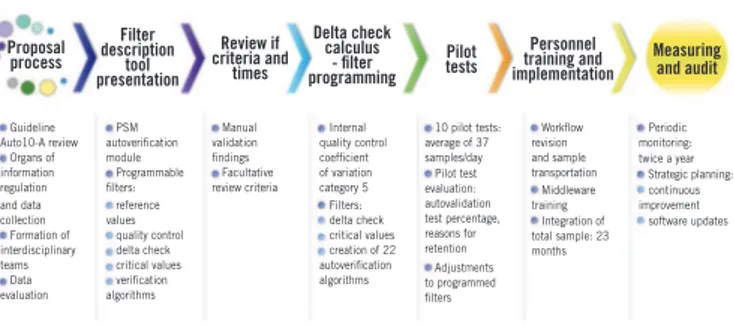
FIGURE 1 − Implementation of autoveriication process. Sequence diagram of automated CBC autoveriication process
This igure shows the different phases of autoveriication implementation process.
CBC: complete blood counter; PSM: Process System Manager.
Proposal process Guideline Auto10-A review Organs of information regulation and data collection Formation of interdisciplinary teams Data evaluation Filter description tool presentation PSM autoverification module Programmable filters: reference values quality control delta check critical values verification algorithms Review if criteria and times Manual validation findings Facultative review criteria Delta check calculus - filter programming Internal quality control coefficient of variation category 5 Filters: delta check critical values creation of 22 autoverification algorithms
Pilot tests
10 pilot tests: average of 37 samples/day Pilot test evaluation: autovalidation test percentage, reasons for retention Adjustments to programmed filters Personnel training and implementation Workflow revision and sample transportation Middleware training Integration of total sample: 23 months
Measuring and audit
stable, changes in the values (delta check) should be minor. If the delta check exceeds the deined limit, it may be due to signiicant changes in the analyte levels in the individual or problems in analytical technique. In order to ind signiicant change values in the results of a patient’s medical record with the current data, the delta check category 5 was adopted according to the references deined for calculating it. To apply this formula, the average variation coeficient (CV%) data cumulative for 6 months for regular internal quality control of the two Sysmex® XE2100
analyzers, from January to June 2010 were obtained.
Instrument alarms
This corresponds to interpretive messages of Sysmex®
XE2100 analyzers which are caused due to the possible presence of morphological cell alterations or deviations from parameters established as normal ranges in different age brackets, according to the international hematology consensus handbook (ISLH)(8, 9).
Critical values
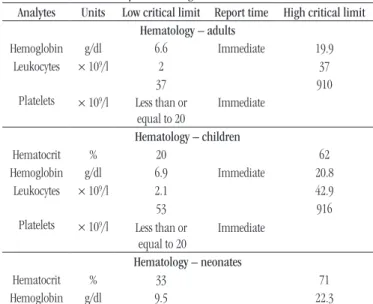
As part of the Patient Safety Program, a table has been deined for critical values for different analytes that are processed in each of the laboratory areas. The critical values for the hematology area were parameterized as an autoveriication ilter. See Table.
Clinical autoverification algorithms
For the release of results, 22 different algorithms were developed taking into account the validation criteria of expert
professionals from the hematology area of the laboratory. Moreover, the criteria set out in the Clinical and Laboratory Standards Institute (CLSI) and ISLH consensus autoverification guidelines were taken into account(1, 9). These algorithms were agreed upon and approved by the team responsible for the project. The algorithms created, correspond to each of the CBC parameters and were subsequently combined in order to retain or validate the full review according to the results.
Pilot tests and personnel training
To test the sensitivity and specificity of all filters, pilot tests, were conducted on six different days during the months of August and November 2009, and with an average of 37 automated CBC per day and a total of 266 samples. The percentage of retained and autoverified results was determined by reviewing each of the CBC parameters. Moreover, adjustments were made to each filter taking into account retention and false positives release. After the process approval, the volume of CBC’s subject to automatic and manual verification was gradually increased. After 23 months into the process, all professional received training and the system for the whole daily operation of the hematology area of the laboratory was implemented. As part of the autoverification process, the appointed personnel were trained in detecting errors in the system, so that in the event of any failure, they were able to interrupt the analytical phase.
Autoverification process monitoring and audit
Given the importance of monitoring the process and according to the activities schedule set out, an audit took place during the 18 months of the implementation focusing on the percentage of retained and autoverified results. For the former, the main causes were outlined and corrective actions were taken.
RESULTS
Pilot tests
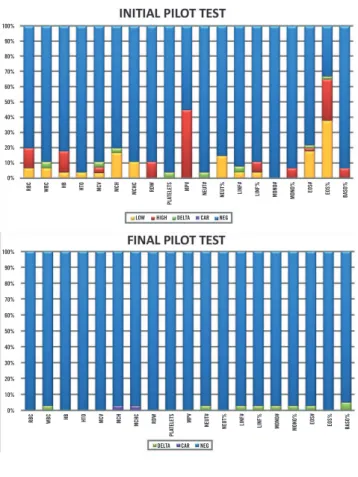
The gradual implementation of the process allowed going from 6.89% of autoverified results in the first pilot test to 62.79% in the last test. The improvement was based on the programmed filter settings between each pilot test, focusing primarily on the parameterization of the reference and delta
check values in PSM. Figure 2 shows the comparison between
the first and last test.
TABLE − Critical laboratory values configured in PSM as an autoverification filter
Analytes Units Low critical limit Report time High critical limit Hematology – adults
Hemoglobin g/dl 6.6 Immediate 19.9
Leukocytes × 109/l 2 37
Platelets × 109/l
37 910
Less than or
equal to 20
Immediate
Hematology – children
Hematocrit % 20 62
Hemoglobin g/dl 6.9 Immediate 20.8
Leukocytes × 109/l 2.1 42.9
Platelets × 109/l
53 916
Less than or
equal to 20
Immediate
Hematology – neonates
Hematocrit % 33 71
Hemoglobin g/dl 9.5 22.3
Autoverification process performance
Once the automated CBC autoveriication process in the reference laboratory was approved and full implemented, 534 CBC out of a total of 1,000 samples processed in a day, corresponding to 53.4% were autoveriied. A percentage of 40.7% of non-autoveriied CBC was pathological and detected by deined autoveriication algorithms. The remaining 5.9% was retained by delta check ilter. When reviewing each CBC, it was observed that the reason for retention was not clinically relevant and it was decided, therefore, to re-evaluate the criteria for inclusion in the group of autoveriied results. See Figure 3.
Reduction of non-conforming products (NCP)
Focusing on Patient Safety, the clinical laboratory follows on those events considered as adverse. For the Hematology area, they correspond to results that are released with data outside the patient medical records. Before starting the autoveriication process of 16,884 automated CBC per month, the NCP percentage was almost 0.065%, and manual typing of the differential leukocyte count considered the main reason for errors. After implementing the autoveriication process and with the inclusion of the hematological counter as a PSM tool, a signiicant decrease was observed in the incidence of NCP in the area. By 2012, the NCP percentage decreased to 0.0036% out of 20,311 automated CBC in a month.
Workflow optimization
Before implementing autoveriication process, the distribution of the worklow in the Hematology area of the laboratory was divided into three parts, each assigned to a professional: a) sample processing in Sysmex® XE2100 hematology analyzers;
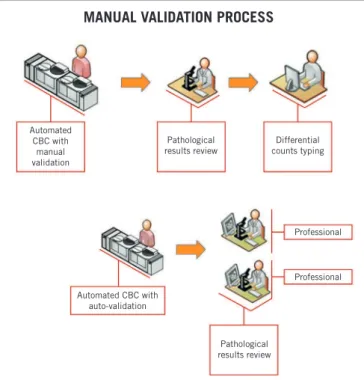
b) reading and review of slides corresponding to pathological cases; and c) typing morphological evidence found by the second professional and validation of non-pathological CBC. Incorporating the auto-testing system enabled to optimize continuity of the tasks assigned to a certain professional by real-time review of slides and results validation, allocating more real-time to the analysis of pathological results. See Figure 4.
FIGURE 3 − Autoveriication rate in a normal day at the reference laboratory
More than 50% of the automated CBC processed in a day was autoveriied.
LIS: laboratory information system; CBC: complete blood counter. Autoverified results
53.4%
Real-time results
Autoverification in a normal day
Retained non-pathological results 5.9% (re-evaluation
criteria, post-audit)
Retained pathological results 40.7%
Peripheral blood smear review
Release to the LIS full CBC Manual validation
FIGURE 2 − Pilot tests. Comparing graphs between initial and inal pilot tests
Please note the increase in autoveriied results (NEG) when inishing pilot tests.
RBC: red blood cells; WBC: white blood cells; HB: hemoglobin; HTO: hematocrit; MCV: mean corpuscular volume; MCH: mean corpuscular hemoglobin; MCHC: mean corpuscular hemoglobin concentration; RDW: red cell distribution width; MPV: mean platelet volume; NEUT#: absolute neutrophils count; NEUT%: percentage of neutrophils; LINF#: absolute lymphocytes count; LINF%: percentage of lymphocytes; MONO#: absolute monocytes count; MONO%: percentage of monocytes; EOS#: absolute eosinophils count; EOS%: percentage of eosinophils; BASO%: percentage of basophils; LOW: low result; DELTA: difference between results; CAR: articulated set of rules; NEG: negative; HIGH: high result.
100%
90%
80%
70%
60%
50%
40%
30%
20%
10%
0%
100%
90%
80%
70%
60%
50%
40%
30%
20%
10%
0%
RBC
RBC
WBC
WBC
HB
HB
HTO
HTO
MCV
MCV
MCH
MCH
LOW
DELTA CAR NEG HIGH DELTA CAR NEG
MCHC
MCHC
RDW
RDW
NEUT#
NEUT#
NEUT%
NEUT%
LINF#
LINF#
LINF%
LINF%
MONO#
MONO#
MONO%
MONO%
EOS#
EOS#
EOS%
EOS%
BASO%
BASO%
MPV
MPV
PLA
TELETS
PLA
DISCUSSION
Both systematization and automation are essential tools for clinical laboratories that deal with high volumes of samples. LIS comprises of modules for a safe and standardized management of patients’ information and test results. Among the computer tools we currently have, we would like to highlight the autoveriication module, which enables to automatically validate a set of results based on compliance with previously established criteria. In the routine work of clinical laboratories in Colombia, the veriication of a result has largely depended on the mental algorithms of laboratory professionals. The purpose of this step in processing a test is to ind any potential errors in any of the previous stages before delivering the result. The information from the pre-analytical, analytical, and post-analytical phases is integrated and used within this process. Autoveriication can be supplemented to include other variables, such as test gathering, requests for repetitions, relex tests, addition of interpretative comments, among others(1, 10). The main objective of this study was, in general, to evaluate the implementation of the automated CBC autoveriication process and its impact on patient safety. For this purpose, the behavior of NCP mostly attributable to
minor errors in manual veriication of results was analyzed. NCP signiicant decrease was observed, going from 0.065% to 0.0036% as from the beginning of the implementation to its end. These data are similar to those described by Torke et al. in their experience with autoveriication in the Laboratory of the Cook County Hospital (Chicago), where a decrease in the validation errors from 0.06% to 0.009% was reported(10). The impact of this decrease is because the autoveriication process always uses the same criteria, takes into account all the parameterized information available, and is not subject to the various distractions that can negatively impact on the attention of a human. The variability that is dependent on the observer is, therefore, removed as well as the risk of making mistakes due to fatigue from routine and repetitive processes. This becomes a powerful tool towards patient safety. Moreover, the process further brought other beneits to the clinical laboratory such as worklow optimization, focusing on the analysis of actual pathological results by specialized staff from the hematology area. The real-time validation of results was also achieved by improving timeliness of response, since the reports are readily available for delivery in hard or electronic copy (via e-mail or on website). In addition, new knowledge was transferred by the professionals involved in the design and implementation of the autoveriication process, leading to the documentation of the pilot tests, the Technical Instructions for the implementation of autoveriication processes and periodic internal audits as inal products, as well as the algorithms established for each CBC autoveriication parameter and consolidated process documentation. In reviewing the international literature, we ind only a few publications on autoveriication processes – speciically in the hematology area. There are, however, some articles that emphasize that this performance depends on the type of population of each laboratory. In other words, the autoveriication performance for an emergency laboratory differs from the for an outpatient laboratory. According to Cava report(10), in outpatient laboratories (high percentage of results within the reference values), up to 70% of the results are autoveriied, while in centers of complex pathologies, the percentage may be only 10%. At the Raritan Bay Medical Center (New Jersey) it is shown that about 80% of the biochemical and coagulation tests are rapidly released with autoveriication. In the Laboratory of the Cook County Hospital (Chicago), Torke et al. reported automatic veriication of 73% for isolated analytical results, 62% for biochemical panels, and 43% for urinalysis. It was also reported an overall improvement in the response time of urgent requests of 19% and 22% in routine(10). Guidi et al. also show the beneits of autoveriication system (Validation Assisté e pour laboratoire [VALAB]) regarding error decrease, optimization of process low, and reduced response times(11). In conclusion, the autoveriication process can be used in the
FIGURE 4 − Change in the organization’s worklow
The improvement in the organization’s worklow allowed skipping the differential counts typing by an individual, thus resulting in more time allocated to the pathological results.
CBC: complete blood counter.
Automated CBC with
manual validation
MANUAL VALIDATION PROCESS
Automated CBC with auto-validation
Pathological results review
Pathological results review
Differential counts typing
RESUMO
Introdução: O laboratório clínico é parte do grupo de atores nos sistemas de saúde, que são cada vez mais pressionados por usuários e administradores para aumentar sua produtividade a im de responder de forma eiciente ao aumento do volume de pacientes, otimizando custos e tempo dos funcionários. Essa pressão forçou laboratórios para efetuar uma revisão completa de seus procedimentos,
bem como desenvolver instrumentos técnicos, logísticos e computacionais para permitir excelentes tempos de resposta. Objetivo:
Neste estudo, a implementação do processo automatizado de autoveriicação do hemograma e seu impacto sobre a segurança do
paciente são avaliados. Métodos: Regras de veriicação foram construídas no software de conectividade com base em critérios de
validação manual dos proissionais de laboratório, de acordo com as orientações do Clinical and Laboratory Standards Institute (CLSI) de Guideline Auto10-A e do International Consensus Group for Hematology Review (ISLH). A percentagem de autoensaio foi estabelecida e as de produtos não conformes (PNC), estimadas antes e depois do procedimento. Testes piloto foram realizados em
dias diferentes para ajustar o processo. Resultados: Cinquenta e três por cento da autoveriicação dos hemogramas automatizados
foram alcançados e, posteriormente, na auditoria dos 18 meses, foram obtidos 60% devido a ajustes na veriicação do iltro
delta programado. Os PNCs aumentaram de 0,065% a 0,0036% desde o início até ao inal do processo. Conclusão: O processo
do autoveriicação ajudou a reduzir a variabilidade associada à intervenção humana, portanto o proissional pode concentrar--se na análise de relatórios patológicos, reduzindo o risco de erros e dando maior importância para a segurança do paciente.
Unitermos: algoritmos; interfase; processamento automatizado de dados; contagem de células sanguíneas; segurança do paciente; testes laboratoriais.
REFERENCES
1. CLSI. Autoveriication of Clinical Laboratory Test Results; Approved Guideline. AUTO10 A. Wayne, PA: Clinical and Laboratory Standards Institute; 2006.
2. Kohn L, Corrigan J, Donaldson M. Error reporting systems. To err is human building a safer healt system [Internet]. Washington, DC: National Academy Press; 2000. Available at: http://www.nap.edu/ catalog79728.html.
3. Becich MJ, Gilbertson JR, Gupta D, Patel A, Grzybicki DM, Raab SS. Pathology and patient safety: the critical role of pathology informatics in error reduction and quality initiatives [Internet]. Clin Lab Med. 2004
Dec; 24(4): 913-43. Available at: http://www.sciencedirect.com/science/ article/pii/S0272271204000757.
4. Stankovic AK. The laboratory is a key partner in assuring patient safety. Clin Lab Med. 2004; 24(4): 1023-35.
5. De Smet D, Nanos N, Geert A, et al. Automated validation of clinical laboratory test results: do we get what we expect ? Clin Chem. 2009; 47(3): 379-80.
6. College of American Pathologists (CAP). Laboratory general checklist, 2007 [Internet]. Available at: http://www.cap.org/web/ home?_afrLoop=324768906377744#%40%3F_afrLoop%3D3247689 6377744%26_adf.ctrl-state%3Dl75o2k1l4_4.
7. Jones JB. A strategic informatics approach to autoveriication. Clin Lab Med. 2013; 33(1): 161-81.
clinical laboratory as a powerful tool for patient safety, as it reduces the possibility of human errors while improves response time and ensures that the specialized laboratory professional focuses their efforts on studying cases that, due to their complexity, require more attention. Moreover, the autoveriication process constitutes an eficient tool to increase the productivity for operating the laboratory. Currently, the autoveriication percentage has reached 60% of the automated CBC as a result of adjustments made in periodical audits. For the clinical laboratory, one of the most signiicant results of the autoveriication process is observed in the eficiency with which the hematology area is constantly improving its process. The aforementioned thanks the
MAILING ADDRESS
Oscar Martínez-Nieto
Rua Carrera 69 C, 99-45; Bogotá DC, Colombia; Postal code: 111121; Phone: +57 (1) 5895482; ext. 5718964; e-mail: [email protected].
8. Roche. Manual de Instrucciones SYSMEX XE-2100. Sysmex America Latina, editor. America; 2001.
9. Hematology International Society for Laboratory. International Consensus Group for Hematology Review: concensus rules. 2004. Available at: http://www.islh.org/2004/Committees/ConsensusGroup/ CGDeltaDeinitions.htm.
10. Cava Valenciano F. Autovaledación de resultados en el laboratorio clínico. Ed Cont Lab Clín. 2010; 13: 104-35.