ACPD
9, 16361–16379, 2009Characteristics and source apportionment of atmospheric aerosols
H. Xu et al.
Title Page
Abstract Introduction
Conclusions References
Tables Figures
◭ ◮
◭ ◮
Back Close
Full Screen / Esc
Printer-friendly Version
Interactive Discussion Atmos. Chem. Phys. Discuss., 9, 16361–16379, 2009
www.atmos-chem-phys-discuss.net/9/16361/2009/ © Author(s) 2009. This work is distributed under the Creative Commons Attribution 3.0 License.
Atmospheric Chemistry and Physics Discussions
This discussion paper is/has been under review for the journalAtmospheric Chemistry and Physics (ACP). Please refer to the corresponding final paper inACPif available.
Characteristics and source
apportionment of atmospheric aerosols at
the summit of Mount Tai during
summertime
H. Xu1,2, Y. Wang1, T. Wen1, Y. Yang1, and Y. Zhao1
1
LAPC, Institute of Atmospheric Physics, Chinese Academy of Sciences, 100029 Beijing, China
2
Zhejiang Institute of Meteorological Sciences, 310017 Hangzhou, China
Received: 30 June 2009 – Accepted: 24 July 2009 – Published: 31 July 2009
Correspondence to: Y. Wang ([email protected])
ACPD
9, 16361–16379, 2009Characteristics and source apportionment of atmospheric aerosols
H. Xu et al.
Title Page
Abstract Introduction
Conclusions References
Tables Figures
◭ ◮
◭ ◮
Back Close
Full Screen / Esc
Printer-friendly Version
Interactive Discussion
Abstract
To investigate the long-range transport of air pollutants in North China, aerosol samples were collected at the summit of Mount Tai (Shandong province) in June of 2006. Water-soluble ion and metal element concentrations were analyzed using ion chromatography (IC) and inductively coupled plasma-mass spectrometry (ICP-MS), respectively.
Re-5
sults showed three different size distributions for the ions and metal elements charac-terized, including masses in: (i) the accumulation mode, with a peak at 0.43 to 1.1µm
(SO2−
4 , NH
+
4, K+, Pb, Zn, Ti); (ii) the coarse particle mode, with a peak at 4.7 to 5.8µm
(Ca2+, Mg2+, Ca, Mg, Fe, Al, Ba, Mn); and (iii) a bimodal distribution, with peaks at 0.43 to 0.65µm and 4.7 to 5.8µm (NO−3, Na+, Cl−, Na, Co, Ni, Mo, Cu). When SO24− 10
was in high concentration, the mass median diameter was between 0.5µm and 0.8µm,
belonging to the “drop mode”. The concentrations of SO2−
4 , NO
−
3, NH
+
4, and K+ were
quite variable. Interestingly, SO2−
4 , NO
−
3, and NH
+
4 reached their highest concentrations
when the humid air mass was coming from the south. Furthermore, crustal element concentrations increased when the air mass came from the north and pollution element
15
concentrations were elevated when the air mass came from the south.
1 Introduction
Atmospheric aerosols consist of complex mixtures of elemental and organic carbon, ammonium, nitrates, sulphates, mineral dust, trace elements, and water. Investiga-tion of the chemical characteristics of these aerosols is important for elucidating
par-20
ticle toxicity and its potential role in climate change (Christoph et al., 2005). Atmo-spheric aerosol size distributions, along with their chemical compositions, sources, and sinks, are key elements in understanding and managing aerosol health effects (Englert, 2004), visibility, and the climate (Seinfeld and Pandis, 1998). Therefore, it is important to study the chemical characteristics and sources of atmospheric aerosols as well as
25
ACPD
9, 16361–16379, 2009Characteristics and source apportionment of atmospheric aerosols
H. Xu et al.
Title Page
Abstract Introduction
Conclusions References
Tables Figures
◭ ◮
◭ ◮
Back Close
Full Screen / Esc
Printer-friendly Version
Interactive Discussion Rapid urbanization and industrial development in China over the past two decades
likely led to significant increases in the emission of particles and their gaseous pre-cursors (Streets and Waldhoff, 2000). During June of 2006, we sampled aerosols for a period of one month at the summit of Mount Tai, the highest mountain in the North China Plains. This mountain-top location was selected for its high, location, which
5
enables the sampling of air masses that are more representative of regional character-istics, allows examination of transport paths from other regions in Asia, and it permits the study of exchanges between the planetary boundary layer (PBL) and the free tro-posphere (Gao et al., 2005). Due to the domination of Pacific high pressure during the summer season, this site also enabled the sampling of air down-wind from a city group
10
center in eastern China. A better understanding of the aerosol characteristics that in-fluence urban atmosphere was thus obtained. Size distributions of water-soluble ions and metal elements in aerosol were also determined in order to distinguish different aerosol sources.
2 Experiments and methodologies
15
2.1 Measurement site
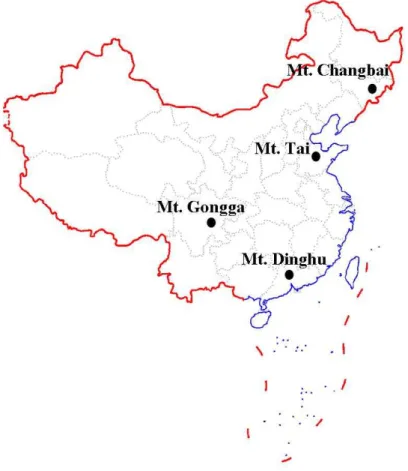
The measurement site (36◦16′N, 117◦06′E) was in a meteorological observation sta-tion located at the summit of Mount Tai (altitude=1534 m a.s.l.), as shown in Fig. 1. This summit overlooks the city of Tai’an, 15 km to the south, which has a population of approximately 500 000. The city of Ji’nan (Shandong province capital) is situated
20
60 km to the north and has a population of approximately 2.1 million. A few villages are also visible to the north. A famous tourist destination, Mount Tai has a large number of visitors during the summer months (June through September), and several small restaurants and temples are in the area, which also might produce local emissions. Our measurement site, however, was situated in the eastern part of the summit, which
25
ACPD
9, 16361–16379, 2009Characteristics and source apportionment of atmospheric aerosols
H. Xu et al.
Title Page
Abstract Introduction
Conclusions References
Tables Figures
◭ ◮
◭ ◮
Back Close
Full Screen / Esc
Printer-friendly Version
Interactive Discussion Aerosol samples were collected with an eight-stage low pressure impactor
(Ander-sen Series 20-800, USA) from 1 to 30 June, 2006. Mixed cellulose ester filter sub-strates (Thermo-Electron Corporation, USA) were employed in all stages, and a flow rate of 28.3 L min−1 was used. The 50% cut o
ff diameters (D50) were 9.0, 5.8, 4.7, 3.3, 2.1, 1.1, 0.65, and 0.43µm. During the day, aerosol samples collected from 5
08:00 a.m. to 06:00 p.m. were regarded as “daytime” aerosols, while those collected from 06:30 p.m. to 07:30 a.m. were regarded as “nighttime” aerosols. There was no sampling on the night on 13 June, 2006 and during the day of 27 June because of rainfall and instrument malfunction. A total of 288 aerosol samples were collected. The chemical composition of these samples was analyzed using IC and ICP-MS.
10
Aerosol samples were also collected at: (i) the subalpine field observation sta-tion of the Gongga alpine ecosystem observasta-tion and experiment stasta-tion (29◦35′N, 102◦00′E), (ii) the research station of Changbai Mountain Forest Ecology (42◦24′N, 128◦′E), and (iii) the Dinghushan Forest Ecosystem Research Station (23◦10′N, 112◦32′E), as shown in Fig. 1. Samples were gathered using the high volume sampler
15
(ASI/GMW HVPM10, Thermo-Electron corporation, USA) on 7, 14, 21, and 28 June 2006, respectively. Each collection period was 24 h long, and 12 PM10 samples were collected in total. IC analysis was performed on these samples.
2.2 Chemical analysis
2.2.1 Ion analysis
20
Half of each sample and a blank were ultrasonically extracted using 50 ml of water (deionized H2O; 18MΩcm−
1
resistivity). After passing each extracted sample through a microporous membrane (pore size=0.45µm; diameter=25 mm; Ampel Co.), three
anions (SO2−
4 , NO
−
3, Cl
−) and five cations (NH+
4, Ca
2+, Na+, Mg2+, K+) were analyzed
using ion chromatography (Dionex ICS-90). This system was outfitted with a
separa-25
ACPD
9, 16361–16379, 2009Characteristics and source apportionment of atmospheric aerosols
H. Xu et al.
Title Page
Abstract Introduction
Conclusions References
Tables Figures
◭ ◮
◭ ◮
Back Close
Full Screen / Esc
Printer-friendly Version
Interactive Discussion A gradient weak base eluent (3.5 mmol L−1Na
2CO3; 1 mmol L− 1
NaHCO3) was used
for anion detection, while a weak acid eluent (22 mmol L−1MSA) was used for cation detection. Ion recovery was in the range of 80 to 120%. The relative standard devia-tion (SD) of each ion was less than 3% for the reproducibility test. Limits of detecdevia-tion (S/N=3) were less than 0.03 mg L−1 for anions and 0.004 mg L−1 for cations. Quality
5
assurance was routinely carried out using standard reference materials (Merck Co.). Data from blank samples was subtracted from the corresponding sample data after analysis.
2.2.2 Element analysis
Half of each filter was treated with microwave digestion. Forty five minute extractions
10
were performed into a mixture of 3 ml AR grade hydrochloric acid (37%) and 8 ml AR grade nitric acid (68%). A Multiwave3000 microwave digestion machine was used with the following conditions: power=1400 W; maximum temperature=180◦; maximum pressure=22 atm.
Upon cooling, the solutions were diluted to 50 ml with deionized water (18 MΩcm−1
15
resistivity). Nineteen elements were characterized using an inductively coupled plasma mass spectrometer (ICP-MS, model, 7500a, Agilent Co., USA). Experimental condi-tions were: RF power=1350 W; carrier gas flow rate=1.12 L min−1; PeriPump
=0.1 rps; S/C temp=2◦; oxide: 156/140<0.45%; doubly charged: 70/140<1.01%. The concen-trations of trace metal elements, including Ca, Fe, Al, Mg, Ba, Sr, Zr, K, Pb, Zn, As, Sn,
20
ACPD
9, 16361–16379, 2009Characteristics and source apportionment of atmospheric aerosols
H. Xu et al.
Title Page
Abstract Introduction
Conclusions References
Tables Figures
◭ ◮
◭ ◮
Back Close
Full Screen / Esc
Printer-friendly Version
Interactive Discussion
3 Results and discussion
3.1 Concentration of water soluble ions and metal elements
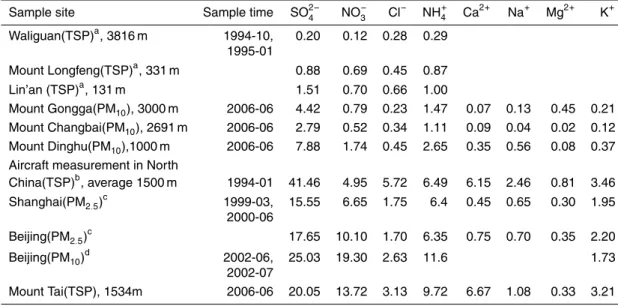
Water-soluble ion concentrations of TSP at the summit of Mount Tai are shown in Ta-ble 1, which also shows concentrations of PM10 and PM2.5 at Mount Gongga, Mount
Changbai, Mount Dinghu, Beijing, and Shanghai. Figure 2 indicates that water-soluble
5
ion concentrations, especially secondary ions such as SO2−
4 , NH
+
4, and NO
−
3, reside
mainly within PM10, and K+ concentrations reside mainly within PM2.5. Although parti-cle sizes from these different sites were not uniform, the water-soluble ion concentra-tions can still be compared, especially for secondary ions (i.e., SO2−
4 , NH
+
4, NO
−
3 and
K+. Water-soluble ion concentrations at the summit of Mount Tai were much higher
10
than those at the atmospheric background station. Secondary ion concentrations at the summit of Mount Tai were 9 to 109 times higher than those of Waliguan baseline station, Mount Longfeng, and Lin’an regional background stations, and they were 4 to 17 times higher than those of Mount Gonggai, Mount Changbai, and Mount Dinghu forest ecosystem station. In contrast, secondary ion concentrations at the summit of
15
Mount Tai were close to those in Beijing, Shanghai. Therefore, aerosol pollution at the summit of Mount Tai appears to be deeply affected by regional pollution in North China. It was found that the sulfate concentration of Mount Tai was 2.2 times lower than that obtained via aircraft measurement (January, 1994 North China). The emission of SO2,
which is a sulfate precursor, has not decreased from 1994 to 2006 (Streets et al., 2000).
20
Higher sulfate concentrations from aircraft measurements were mostly likely due to the sampling season, as the aircraft measurement was run in winter and this Mount Tai ex-periment was performed in summer. The large amount of coal combusted for heating during the North China winter emits SO2, which is mostly transformed into sulfate. A
relatively small amount of SO2, however, is emitted in summertime. The nitrate
con-25
ni-ACPD
9, 16361–16379, 2009Characteristics and source apportionment of atmospheric aerosols
H. Xu et al.
Title Page
Abstract Introduction
Conclusions References
Tables Figures
◭ ◮
◭ ◮
Back Close
Full Screen / Esc
Printer-friendly Version
Interactive Discussion trate, has increased in concentration every year (Andreas et al., 2005). Ammonium
and metal ion concentrations are close to those of aircraft measurements. Elevation of the Mount Tai sample site was close to the average height of aircraft measurements. Therefore, the results of this Mount Tai experiment can be used to deduce the regional characteristics of North China.
5
Concentrations of the crustal elements Na, Mg, Al, Ca, and Fe were 0.78 to 8.37µg m−3, or 96.2% of the total metallic element concentrations detected.
Con-centrations of the metallic elements Mn, Ni, Cu, Sb, Ba, Zn, and Pb were 0.02 to 0.17µg m−3. Concentrations of metal elements Co, Mo, and Ti were less than
0.01µg m−3. Results were compared with reported metallic element concentrations 10
in aerosols of Chinese cities (Gao et al., 1996; Wei et al., 2001; Yang et al., 2002). We found that Mount Tai crustal element concentrations were somewhat higher than those of cities. Mount Tai metal element concentrations (e.g., Zn and Pb), which are mostly from anthropogenic pollution sources, were much lower than those of cities. Elements such as Zn and Pb mainly result from direct emission from pollution sources; however,
15
water-soluble ions such as SO2−
4 , NO
−
3, and NH
+
4 are secondary pollutants, which come
from the chemical transformation of SO2, NOx, and NH3, respectively. This indicates that secondary pollutants are easier than primary pollutants to transport via aerosols in regional areas.
3.2 Size distribution of water-soluble ions and metal elements
20
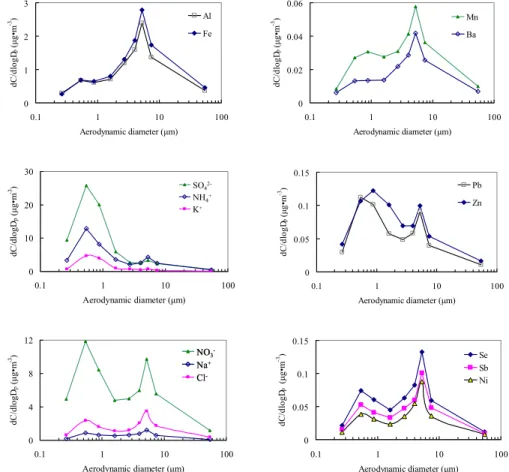
Typical size distributions obtained for trace metal elements and ions are illustrated in Fig. 2. Three size distributions were found for the water-soluble ions, including masses within: (1) the accumulation mode, with a peak at 0.43 to 0.65µm (SO24−, NH+4, and
K+), (2) coarse particles, with a peak at 4.7 to 5.8µm (Ca2+and Mg2+), (3) two modes,
with peaks at 0.43 to 0.65µm and 4.7 to 5.8µm (NO−3, Na+, and Cl−). Three size 25
ACPD
9, 16361–16379, 2009Characteristics and source apportionment of atmospheric aerosols
H. Xu et al.
Title Page
Abstract Introduction
Conclusions References
Tables Figures
◭ ◮
◭ ◮
Back Close
Full Screen / Esc
Printer-friendly Version
Interactive Discussion accumulation mode, with a peak at 0.43 to 1.1µm (Pb, Zn, and Ti), (3) two modes, with
peaks at 0.43 to 1.1µm and 4.7 to 5.8µm (Co, Ni, Mo, Na, and Cu).
SO2−
4 was found in the accumulation mode, with 87% of its mass present as fine
particles with aerodynamic diameters less than 2.1µm. During the observation period,
sulfate size distributions exhibited little variation, and the median aerodynamic
diam-5
eter (MMAD) remained within 0.2 to 0.8µm. Sulfate existed mainly in “accumulation
mode” and “droplet mode” states. The MMAD increased with increasing sulfate con-centration when it was less than 10µg m−3; however, when the sulfate concentration
was larger than 10µg m−3, the MMAD remained between 0.5 and 0.8µm, putting it in
the “droplet mode”. This indicated that the high sulfate concentration was due to
aque-10
ous phase reactions in fog and cloud droplets or to hygroscopic growth of aerosols from the smaller accumulation mode. The sulfate size distributions were close to those from summer and fall in Beijing (Yao et al., 2003; Hu et al., 2005; Xu et al., 2007), fur-ther indicating that aerosol pollution at the summit of Mount Tai is affected by regional pollution in North China.
15
Metallic elements, such as Mg, Al, Fe, Ca, Mn, and Ba, were found in the coarse mode, with more than 80% of their mass present as coarse particles with aerodynamic diameters greater than 2.1µm. Mg, Al, Fe, and Ca are typical crustal elements; thus,
these elements likely come from wind-blown soil. Metallic elements, such as Pb, Zn, and Ti, as well as the ions SO2−
4 , NH
+
4, and K
+, were found in the accumulation mode,
20
with more than 70% of their mass present as fine particles with aerodynamic diame-ters from 0.43µm to 2.1µm. Pb, Zn, and K+ are mainly a consequence of fossil fuel
(e.g., coal, oil, and biomass) combustion. SO2−
4 and NH
+
4 mainly result from the
pro-cess of SO2 and NH3 secondary particle formation. These elements and ions have
a small peak between 4.7 and 5.8µm. Thus, we conclude that the surface of coarse 25
particles have sorptive interactions with them. Metallic elements, such as Co, Ni, Mo, Na, and Cu, have a peak between 4.7 and 5.8µm, but they distribute evenly among
ACPD
9, 16361–16379, 2009Characteristics and source apportionment of atmospheric aerosols
H. Xu et al.
Title Page
Abstract Introduction
Conclusions References
Tables Figures
◭ ◮
◭ ◮
Back Close
Full Screen / Esc
Printer-friendly Version
Interactive Discussion emissions (e.g., wind-blown dust). NO−
3 and Cl
− have obvious peaks between 0.65
and 1.1µm as well as between 4.7 and 5.8µm. NO−3 mainly arises from secondary
particles formed by NOx. Nitrate is more easily dissolved in water than sulfate and is
thus more easily absorbed to the surface of coarse particles, resulting in the high peak from 4.7 to 5.8µm. Although Cl− is bimodal, it distributes evenly among all diame-5
ters. Cl− mainly comes from sea salt and is absorbed by particles of every diameter during long-distance movements and transformations, making the Cl− size distribution smoother.
3.3 Temporal variation
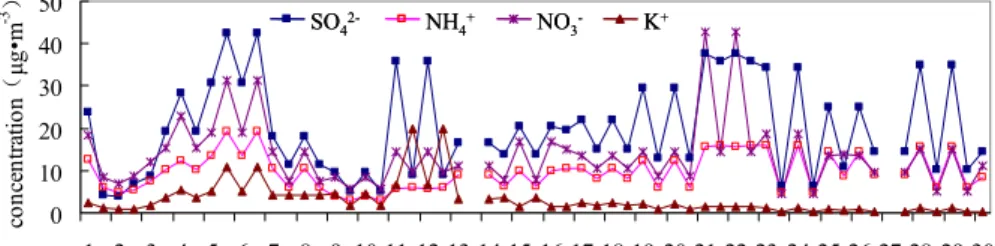
Secondary ions and K+ had large variations in concentration, while others had
rela-10
tively little variation, as shown in Fig. 3. At high concentrations of secondary ions and K+, differences between day and night were obvious. For example, sulfate concen-tration during the daytime was four times higher than at nighttime for 11 through 12 June. Average concentrations of all ions (excluding K+) in the day were higher than those at night. This was especially true for sulfate, which had daytime concentrations
15
41% higher than those at night. Observation conditions included average wind speeds of 5.4 m s−1 and 8.3 m s−1 for day and night, respectively. It is important to note that ion concentrations (e.g., sulfate) were likely low at night due to faster average wind speeds, which can more easily diffuse pollutants. Aerosols emitted by biomass com-bustion contain high concentrations of K+ (Song et al., 2002; Sun et al., 2004; Xu
20
et al., 2007). The K+ concentration at Mount Tai is affected by sources of biomass combustion nearby. Observed high concentrations of K+ at night were most likely due to the time of biomass combustion and transport in North China. For most metallic elements, the difference between measurements taking during the day and the night was also obvious, with higher average concentrations during the day. For example, Ni
25
ACPD
9, 16361–16379, 2009Characteristics and source apportionment of atmospheric aerosols
H. Xu et al.
Title Page
Abstract Introduction
Conclusions References
Tables Figures
◭ ◮
◭ ◮
Back Close
Full Screen / Esc
Printer-friendly Version
Interactive Discussion atmospheric boundary layer.
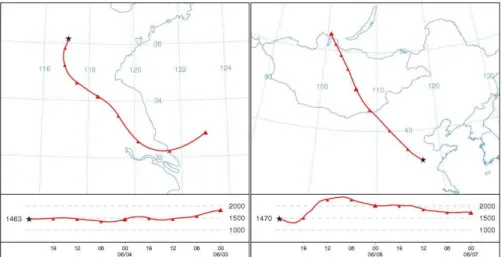
Air mass trajectories from 1 to 30 June were calculated to assess the importance of different source regions on aerosol composition at the sampling sites. The HYS-PLIT 4 model from the Air Resources Laboratory of NOAA (http://www.arl.noaa.gov/ ready/hysplit4.html) was used for this purpose. FNL meteorological data was used as
5
the input. On each sampling day, two 24 h back trajectories were computed at 00:00 and 12:00. Statistical analysis of these calculated trajectory directions indicated that there were mainly two sectors with different air compositions. These were: (1) the south sector of Mount Tai, including the south area of Shandong province, Jiangsu province, and Anhui province, which belong to the Changjiang delta; (2) the north
sec-10
tor of Mount Tai, including the north area of Shandong province, Hebei province, the Inner Mongolia autonomy region, Beijing, and Tianjin, which surround the Bohai. Two representative trajectories are shown in Fig. 4. As in Fig. 3, sulfate had the great-est variety, with its lowgreat-est concentration at 4.0µg m−3and its highest concentration at
42.3µg m−3. The sulfate concentration reached its highest value from 5 to 6, 11 to
15
12 June, 19 to 23 June, and 28 to 29 June. During these four time periods, the sam-pling sites were mainly influenced by air from the south sector. For example, it had an increasing amount of sulfate from 1 to 7 June and then a decreasing amount from 8 to 10 June, when the sulfate concentration dropped to 9.9µg m−3 from its highest
value (42.3µg m−3). The wind direction and humidity were completely different during 20
these two processes. The wind, with an average speed of 5.0 m s−1, was always from the south and had a relative humidity of 69% from 1 to 7 June. Wind with an aver-age speed of 7.3 m s−1was mainly from the north and had a relative humidity of 45% from 8 to 10 June. This indicates that air from the south carries a lot of sulfate and is wet, which enables formation of high sulfate concentrations within the “droplet mode”.
25
ACPD
9, 16361–16379, 2009Characteristics and source apportionment of atmospheric aerosols
H. Xu et al.
Title Page
Abstract Introduction
Conclusions References
Tables Figures
◭ ◮
◭ ◮
Back Close
Full Screen / Esc
Printer-friendly Version
Interactive Discussion to 6 June. Crustal elements, however, showed no obvious concentration increase
dur-ing the same time period. Air from the south comes mainly from heavy polluted areas (e.g., Changjiang delta), and the wind speed is low, making it difficult for pollution to diffuse. For example, the average wind speed was 2.6 m s−1on 5 June.
Sulfate concentration was low from 9 to 10 June, when the sampling sites were
5
mainly influenced by air from the north sector. This indicates that air from the north carries little sulfate. During this period, crustal elements (e.g., Mg and Al) reached their highest concentrations at 2.2µg m−3 and 5.1µg m−3, respectively. These values are 2.1 times higher than average. Metallic elements (e.g., Zn and Pb), however, exhibited no obvious concentration increase during the same period. This indicates that dry
10
air from the north can easily raise dust from soil, thus causing the crustal element concentrations to increase.
Nitrate and ammoniate exhibited the same variations as sulfate, suggesting that these three types of ions have similar sources. Variations in nitrate and ammoniate concentrations were smaller than those of sulfate. One possible cause of this is that
15
nitrate and ammoniate decompose more easily than sulfate, making it more difficult to reach high concentrations via accumulation. K+ had the same concentration variations as for secondary ions prior to 13 June; however, the K+ concentrations remained low and exhibited completely different variation characteristics after 13 June. A potential reason for this is that biomass combustion in North China occurs mainly during the first
20
half of June. High K+ concentrations from biomass combustion are influenced by me-teorological factors (e.g., wind direction and humidity), which is similar for secondary ions. K+ arising mainly from soil dust, however, had little variation after 13 June.
4 Summary and conclusions
Water-soluble ion concentrations in aerosols at the summit of Mount Tai were much
25
ACPD
9, 16361–16379, 2009Characteristics and source apportionment of atmospheric aerosols
H. Xu et al.
Title Page
Abstract Introduction
Conclusions References
Tables Figures
◭ ◮
◭ ◮
Back Close
Full Screen / Esc
Printer-friendly Version
Interactive Discussion Tai also exhibited regional pollution characteristics, offering data for research into the
transport of pollution between eastern China and the Pacific. The secondary ions SO2−
4 , NH
+
4, NO−3, and K
+ mainly resided within fine particles.
Secondary ions mainly come from long-term transport processes, while K+ arises mainly from biomass combustion in North China. Elements including Ca (including
5
Ca2+), Mg (including Mg2+), Al, Fe, Mn, and Ba mainly resided within coarse particles, which come from soil dust. Elements including Zn and Pb mainly resided within fine particles, which come from industry emissions.
High sulfate concentrations were present mainly in “droplet mode” states. These can be attributed to aqueous phase reactions in fog and cloud droplets or to the hygroscopic
10
growth of aerosols from the smaller accumulation mode.
Secondary ion and K+ concentrations exhibited large variation. Wind direction and humidity were key factors in this variation, along with the sources and sinks that influ-ence variation. Dry air from the north led to an increase in crustal element (e.g., Mg and Al) concentrations, while air from the south led to an increase in pollution element (e.g.,
15
Zn and Pb) concentrations. This demonstrates the regional pollution characteristics of North China.
Acknowledgements. This work was supported by the National Natural Science Foundation of
China under Grant No. 40525016; National Basic Research Program of China (973) under Grant No. 2007CB407303 and 2006CB403701; Hi-tech Research and Development Rrogram 20
of China(863) under Grant No. 2006AA06A301. Thanks are given to Professor Wang Zifa and Professor Hajime Akimoto for their organization of the observation project, and to the Mount Tai meteorological observation station.
References
Andreas, R., John, P. B., Hendrik, N., Claire, G., and Ulrike, N.: Increase in tropospheric 25
nitrogen dioxide over China observed from space, Nature, 437, 129–132, 2005.
ACPD
9, 16361–16379, 2009Characteristics and source apportionment of atmospheric aerosols
H. Xu et al.
Title Page
Abstract Introduction
Conclusions References
Tables Figures
◭ ◮
◭ ◮
Back Close
Full Screen / Esc
Printer-friendly Version
Interactive Discussion
Englert, N.: Fine particles and human health- a review of epidemiological studies, Toxicol. Lett., 149, 235–242, 2004.
Gao, J., Wang, T., Ding, A. J., and Liu, C. B.: Observational study of ozone and carbon monox-ide at the summit of Mount Tai (1534 m a.s.l) in the central-eastern China, Atmos. Environ., 39, 4779–4791, 2005.
5
Gao, J. H., Wang, W., Du, J., Liu, H. J., Pang, Y. B., and Tang, D. G.: Preliminary study on the aerosol characteristics of Xiamen in spring, Research of Environmental Sciences, 9(5), 33–37, 1996 (in Chinese).
Hu, M., Zhao, Y. L., He, L. Y., Huang, X. F., Tang, X. Y., Yao, X. H., and Chen, Z. Q.: Mass size distribution of Beijing particulate matters and its inorganic water-soluble ions in winter and 10
summer, Environ. Sci., 26(4), 1–6, 2005 (in Chinese).
Seinfeld, J. H. and Pandis, S. N.: Atmospheric Chemistry and Physics-from air pollution to climate change, John Wiley & Sons, New York, 1998.
Streets, D. G. and Waldhoff, S. T.: Present and future emissions of air pollutants in China: SO2, NOxand CO, Atmos. Environ., 34, 363–374, 2000.
15
Sun, Y. L., Zhuang, G. S., Wang, Y., Han, L. H., Guo, J. H., Dan, M., Zhang, W. J., Wang, Z. F., and Hao, Z. P.: The air-borne particulate pollution in Beijing -concentration, composition, distribution and sources, Atmos. Environ., 38, 5991–6004, 2004.
Song, Y., Tang, X. Y., Fang, C., Zhang, Y. H., Hu, M., and Ceng, L. M.: Source apportionment on fine particles in Beijing, Environ. Sci., 23(6), 11–16, 2002 (in Chinese).
20
Wang, W., Tang, D. G., Liu, H. J., Wang. M. Y., and Du, J.: Aircraft measurement of atmospheric pollutants in winter in North China II: research on pollution properties of atmospheric aerosol, Research of Environmental Sciences, 13(1), 10–13, 2000 (in Chinese).
Wei, F. S., Teng, E. J., Wu, G. P., Hu. W., Wilson, W. E., Chapman, R. S., Pau, J. C., and Zhang, J.: Concentrations and elemental components of PM2.5, PM10in ambient air in four
25
large Chinese cities, Environment Monitoring in China, 17(7), 1–6, 2001 (in Chinese). Xu, H. H., Wang, Y. S., Wen, T. X., and He, X. X.: Size distributions and vertical distributions
of water soluble ions of atmospheric aerosol in Beijing, Environ. Sci., 28(1), 14–19, 2007 (in Chinese).
Yang, D. Z., Yu, X. L., Fang, X. M., Wu, F., and Li, X. S.: A study of aerosol at regional back-30
ground stations and baseline station, J. Appl. Meteorol., 7(4), 396–405, 1996 (in Chinese). Yang, D. Z., Yu, H. Q., Ding, G. A., Wang, S. F., and He, Z. S.: An analysis of aerosols
ACPD
9, 16361–16379, 2009Characteristics and source apportionment of atmospheric aerosols
H. Xu et al.
Title Page
Abstract Introduction
Conclusions References
Tables Figures
◭ ◮
◭ ◮
Back Close
Full Screen / Esc
Printer-friendly Version
Interactive Discussion
13(Suppl.), 113–126, 2002 (in Chinese).
Yao, X. H., Chan, C. K., Fang, M., Cadle, S., Chan, T., Mulawa, P., He, K. B., and Ye, B. M.: The water-soluble ionic composition of PM2.5in Shanghai and Beijing, China, Atmos. Environ., 36, 4223–4234, 2002.
Yao, X. H., Lau, A. P. S., Fang, M., Chan, C. K., and Hu, M.: Size distributions and formation of 5
ACPD
9, 16361–16379, 2009Characteristics and source apportionment of atmospheric aerosols
H. Xu et al.
Title Page
Abstract Introduction
Conclusions References
Tables Figures
◭ ◮
◭ ◮
Back Close
Full Screen / Esc
Printer-friendly Version
Interactive Discussion Table 1. Average water-soluble ion concentrations for atmospheric aerosols in different
loca-tions (µg m−3).
Sample site Sample time SO2−
4 NO
−
3 Cl
− NH+
4 Ca
2+ Na+ Mg2+ K+
Waliguan(TSP)a, 3816 m 1994-10, 0.20 0.12 0.28 0.29
1995-01
Mount Longfeng(TSP)a, 331 m 0.88 0.69 0.45 0.87
Lin’an (TSP)a, 131 m 1.51 0.70 0.66 1.00
Mount Gongga(PM10), 3000 m 2006-06 4.42 0.79 0.23 1.47 0.07 0.13 0.45 0.21
Mount Changbai(PM10), 2691 m 2006-06 2.79 0.52 0.34 1.11 0.09 0.04 0.02 0.12
Mount Dinghu(PM10),1000 m 2006-06 7.88 1.74 0.45 2.65 0.35 0.56 0.08 0.37
Aircraft measurement in North
China(TSP)b, average 1500 m 1994-01 41.46 4.95 5.72 6.49 6.15 2.46 0.81 3.46
Shanghai(PM2.5) c
1999-03, 15.55 6.65 1.75 6.4 0.45 0.65 0.30 1.95
2000-06
Beijing(PM2.5)c 17.65 10.10 1.70 6.35 0.75 0.70 0.35 2.20
Beijing(PM10)d 2002-06, 25.03 19.30 2.63 11.6 1.73
2002-07
Mount Tai(TSP), 1534m 2006-06 20.05 13.72 3.13 9.72 6.67 1.08 0.33 3.21
ACPD
9, 16361–16379, 2009Characteristics and source apportionment of atmospheric aerosols
H. Xu et al.
Title Page
Abstract Introduction
Conclusions References
Tables Figures
◭ ◮
◭ ◮
Back Close
Full Screen / Esc
Printer-friendly Version
Interactive Discussion Fig. 1.Location of the observation site, including Mt. Tai (36◦16′N, 117◦06′E, 1534 m a.s.l.), Mt.
Gongga (29◦35′N, 102◦00′E, 3000 m a.s.l.), Mt. Changbai (42◦24′N, 128◦28′E, 2691 m a.s.l.)
ACPD
9, 16361–16379, 2009Characteristics and source apportionment of atmospheric aerosols
H. Xu et al.
Title Page Abstract Introduction Conclusions References Tables Figures ◭ ◮ ◭ ◮ Back Close
Full Screen / Esc
Printer-friendly Version Interactive Discussion 0 1 2 3
0.1 1 10 100
Aerodynamic diameter (μm)
d C /d lo g Dp ( μ g• m -3) Al Fe 0 0.02 0.04 0.06
0.1 1 10 100
Aerodynamic diameter (μm)
d C /d lo g D p ( μ g• m
-3) Mn
Ba
0 10 20 30
0.1 1 10 100
Aerodynamic diameter (μm)
dC /dlogD p ( μ g•m -3) 0 0.05 0.1 0.15
0.1 1 10 100
Aerodynamic diameter (μm)
dC /dl ogD p ( μ g• m -3) Pb Zn SO4
2-NH4+
K+
SO4
2-NH4+
K+
0 4 8 12
0.1 1 10 100
Aerodynamic diameter (μm)
dC /dl ogD p ( μ g• m -3) 0 0.05 0.1 0.15
0.1 1 10 100
Aerodynamic diameter (μm)
dC /dl og D p ( μ g• m
-3) Se
Sb Ni NO3
-Na+ Cl -NO3 -Na+ Cl
ACPD
9, 16361–16379, 2009Characteristics and source apportionment of atmospheric aerosols
H. Xu et al.
Title Page
Abstract Introduction
Conclusions References
Tables Figures
◭ ◮
◭ ◮
Back Close
Full Screen / Esc
Printer-friendly Version
Interactive Discussion
0 10 20 30 40 50
1 2 3 4 5 6 7 8 9 10 11 12 13 14 15 16 17 18 19 20 21 22 23 24 25 26 27 28 29 30
date
co
n
ce
n
tr
atio
n
˄μ
g•
m
-3 ˅ SO42- NH
4+ NO3- K+
SO42- NH
4+ NO3- K+
ACPD
9, 16361–16379, 2009Characteristics and source apportionment of atmospheric aerosols
H. Xu et al.
Title Page
Abstract Introduction
Conclusions References
Tables Figures
◭ ◮
◭ ◮
Back Close
Full Screen / Esc
Printer-friendly Version
Interactive Discussion Fig. 4. Air mass arriving at Mount Tai at 00:00 on 5 June, 2006 as classified by backward