Reveals a Diverse Nitrogen Metabolism in
Methylocystis
sp. Strain SC2
Bomba Dam1,2.¤a
, Somasri Dam1,2.¤b
, Jochen Blom3, Werner Liesack1,2*
1Max Planck Institute for Terrestrial Microbiology, Marburg, Germany,2Center for Synthetic Microbiology (SYNMIKRO), Philipps-Universita¨t Marburg, Marburg, Germany,
3Center for Biotechnology (CeBiTec), Bielefeld University, Bielefeld, Germany
Abstract
Background:Methylocystissp. strain SC2 can adapt to a wide range of methane concentrations. This is due to the presence of two isozymes of particulate methane monooxygenase exhibiting different methane oxidation kinetics. To gain insight into the underlying genetic information, its genome was sequenced and found to comprise a 3.77 Mb chromosome and two large plasmids.
Principal Findings:We report important features of the strain SC2 genome. Its sequence is compared with those of seven other methanotroph genomes, comprising members of theAlphaproteobacteria,Gammaproteobacteria, and Verrucomicro-bia. While the pan-genome of all eight methanotroph genomes totals 19,358 CDS, only 154 CDS are shared. The number of core genes increased with phylogenetic relatedness: 328 CDS for proteobacterial methanotrophs and 1,853 CDS for the three alphaproteobacterialMethylocystaceaemembers,Methylocystissp. strain SC2 and strain Rockwell, andMethylosinus trichosporiumOB3b. The comparative study was coupled with physiological experiments to verify that strain SC2 has diverse nitrogen metabolism capabilities. In correspondence to a full complement of 34 genes involved in N2fixation, strain SC2 was found to grow with atmospheric N2 as the sole nitrogen source, preferably at low oxygen concentrations. Denitrification-mediated accumulation of 0.7 nmol30N
2/hr/mg dry weight of cells under anoxic conditions was detected by tracer analysis. N2production is related to the activities of plasmid-borne nitric oxide and nitrous oxide reductases.
Conclusions/Perspectives:Presence of a complete denitrification pathway in strain SC2, including the plasmid-encoded nosRZDFYXoperon, is unique among known methanotrophs. However, the exact ecophysiological role of this pathway still needs to be elucidated. Detoxification of toxic nitrogen compounds and energy conservation under oxygen-limiting conditions are among the possible roles. Relevant features that may stimulate further research are, for example, absence of CRISPR/Cas systems in strain SC2, high number of iron acquisition systems in strain OB3b, and large number of transposases in strain Rockwell.
Citation:Dam B, Dam S, Blom J, Liesack W (2013) Genome Analysis Coupled with Physiological Studies Reveals a Diverse Nitrogen Metabolism inMethylocystis sp. Strain SC2. PLoS ONE 8(10): e74767. doi:10.1371/journal.pone.0074767
Editor:Eshel Ben-Jacob, Tel Aviv University, Israel
ReceivedJanuary 31, 2013;AcceptedJuly 28, 2013;PublishedOctober 10, 2013
Copyright:ß2013 Dam et al. This is an open-access article distributed under the terms of the Creative Commons Attribution License, which permits unrestricted use, distribution, and reproduction in any medium, provided the original author and source are credited.
Funding:This work was funded by the LOEWE Research Center for Synthetic Microbiology (SYNMIKRO). BD is grateful to the Alexander von Humboldt Foundation for his fellowship. JB acknowledges funding by the German Federal Ministry of Education and Research (grants 0315599A & 0315599B ‘‘GenoMik-Transfer’’). The funders had no role in study design, data collection and analysis, decision to publish, or preparation of the manuscript.
Competing Interests:The authors have declared that no competing interests exist.
* E-mail: [email protected]
.These authors contributed equally to this work.
¤a Current address: Visva-Bharati, Santiniketan, West-Bengal, India.
¤b Current address: Vidyasagar University, West Midnapur, West-Bengal, India.
Introduction
In the global methane cycle, aerobic methanotrophic bacteria are the only biological sink for the greenhouse gas methane. They belong to the Proteobacteria [1] and Verrucomicrobia [2]. The proteobacterial methanotrophs belong to the Alphaproteobacteria and Gammaproteobacteria. Among them, the alphaproteobacterial members of the genusMethylocystishave repeatedly been found to be associated with a wide variety of environments. They have been detected by both cultivation and cultivation-independent molec-ular techniques in rice paddies [3,4], different upland and hydromorphic soils [5,6,7], landfills [8,9], peatlands [10,11,12],
respect to its ability to utilize different nitrogen sources [16,17]. Our model organism,Methylocystissp. strain SC2, contains a novel high-affinity particulate methane monooxygenase (pMMO2), in addition to the conventional pMMO1 [18,19]. The different methane oxidation kinetics of pMMO1 and pMMO2 allow strain SC2 to adapt to a wide range of methane concentrations and thus to changes in its environment [19]. To understand the total genetic potential of this organism, its genome was sequenced [20].
Another major factor determining methanotrophic activity is the source and availability of nitrogen. Diversity of nitrogen metabolism operating in methanotrophs is well known. N2fixation
is a well-studied feature among methanotrophs. It has been reported for proteobacterial methanotrophs [21,22,23] and the distantly related verrucomicrobial member ‘Methylacidiphilum fumariolicum’ SolV [24]. Denitrification is the sequential reduction of nitrate and nitrite to the gaseous compounds nitric oxide (NO), nitrous oxide (N2O), and finally N2. This process is catalyzed by
nitrate, nitrite, nitric oxide, and nitrous oxide reductase, respec-tively [25]. Incomplete denitrification can lead to the emission of N2O, a potent greenhouse gas that contributes to global warming
and ozone depletion [26]. Proteobacterial methanotrophs are known to release N2O [27,28,29,30,31,32].Methylococcus capsulatus
Bath and Methylosinus trichosporium OB3b have the ability to produce N2O from the oxidation of hydroxylamine [33,34].
Understanding the release and fate of N2O is of particular
importance for the global nitrogen cycle [35]. Thus, in addition to their methane-oxidizing capabilities, knowledge of their nitrogen metabolism is essential for understanding the ecophysiology of methanotrophic bacteria. Based on a genome-inferred inventory, several key enzymes involved in nitrification and denitrification were suggested to be present in methanotrophs [36]. It was proposed that the oxidation of NH3to nitrite (nitrification) and the
production of N-oxides (denitrification) may be interrelated [27,37,38]. However, the ability to convert N2O to N2has not
yet been reported for any of the known methanotrophs.
With the advent of next-generation sequencing technologies, the number of sequenced methanotroph genomes has increased considerably. At present, twelve methanotroph genomes are available in public databases and more are being sequenced. The available sequences include those of the alphaproteobacterial methanotrophs Methylosinus trichosporium OB3b [39], Methylocystis parvusOBBP [40],Methylocystissp. strain Rockwell [41], Methylo-cystis sp. strain SC2 [20], and the facultative Methylocella silvestris BL2 [42]; and the gammaproteobacterial methanotrophs Methy-lococcus capsulatus Bath [43], Methylomicrobium album BG8 [44], Methylomicrobium alcaliphilum20Z [45],Methylomonas methanicaMC09 [46], and the psychrotolerantMethylobacter tundripaludumSV96 [47]. In addition, the genome sequences of the acidophilic Verrucomicro-bia members Methylacidiphilum infernorum V4 [48] and ‘Ma. fumariolicum’ SolV [49] are available. However, there is no report of any comparative analysis among the methanotroph genomes.
Here, we provide a detailed description of important features of the genome sequence of strain SC2 identified by comparative analysis with the methanotroph genomes available in public databases. In particular, we systematically compared the genome sequence of strain SC2 with those of two other Methylocystaceae members, Methylocystis sp. strain Rockwell and Ms. trichosporium OB3b. Special emphasis was given to genes involved in nitrogen metabolism. Their diverse functional nature in strain SC2 prompted us to perform physiological experiments, in order to verify that this strain is able to fix atmospheric N2, produce N2O
and eventually reduce it to N2by denitrification.
Results and Discussion
Genomic analysis ofMethylocystissp. strain SC2
(a) General features of strain SC2 genome. The genome of strain SC2 totals 4,146,594 bp and consists of three replicons: a circular chromosome of 3,773,444 bp (Figure 1) and two plasmids of 229,614 (pBSC2-1) and 143,536 bp (pBSC2-2), with an average GC content of 63, 61 and 60%, respectively [20,50].
The organization of a genome changes through gene rear-rangements. The frequency with which rearrangements occur depends on the activity of mobile and repeated elements such as insertion sequences, transposons, prophage sequences, and plas-mids [51]. In strain SC2, we manually identified two putative genomic islands, possibly acquired by transduction. These are defined by a 17-kb region (BN69_1471 to BN69_1495) and a 63-kb region (BN69_1579 to BN69_1669). In both genomic islands, CDS with significant BLAST matches encode phage-related proteins including components of phage head protein, tail protein, integrase, recombinase, and lysozyme. However, most of the genomic island CDS had no significant match in the database. When the chromosome of strain SC2 was scanned for prophage sequences using the widely used software Prophinder [52], no such sequences were detected. This might be due to the fact that the identified islands have lost some phage-related features (like the terminal repeats). The large phage-related island also contains a hicABtoxin-antitoxin system (BN69_1608, BN69_1609), which is highly prone to frequent gene rearrangement within a genome and horizontal gene transfer among bacterial and archaeal species [53]. Additional toxin-antitoxin systems encoded on the chromo-some include twomazEFsystems (BN69_0515, BN69_0516; and BN69_2525, BN69_2526) and oneyoeB–yefMsystem (BN69_3397, BN69_3398). ArelBEtoxin-antitoxin system was identified in the plasmid pBSC2-1 [50]. All toxin-antitoxin systems encode toxins that target diverse cellular functions like DNA replication, mRNA stability, protein synthesis, cell wall biosynthesis, and ATP synthesis [54]. The toxins (RelE, MazF, and YoeB) predicted to be produced in strain SC2 function as site-specific endoribonu-cleases that cleave mRNA at specific sites and thereby hamper mRNA stability [55,56,57,58]. The HicA toxin, encoded by the hicABsystem, was proposed to function via RNA cleavage [53]. In normally growing cells, these toxins are coexpressed and neutralized by their cognate antitoxins produced from the second gene of the operon [54]. Presence of multiple toxin-antitoxin systems in the chromosome of strain SC2 might help this bacterium to cope with stress or to undergo programmed cell death under stressed conditions [59,60].
To identifyClusteredRegularlyInterspacedShortPalindromic Repeats (CRISPRs), the web-based tool ‘‘CRISPRFinder’’ was used [61]. CRISPRs are widespread in prokaryotes. A survey identified them in 83% of 150 archaeal genomes and 46% of 2,356 bacterial genomes analyzed (http://crispr.u-psud.fr/crispr) [62]. CRISPR arrays are composed of highly conserved tandem repeat sequences, varying in size from 23 to 47 base pairs. These repeats are separated by unique ‘spacer’ sequences of similar length, which in most cases have been identified to be of viral origin. CRISPRs are flanked on one side by an AT-rich sequence called the ‘leader’ [62]. CRISPR loci, together with their CRISPR-associated (cas) genes, have recently been shown to constitute a defense system that, in bacteria, restricts propagation of intruding viruses and plasmids. CRISPR systems presumably function as transcriptional regulators or RNA-interference-based immune systems [63,64,65]. We could not detect any CRISPR-like sequence in the genome of strain SC2. When a similar search was made with the available genome sequences of methanotrophs, CRISPRs ranging from 2 to
Genome Analysis ofMethylocystissp. Strain SC2
6 per genome were identified by ‘‘CRISPRFinder’’ in all of them, except for the genome ofMce. silvestrisBL2 (Table 1). Likewise,cas genes were not found in the genomes of strains SC2 and BL2 but were present in all other methanotroph genomes having CRISPR loci (Table 1). The absence of CRISPRs andcasgenes might help strain SC2 to maintain and stabilize its two plasmids, as has also been reported for several strains of multidrug-resistant enterococci [66]. Similar to the situation withMethylocystissp. strains SC2 and Rockwell, CRISPRs are absent or present among strains of the same species in lactic acid bacteria [67].
(b) CDS involved in replication, transcription, and translation. The analysis of GC skewing (Figure 1) did not reveal a clear inversion pattern in the chromosome. Therefore, it was not possible to determine the origin of replication (oriC) by this
approach. However, we could identify the putative oriC region using the Ori-Finder program [68], with parameters adjusted to specific DNA boxes ofE. coliand one unmatched site permitted. This tool makes predictions based on the following features: (i) compositional strand asymmetry (estimated using the Z-curve program), (ii) distribution of DnaA boxes (either of theEscherichia colitype or species-specific), (iii) location of indicator genes (such as dnaA,hemE,gidA,dnaN,hemB,maf,repC, etc.), and (iv) phylogenetic relationships [68,69]. The putative oriC was identified within a 1063-bp region (2,008,193 bp to 2,009,255 bp). Its GC content is 53%, which is 10% lower than the GC content of the chromosome as a whole (Figure 2). ThreednaAbox motifs could be identified within this region using theE. coli-specificdnaAbox sequence as the reference. Two palindromic repeats were also identified in this Figure 1. Genome plot of strain SC2.The circles represent from outside to inside: circle 1, DNA base position (bp); circle 2, protein-coding regions transcribed on the plus strand (clockwise); circle 3, protein-coding regions transcribed on the minus strand (anticlockwise); circle 4, tRNA genes; circle 5, rRNA genes; circle 6, G+C content plotted using a 10-kb window (sea green and magenta indicate values greater than and less than the average G+C content, respectively); circle 7, GC skew ([G+C]/[G2C]) plotted using a 10-kb window (blue indicates values above average and red indicates values below average). The genome plot was generated using DNAPlotter version 1.4 from Artemis 12.0, Sanger Institute.
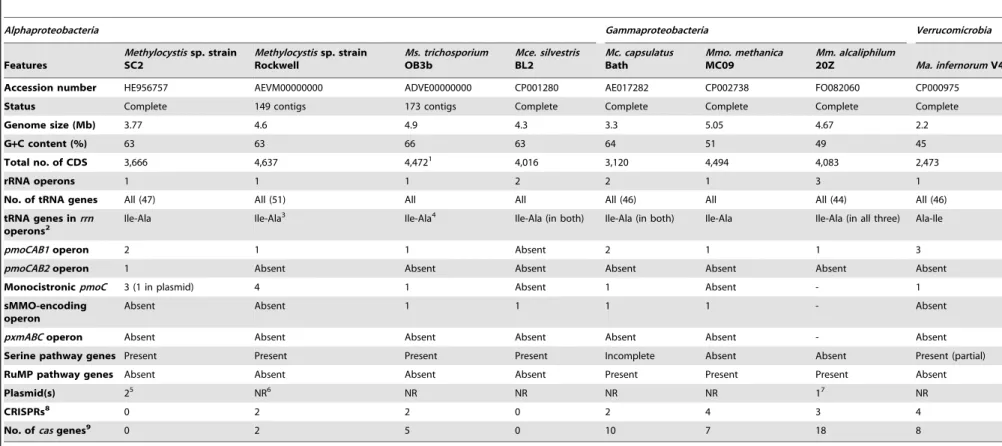
Table 1.General features identified in the genomes of the compared methanotrophs.
Alphaproteobacteria Gammaproteobacteria Verrucomicrobia
Features
Methylocystissp. strain SC2
Methylocystissp. strain Rockwell
Ms. trichosporium
OB3b
Mce. silvestris
BL2
Mc. capsulatus
Bath
Mmo. methanica
MC09
Mm. alcaliphilum
20Z Ma. infernorumV4
Accession number HE956757 AEVM00000000 ADVE00000000 CP001280 AE017282 CP002738 FO082060 CP000975
Status Complete 149 contigs 173 contigs Complete Complete Complete Complete Complete
Genome size (Mb) 3.77 4.6 4.9 4.3 3.3 5.05 4.67 2.2
G+C content (%) 63 63 66 63 64 51 49 45
Total no. of CDS 3,666 4,637 4,4721 4,016 3,120 4,494 4,083 2,473
rRNA operons 1 1 1 2 2 1 3 1
No. of tRNA genes All (47) All (51) All All All (46) All All (44) All (46)
tRNA genes inrrn
operons2
Ile-Ala Ile-Ala3 Ile-Ala4 Ile-Ala (in both) Ile-Ala (in both) Ile-Ala Ile-Ala (in all three) Ala-Ile
pmoCAB1operon 2 1 1 Absent 2 1 1 3
pmoCAB2operon 1 Absent Absent Absent Absent Absent Absent Absent
MonocistronicpmoC 3 (1 in plasmid) 4 1 Absent 1 Absent - 1
sMMO-encoding operon
Absent Absent 1 1 1 1 - Absent
pxmABCoperon Absent Absent Absent Absent Absent Absent - Absent
Serine pathway genes Present Present Present Present Incomplete Absent Absent Present (partial)
RuMP pathway genes Absent Absent Absent Absent Present Present Present Absent
Plasmid(s) 25 NR6 NR NR NR NR 17 NR
CRISPRs8 0 2 2 0 2 4 3 4
No. ofcasgenes9 0 2 5 0 10 7 18 8
1The number of CDS predicted in the genome announcement is 4,503, while the submitted sequence actually contains 4,472 CDS.
2tRNA genes were identified in 16S-23S spacer region of the rRNA operons.
3rRNA operon present in contig 219 (AEVM01000005). 4rRNA operon present in contig 00159 (NZ_ADVE01000118).
5Size of plasmids: pBSC2-1 (FO000001), 223 kb; and pBSC2-2 (FO000002), 143 kb.
6NR – not reported.
7Size of plasmid: MEALZ_p (FO082061), 128 kb.
8Abbreviation:ClusteredRegularlyInterspacedShortPalindromicRepeats; identified using the online tool ‘‘CRISPR finder’’.
9CRISPR-associated (cas) genes were predicted using the RAST server.
doi:10.1371/journal.pone.0074767.t001
Genome
Analysis
of
Methyloc
ystis
sp.
Strain
SC2
PLOS
ONE
|
www.ploson
e.org
4
October
2013
|
Volume
8
|
Issue
10
|
region (Figure 2A). The predictedoriCis not located in the vicinity of any of the three DnaA-encoding CDS (BN69_0001, BN69_3094, BN69_3291). The Ori-Finder program does not considerdifsites while makingoriCpredictions [68,69]. However, we could detect a dif site (276,895 bp to 276,922 bp) located almost halfway of the predictedoriC(Figure 2D). Thedifsite has been shown to be associated with the termination region of bacterial chromosomes [70] and acts as the recognition site for the XerCD proteins [71]. These are involved in postreplication recombination events. CDS encoding XerCD proteins (BN69_2958 and BN69_2761, respectively) were identified in the chromosome. The sum of these findings provides evidence for the correct prediction oforiC. Nevertheless, experimental valida-tion is needed to unambiguously locateoriC.
Twenty-four CDS encode proteins whose products are involved in transcription. Among these are the following: Two transcrip-tional elongation factors (GreA [BN69_0089] and GreB [BN69_2117]), three transcriptional antitermination factors (NusA [BN69_2506], NusB [BN69_0468], and NusG [BN69_1633]), and one transcriptional termination factor rho (BN69_2165). CDS encoding a, b, b9 and v subunits (BN69_1255, BN69_2895, BN69_2894, and BN69_1074, respectively) of bacterial DNA-directed RNA polymerase were also detected. Nine CDS are devoted to the synthesis and maintenance of the RNA polymerase sigma factor.
Several components of the translation system were identified, including a single copy of the 16S-23S-5S ribosomal RNA operon. The 16S and 23S rRNA genes are interspersed by two transfer RNA (tRNA) genes for isoleucine and alanine. This arrangement is commonly found in proteobacterial rRNA operons [72,73] and more frequently among members of theAlphaproteobacteria[72]. A similar organization of tRNA genes within the rRNA operon was observed in all the methanotroph genomes examined, except for theVerrucomicrobiamember where the arrangement is in the reverse order, Ala-Ile (Table 1). The full complement of 54 ribosomal proteins required for ribosome biosynthesis was identified in the chromosome. This includes 21 and 33 CDS, respectively, encoding components of the small and large ribosomal subunits. In total, 47 tRNA genes covering 20 amino acids were identified. No tRNA for the translation of the amino acid selenocysteine (tRNA-Sec) was found, corroborating that the number of bacteria with tRNA-Sec is much less than previously expected [74]. Other important CDS of the translation system include aminoacyl-tRNA synthetases, responsible for precise attachment of all 20 amino acids to their cognate transfer RNAs. Three bacterial initiation factors (IF-1 [BN69_0875], IF-2 [BN69_2508], and IF-3 [BN69_0601]) and three peptide release factors (RF-1 [BN69_0797], RF-2 [BN69_2418], and RF-3 [BN69_0479]) were identified. The latter are responsible for the recognition of the stop codons UAA, UAG, and UGA to terminate translation.
(c) CDS involved in methanotrophic mode of life. The chromosome of strain SC2 contains all the genes required for a methanotrophic lifestyle, including two copies of the conventional pmoCAB1operon and a single copy of the novelpmoCAB2operon (Table S1). In addition, three monocistronic pmoCparalogs were identified, with one present on plasmid pBSC2-2 [50]. As expected for an alphaproteobacterial methanotroph, we could identify the genes involved in the serine pathway of formaldehyde assimilation, but not those involved in the RuMP pathway.
The monocistronic pmoC1Gs (BN69_0852) is identical to the
homolog present in thepmoCAB1operons. Interestingly, the CDS (BN69_0853) present directly upstream of this monocistronic gene encodes an ATP-dependent zinc metalloprotease, FtsH1 protein. No such gene is present in the vicinity of pmoC2Gs. When we
searched the genome of strain Rockwell,ftsHgenes were found immediately downstream of two of its four monocistronicpmoC genes (ZP_08074599 and ZP_08075129). Characterized in Escherichia coli, FtsH is a membrane-bound ATP-dependent protease that is involved in the degradation of uncomplexed or misfolded integral membrane proteins and short-lived cytoplasmic proteins [75,76,77]. FtsH functions as a protein-filtering system and ensures that only correctly folded protein is incorporated into the membrane. Based on the presence offtsHin close association to monocistronicpmoC, whose exact function is yet to be identified, one may speculate that this monocistronic gene (along with FtsH) might act as a sensor to screen whether properly folded pMMO is incorporated into the membrane of these methanotrophs. How-ever, this needs to be experimentally verified, before claiming an exact function in the two strains, SC2 and Rockwell. NoftsHgene was detected in the vicinity of the monocistronic pmoCin strain OB3b (EFH02634) and Mc. capsulatus Bath (YP_112829). A possible explanation for the absence of this gene might be the additional presence of the soluble form of methane monooxygen-ase (sMMO) in these bacteria.
(d) Nitrogen metabolism-related genes. Genome se-quence analysis revealed the presence of a large number of genes whose products are presumably involved in nitrogen metabolism. This includes N2 fixation, ammonium transport, assimilatory
nitrate/nitrite reduction, hydroxylamine detoxification, and deni-trification (Table S1) [20]. A full chromosome-encoded comple-ment of N2 fixation-related genes (34 CDS) was identified. The
genes mostly clustered together, suggesting that strain SC2 is capable of utilizing N2as a nitrogen source (see below).
The first step in nitrification is the oxidation of ammonia to hydroxylamine. Ammonia monooxygenase (AMO) performs this step in ammonia-oxidizing bacteria. AMO and pMMO are known to be homologous. They are encoded by three contiguous genes that are organized in the orderamoCAB/pmoCAB[78,79]. Due to their structural homology, pMMO can also oxidize ammonia [80]. Hydroxylamine is highly toxic and bacteria that can oxidize ammonia must have effective mechanisms to detoxify it. All ammonia oxidizers and some methanotrophs are known to use hydroxylamine oxidoreductase (HAO) to oxidize hydroxylamine to nitrite. However, the difference lies in the fact that ammonia oxidizers, but not methanotrophs, use this step for energy production [27]. ThehaoABoperon, encoding this enzyme, was identified in the chromosome of strain SC2 (BN69_3242, BN69_3241). In addition, the chromosome encodes a hydroxyl-amine reductase or hybrid cluster protein (BN69_0431) that presumably detoxifies hydroxylamine by reducing it to ammonia. A second copy of hydroxylamine reductase was identified in pBSC2-2 [50]. Thus, strain SC2 apparently possesses two different systems to detoxify hydroxylamine. None of the other genome-sequenced methanotrophs are known to possess both detoxifica-tion systems.
Methanotrophs are reported to produce N2O during ammonia
Two genes were predicted to encode ammonium transporters (BN69_0915 and BN69_0931), suggesting that ammonia is an important nitrogen source for strain SC2. We also identified genes encoding the high-affinity ATP-driven potassium transporter (kdpABC). These three genes encoding the potassium transporter ATPase (BN69_2487 to BN69_2489) are located immediately downstream of an osmosensitive signal transduction histidine
kinase (kdpD, BN69_2486) and a two-component transcriptional regulator (kdpE, BN69_2485). The potassium transporter has been shown to also transport ammonium ions. This is due to the similarity between ammonium and potassium ions, both in terms of charge and size [82]. Thus, this transporter may facilitate transport of ammonium ions in strain SC2. The chromosome includes a full complement of genes (BN69_2468 to BN69_2473) Figure 2. Prediction of theoriCregion by Ori-Finder.(A) 1,063-bp sequence (2,008,193 bp to 2,009,255 bp) of the predictedoriCsite. Three
dnaAbox motifs identified using theEscherichia colispecificdnaAboxes are bold-faced and highlighted. Palindromic repeats identified in this region are marked by arrows at the top. (B, C) The Z-curves measuring the disparity between the percent content of AT (red lines), GC (green lines), RY (blue lines) and MK (yellow lines) for the original sequence (B) and the rotated sequence (C). It should be noted that the coordinate origin of the rotated sequence begins and ends in the maximum of the GC disparity curve. Short vertical red lines at the top show the locations of indicator genes, such as
dnaA,dnaN,gidA, andhemE. The upward black arrow indicates the position of the predictedoriC. Purple peaks with diamonds indicate DnaA box clusters. (D) Pairwise alignment between thedifsites located in the genomes ofE. coliand strain SC2. In strain SC2, thedif-like sequence is located from nucleotide position 276,895 to 276,922 (almost halfway of the deducedoriC) and matches at 20 nucleotide positions with the 28-bpdif
sequence ofE. coli.
doi:10.1371/journal.pone.0074767.g002
Genome Analysis ofMethylocystissp. Strain SC2
for transport of nitrate/nitrite across the cytoplasmic membrane and their reduction to ammonia. This is referred as the assimilatory nitrate/nitrite reductase system (Nas). However, genes encoding the Nar or Nap type of nitrate reductase were not found. Ammonium is the most reduced form of inorganic nitrogen prior to its incorporation into organic nitrogen compounds via glutamate or glutamine, which serve as the key nitrogen donors for biosynthetic processes. The incorporation can occur via the glutamine synthetase/glutamate synthetase (GS) or NADPH-dependent glutamine oxoglutarate amidotransferase (GOGAT) pathway, or the glutamate dehydrogenase (GDH) pathway [83]. In bacteria, GS and GOGAT function as alternative pathways of ammonia assimilation and operate when ammonia is present in the growth medium at low levels [84]. The SC2 chromosome encodes GS (BN69_0652) and both the large (BN69_3582) and small (BN69_3584) subunits of GOGAT. GDH (BN69_0999) was also identified.
In addition to enzymes of the nitrogen metabolism, many potential regulatory components involved in this process are encoded by the chromosome, including sigma factor RpoN (BN69_2202). This factor is essential for the expression of several nitrogen regulons, such as thentr(nitrogen regulation) andnif(N2
fixation) operons. However, RpoN is not only involved in the nitrogen metabolism, but also controls the regulation of a number of other metabolic processes in bacteria. For example, in Pseudomonas putida, RpoN was found to be involved in processes like motility and expression of plasmid-encoded catabolite operons, and in determining the ability of P. putida to utilize diverse nitrogen and carbon sources [85].
The genes encoding the nitrogen signaling cascade (ntrBC [BN69_0222, BN69_0223] andntrYX[BN69_0224, BN69_0225]) and a gene for uridyltransferase (glnD [BN69_3100]) were also identified. NtrB and NtrC act as a two-component signal transduction cascade for nitrogen regulation, where NtrB is the bifunctional histidine kinase and NtrC is its cognate response regulator [86]. They are required for maximal GS synthesis. The second transcription regulator, ntrYX, is located immediately upstream to ntrBC. The NtrY and NtrX proteins constitute a two-component regulatory system that is involved in N2fixation
and metabolism [87]. Allntr genes are clustered together in an operon, nifR3-ntrB-ntrC-ntrY-ntrX. The fifth component of this operon,nifR3(BN69_0221), encodes a tRNA-dihydrouridine.
The identification of a full complement of N2fixation-related
genes and plasmid-borne genes for denitrification prompted us to test strain SC2 for these metabolic capabilities.
Physiological studies on the nitrogen metabolism of strain SC2
(a) N2fixation. The ability of strain SC2 cells to fix N2was
tested in nitrogen-free mineral salts medium. The serum bottles were flushed with N2followed by the addition of methane (20%).
Different initial concentrations of oxygen were tested. Maximum growth was observed with 10% oxygen in the headspace, while 5% oxygen allowed little growth (Figure 3A). Insignificant increase in OD600value was observed under lower (1%) and higher (15% and
20%) oxygen concentrations. Most likely, the optimal concentra-tion for growth of strain SC2 under N2-fixing conditions is
between 5% and 10% oxygen. In respect to their N2-fixing
activities, methanotrophic bacteria are known to vary in oxygen sensitivity. In batch cultivation, the requirement of low oxygen concentration has been demonstrated for Methylobacter luteus (,2%), ‘Ma. fumariolicum’ SolV (,2%),Methylocystissp. strain T-1 (,6%) andMc. capsulatusBath (,10%) [21,22,24,88]. In contrast, some other methanotrophs are able to fix N2 at higher oxygen
concentrations including, for example,Ms. trichosporiumOB3b (15– 17%) and Methylocapsa acidiphila B2T (atmospheric oxygen concentration) [22,23,89].
The cells growing in N-free medium were tested for nitrogenase activity using the acetylene reduction assay. As methane oxidation or, more precisely, the activity of methane monooxygenase is known to be inhibited by acetylene [90,91], methanol was used as a source of energy and reducing power in the assay [91]. Ethylene production was detected after 3 hours of incubation with acetylene, and the produced amount increased linearly for more than 24 hours. The 3-hour lag prior to ethylene production was also observed for other methanotrophs, such asMc. capsulatusBath and ‘Ma. fumariolicum’ SolV [24,92]. Ethylene production mea-sured after 24 hours of incubation was found to be affected by Figure 3. N2fixation by strain SC2.(A) Growth dynamics (OD600) of strain SC2 in batch cultures on N-free medium (with atmospheric N2as sole nitrogen source). Oxygen concentrations of 1% (blue), 5% (green), 10% (red), 15% (brown) and 20% (black) were used to test their effect on N2 fixation-mediated growth. Note that the x-axis is not in scale. (B) Effect of oxygen on the nitrogenase activity (acetylene reduction assay) in strain SC2. Ethylene production was measured after 24 hours of incubation under different concentrations of oxygen in the headspace. Data points are means
oxygen concentration in the headspace, with highest amount produced at 1% oxygen (133 nmol ethylene/mg dry weight of cells). The amount of ethylene produced decreased with increasing concentration of oxygen (Figure 3B). Thus, acetylene reduction activity was affected by the oxygen concentration as also observed in other aerobic diazotrophs including methanotrophs [21]. In principle, both the growth experiments and the nitrogenase activity assays consistently showed the detrimental effect of increasing oxygen concentration to N2 fixation. However, while
growth yield was highest at 10% oxygen, nitrogenase activity was greatest at around 1% oxygen in the headspace.
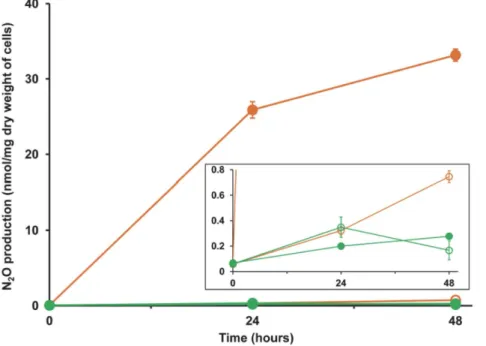
(b) Denitrification. Under standard growth conditions, strain SC2 was found to accumulate only a negligible amount of N2O, both under aerobic as well as anaerobic conditions (Figure 4).
One explanation for this result may be the presence of a non-functional (less-active) nitric oxide reductase. Another possibility may be the presence of an active/functional nitrous oxide reductase produced from the plasmid-borne nosoperon, thereby resulting in the rapid conversion of N2O to N2. To examine the
second possibility, we checked N2O production after blocking the
nosactivity with purified acetylene [93,94,95]. As acetylene is also a potent inhibitor of methane monooxygenase [90], we performed this experiment either by adding methanol or without a carbon source. Under aerobic conditions, N2O production was negligible
even after acetylene addition. This was expected as denitrification is an anaerobic process. However, under anaerobic conditions, acetylene inhibition was pronounced and N2O accumulated in the
headspace. After 48 hours of incubation, the methanol-fed cells produced 33 nM N2O per mg dry weight of cells (Figure 4).
Nearly equal amount of N2O (28 nM per mg dry weight of cells)
was produced when cells were incubated under starved condition (data not shown). In the methanol-fed cultures, methanol could act as an alternative electron donor in the absence of methane. However, the ability of the cells to produce N2O under starved
conditions needs further experimental investigation. A possible explanation might be that strain SC2 cells are able to use intracellular poly-beta-hydroxybutyrate (PHB) as a source of carbon during starvation periods. PHB was found to be produced by almost all alphaproteobacterial methanotrophs. Actually, strain SC2 produced the maximum amount of PHB among five different Methylocystisstrains and the third highest among all alphaproteo-bacterial methanotrophs tested [96]. During sequence analysis, genes encoding PHB metabolism-related enzymes were detected in the chromosome of strain SC2. These include two PHB depolymerases (BN69_2992 and BN69_3262), one polyhydrox-yalkonate synthesis repressor (PhbR [BN69_3069]), an acetyl-CoA acetyltransferase (PhbA [BN69_3068]), one acetoacetyl-CoA reductase (PhbB [BN69_3067]), and two phasin homologs (BN69_0212, BN69_1107). ThephbR,phbA, andphbBgenes form a cluster, but in an orientation different from that in the PHB-producing methanotroph Methylocystis parvus OBB (phbABR) [40]. The use of PHB as a reducing power for denitrification has been shown in microbial granules in bioreactors [97]. Moreover, strains of Methylocystis parvus were reported to be able to ferment intracellular PHB and use it as a reserve energy source under anoxic conditions [98,99]. These overall findings support the possibility that PHB degradation and denitrification are inter-linked in strain SC2.
To ultimately prove the emission of N2and thus the operation
of a plasmid-encoded denitrification process in strain SC2, a tracer experiment was performed using15N-nitrate (K15NO3) as the sole
nitrogen source. Under anoxic conditions, we could detect accumulation of about 0.7 nmol30N2/hr/mg dry weight of cells
(Figure 5). Taking all these findings together, strong evidence is
provided that strain SC2 possesses a complete denitrification pathway. However, its exact ecophysiological role still needs to be elucidated. Detoxification of toxic nitrogen compounds and energy conservation under oxygen-limiting conditions are among the possible roles.
Comparative genomics
(a) Comparative analysis of methanotroph genomes. Com-parative genomics is commonly used for the study of closely related strains of a single species, species of a particular genus, or species of related genera [100]. However, members of broader taxonomic ranks have also been compared, like those belonging to the same family, such asPseudonocardiaceae[101] andMethylophilaceae[102], or to different families [103]. Here, we compared the genome sequences of eight methanotrophs belonging to different classes and phyla. These include the genomes of four alphaproteobacterial and three gammaproteobacterial methanotrophs, and one from the recently described methanotroph of the phylumVerrucomicrobia. The remaining four publicly available genome sequences were not included in the comparative analysis. This includes the genome of the second verrucomicrobial methanotroph, ‘Ma. fumariolicum’ SolV, which is available in draft form; and three proteobacterial members, Methylocystis parvusOBBP,Mm. albumBG8 andMb. tundripaludum, for which no genome annotations were available. The main features identified in the compared genomes are summarized in Table 1. The genome sequences of strains Rockwell and OB3b are available in draft form and consist of numerous contigs. As strain SC2 is their closest relative, its finished genome sequence was used as the reference for assembling their contigs. The chromosome and the two plasmids of strain SC2 were concatenated to a single sequence containing 4,049 CDS, collectively referred to as the genome. The chromosome and plasmid sequences ofMm. alcaliphilum20Z were also concatenated into a single file, while the other genomes had no plasmids. The genome sequences were then subjected to compar-ative analysis, using the EDGAR platform [100].
The pan-genome or the full complement of genes present in the eight methanotroph genomes sums up to 19,358 CDS. On the contrary, the set of genes shared by all eight methanotrophs was represented by only 154 CDS. This core genome represents the conserved genetic backbone and encodes basic cellular machin-eries, such as DNA replication, DNA repair, transcription, protein biosynthesis, cell division and a few chaperon and heat-shock proteins (Table S3). None of the genes encoded by the plasmids of strain SC2 are included in the core gene set. The number of core genes is remarkably low, presumably due to the fact that the compared methanotrophs are from phylogenetically very distinct groups. However, in the verrucomicrobial genome, 35% of genes were found to be related to proteobacteria [48]. The set of core genes increased to 328 CDS, when this genome was removed from the calculation.
Although the methanotrophs compared in this study exhibit the same basic metabolic capability of utilizing methane as carbon and energy source, none of the key genes involved in the process were shared by all of them. This is due to the fact that methanotrophs have distinct enzyme systems for metabolizing methane. Some possess either pMMO or sMMO, while others have the ability to produce both key enzymes. They use different pathways for assimilation of formaldehyde into cell biomass. While alphapro-teobacterial methanotrophs use the serine pathway, gammapro-teobacterial methanotrophs employ the RuMP pathway. Similar to our findings, a very small set of core genes was observed between five genera of the family Methylophilaceae [102]. Most interestingly, although the central metabolism in all compared Methylophilaceae members was methylotrophy, their core genome
Genome Analysis ofMethylocystissp. Strain SC2
was devoid of genes encoding some of thebona fide methylotrophy-related functions, such as methanol dehydrogenase, methylamine dehydrogenase, and the H4MPT-linked formaldehyde oxidation
[102].
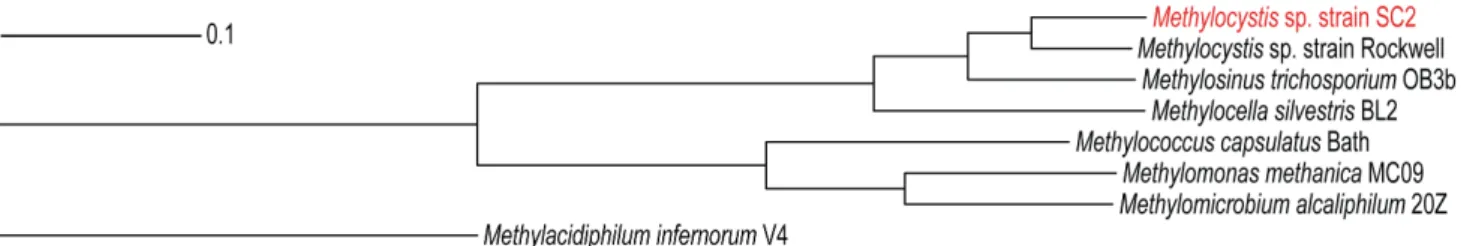
A phylogenetic analysis was performed using the concatenated multiple alignments of all 154 core genes (Table S3) and the neighbor-joining method for tree construction. In the core genome tree, members of the proteobacterial methanotrophs were grouped into two distinct clades, with the distantly related genome ofMa. infernorum V4 forming the outgroup (Figure 6). This clustering
agreed well with the known phylogeny of methanotrophs as inferred from the comparative analysis of 16S rRNA and pmoA gene sequences [2]. To identify the core gene content that is specific to the genomes of the alphaproteobacterial or gamma-proteobacterial methanotrophs, both groups were analyzed separately. While the four alphaproteobacterial methanotrophs shared 1,306 CDS, the three gammaproteobacterial methano-trophs shared 1,193 CDS among themselves (Figure S1).
(b) Comparative analysis amongMethylocystaceae. Three of the eight methanotroph genomes that were comparatively Figure 4. N2O production by strain SC2.Cells were incubated in NMS, either in the presence (filled symbol) or absence (open symbol) of 10% acetylene. Assays were performed both under anaerobic (orange) and aerobic (green) conditions. Data points are means6SD of three separate experiments. The inset shows the same graph with a y-axis zoomed in for the range 0 to 0.8.
doi:10.1371/journal.pone.0074767.g004
Figure 5. Denitrification-mediated N2production by strain SC2.30N2production was measured after fifteen days for cells incubated in NMS containing either K15NO
3(blue) or KNO3(orange). The assays were performed under both anaerobic and aerobic conditions. Data points are means
analyzed belong to the familyMethylocystaceaein theAlphaproteobacteria. In addition to strain SC2, this includes Methylocystis sp. strain Rockwell and Ms. trichosporium OB3b. Their 16S rRNA gene sequences show a high similarity of respectively 99% and 96% to that of strain SC2. To get an insight into the genomic variation among these three alphaproteobacterial methanotrophs, their genomes were compared in greater detail. Their pan-genome totals 8,374 CDS, while they shared a set of 1,853 CDS among themselves (Figure 7). The predicted products of these common genes are distributed across almost all functional categories of the SEED subsystems (Figure 8). The number of genes assigned to three subsystems, namely, ‘cell wall and capsule’, ‘membrane transport’ and ‘amino acid and derivatives’, showed significant differences between the individual strains and their core genome (Figures 8, S2). Apart from the conserved core genome of all methanotrophs mentioned above, this includes additional genes involved in basic cellular functions. In addition, they also share genes involved in maintaining a methanotrophic lifestyle. These encode, among other proteins, pMMO, methanol dehydrogenase, pyrroloquinoline qui-none cofactor biosynthesis proteins, and formate dehydrogenase. Thirty-four nitrogen metabolism-related genes are also shared. These include genes related to N2fixation, ammonia assimilation,
and assimilatory nitrate/nitrite reduction. In addition to the core genes, strains SC2 and Rockwell share, respectively, 228 and 278 genes with strain OB3b, while they share 537 genes among themselves (Figure 7). Genes that need to be specifically mentioned include the different hydroxylamine detoxification systems shared by strain SC2 with either strain Rockwell (haoAB) or strain OB3b (hcp). Eleven percent of the genes shared between strains Rockwell and OB3b are involved in flagella biosynthesis. Although the motility of Ms. trichosporium OB3b is well known [104], all Methylocystis spp. studied so far, including strain SC2, are reported to be non-motile [1,105,106,107,108,109]. This is due to the absence of flagella and, as expected, no flagella biosynthesis-related genes were detected in strain SC2 (Figure 8). However, although no published evidence is available for the motility of strain Rockwell, presence of genes responsible for flagella biosynthesis may suggest that this strain is motile. Another interesting finding is that 53 CDS categorized in the subsystem ‘iron acquisition and metabolism’ are present only in the genome of strain OB3b. These include genes involved in iron acquisition and siderophore production (Figure S2). In contrast, strains Rockwell and SC2, respectively, contain only one and two of these genes. The ability of strain OB3b to produce siderophores, albeit in small amounts, was previously shown, using the Fe-chrome azurol S (CAS) plate assay [110].
The threeMethylocystaceaemembers shared approximately half of their CDS, while the other half is unique to the respective strain. Presence of a large number of unique genes even among closely
related genomes has been frequently observed [100]. Interestingly, the majority of the genes unique to the individual strain are novel or conserved hypothetical. Only a small proportion could be assigned to functional groups in the SEED subsystem, using the RAST server for analysis. This includes 176 (out of 1,441), 100 (out of 1,969) and 302 (out of 2,108) CDS present in the genomes of strains SC2, Rockwell and OB3b, respectively. Among the enzymes encoded by the 1,441 unique genes identified in strain SC2, those that need special mention are the high-affinity pMMO2 and the plasmid-encoded nitric oxide and nitrous oxide reductases. In addition, strain SC2 possesses two pmoCAB1 operons, while strains Rockwell and OB3b harbor a single copy of pmoCAB. Based on manual search, we could identify a large number of unique genes (173) in strain Rockwell to encode different families of transposases. The number of transposase-encoding genes was quite low in the unique gene set of strains SC2 (45) and OB3b (25). Five such genes were found to be shared by strains Rockwell, SC2, and OB3b. In fact, the number of transposases encoded by the genome of strain Rockwell was almost five times more than the average number of such genes (,38) detected in 2,137 complete genome sequences analyzed
[111]. This may suggest that genome rearrangements occur more frequently in strain Rockwell than in the other twoMethylocystaceae Figure 6. Neighbor-joining tree constructed for the methanotrophic core genome.The tree is based on the alignment of 154 CDS that are common to all eight methanotroph genomes used for comparative analysis. Non-matching parts of the alignments were eliminated prior to tree construction. The individual gene alignments were combined into one concatenated alignment. The neighbor-joining tree was constructed using EDGAR. All branches of the phylogenetic tree showed 100% bootstrap support based on 500 replications. See ‘Materials and Methods’ for further details.
doi:10.1371/journal.pone.0074767.g006
Figure 7. Venn diagram showing the number of CDS unique to and shared by theMethylocystaceaemembers.Data analysis was performed using the genomes of strain SC2 (red), strain Rockwell (blue) andMs. trichosporiumOB3b (green). Numbers in circles indicate the number of unique CDS, while those in intersections represent the number of orthologous CDS common to two or more strains. Orthologs were detected by reciprocal best BLASTP matches with the EDGAR software.
doi:10.1371/journal.pone.0074767.g007
Genome Analysis ofMethylocystissp. Strain SC2
members. The unique genes present in strain OB3b are those encoding for the soluble methane monooxygenase, iron acquisi-tion systems, urea decomposiacquisi-tion system, a large number of membrane transporters and systems imparting resistance to antibiotics and toxic compounds.
Final remarks
Annotation and comparative analysis of the genome sequence of strain SC2 provide detailed insights into the lifestyle and metabolic potential of this bacterium. Genome analysis coupled with physiological experiments confirmed that strain SC2 possesses diverse nitrogen metabolism-related pathways. This includes the capability to fix atmospheric N2 and perform a complete
denitrification process, suggesting that strain SC2 is able to thrive under oxygen- and nitrogen-limiting conditions. Its capability to survive in low-methane environments has already previously been shown. The functionality of the plasmid-encoded nitrous oxide reductase is unique to known methanotrophs. Under the tested conditions, the enzyme efficiently converts N2O to N2. The
presence of the completenosoperon and a monocistronicpmoCon pBSC2-2 suggests that at least this plasmid confers important metabolic traits to strain SC2. Absence of CRISPR/Cas systems may have allowed strain SC2 to acquire and maintain its two plasmids. Comparative genomics across the major methanotroph groups revealed that, although performing the same key metabolic processes, they have very few genes in common. However, the three Methylocystaceae members share almost half of their genes. These encode (among other) the central metabolic pathways for methane oxidation and nitrogen fixation. On the other hand, they clearly differ in their genetic potential. This includes the presence of the high-affinity pMMO2 and plasmid-encoded nitrous oxide reductase in strain SC2, high number of iron acquisition systems in strain OB3b, and motility-related genes and predicted genome instability in strain Rockwell (the latter derived from the large number of transposase genes).
Materials and Methods Growth conditions
Strain SC2 was cultivated in nitrogen-containing (1 g KNO3
per litre) mineral salts medium (NMS) without any vitamin supplement [112]. In N-free medium, no nitrogen-containing compound was added. Whenever there was a change in media, cultures were harvested by centrifugation (2,6556g, 15 min, 4uC), washed twice with phosphate buffer (5.4 g Na2HPO4?7H2O and
2.6 g KH2PO4per litre distilled H2O) and finally resuspended in
the desired medium. After each physiological experiment, purity of the culture was confirmed by fluorescence in situ hybridization (FISH) using a strain SC2-specific 16S rRNA-targeted oligonu-cleotide probe as described earlier [105] (Figure S3).
N2fixation assay
N2-fixing ability of strain SC2 was tested by batch incubation in
N-free medium. Cells used for the assay were initially grown in NMS medium up to early logarithmic phase and washed properly to remove any residual nitrogen source. They were then inoculated in 20 ml N-free medium, resulting in an initial OD600of 0.05. Incubation was done in 120-ml serum bottles that
were sealed with butyl rubber stoppers. The bottles were flushed
with N2. Methane (20% [vol/vol]) and the desired amount of
oxygen (1, 5, 10, 15 or 20% [vol/vol]) were then injected into the headspace.
The acetylene reduction assay is widely used to test for nitrogenase activity in bacteria and was performed accordingly [21,24,90,113]. To induce enzyme activity, cells were initially grown in N-free medium. Briefly, 5 ml of a suspension of log-phase cells (0.48 mg dry weight) were transferred to 25-ml serum bottles and sealed with butyl rubber stoppers. The bottles were flushed with N2-free helium gas. Oxygen in the headspace was
then set to 1, 5, 10, 15, or 20% (vol/vol), as mentioned above. Methanol was added to a final concentration of 0.1% (vol/vol). Acetylene (10% [vol/vol]), which had been purified by successive passage through 2 M sulfuric acid and double-distilled water, was then injected. To measure the ethylene production, 0.5 ml of the gas phase was sampled at fixed time intervals and analyzed using a gas chromatograph. The gas chromatograph (GC 14b; Shimadzu, Griesheim, Germany) was equipped with a stainless steel column filled with Porapak R and a flame ionization detector. N2was used
as the carrier gas. Pure acetylene and ethylene were used for calibration and as standards. All gas chromatography systems were routinely calibrated with certified gas standards (Air Liquide GmbH, Kassel, Germany). In all measurements, signals were processed and chromatograms were integrated using the Peak Simple software (version 2.66, SRI Instruments, Torrence, CA, USA).
Denitrification assay
The acetylene inhibition method [93,94,95] was used to verify the production of N2O by strain SC2. Briefly, NMS-grown
log-phase cells (3.4 mg dry weight) were resuspended in 5 ml of fresh NMS medium supplemented with methanol (0.1% [vol/vol]) or without a carbon source in 25-ml serum bottles that were capped with butyl rubber stoppers. To make the system anaerobic, the headspace was flushed with N2for 10 min. If aerobic conditions
should be maintained, oxygen (as described above) was injected into the headspace. When needed, purified acetylene was added to inhibit the conversion of N2O to N2. The bottles were then
incubated on a rotary shaker at 30uC and periodically analyzed for N2O in the headspace using a gas chromatograph (Carlo Erba
Instruments, GC 8000) connected to a 63Ni-electron capture detector (ECD) [95]. Potential rates of N2O production were
calculated by linear regression after correcting for N2O dissolved
in the liquid phase using the Bunsen coefficient for N2O [114].
Using 15N-nitrate (K15NO3), a tracer experiment was
per-formed to check denitrification-mediated formation of N2. Strain
SC2 cells (3.5 mg dry weight) that were pre-grown in NMS up to log phase were washed twice and resuspended in 5 ml of fresh NMS medium containing K15NO3(isotopic purity of 98%
15
N; Sigma-Aldrich) as the only nitrogen source, in 25-ml serum bottles. A control set was also installed where K15NO3was replaced with
KNO3. The serum bottles were sealed tightly with butyl rubber
stoppers and, to make the system anaerobic, flushed with N2-free
helium for 10 min. Aerobic conditions were maintained as described above. Bottles were incubated at 30uC on a rotary shaker. The production of N2and the isotopic composition of N2
in the headspace was analyzed with a GC-IRMS system [114]. As K15NO3 was the only nitrogen source, the masses 28 (28N2
[14N14N]) and 29 (29N2[14N15N]) were ignored and the increase in
category. The number of CDS classified for the individual strains and their core genome into each SEED subsystem was subjected to statistical analysis using STAMP. Ap-value cutoff of 0.05 was used to determine significant differences. Subsystems showing significant differences are marked by an asterisk.
doi:10.1371/journal.pone.0074767.g008
Genome Analysis ofMethylocystissp. Strain SC2
mass 30 (30N2 [15N15N]) with time was used as a proof of
denitrification [114,115]. 30N2 production was determined after
fifteen days of incubation, because production was below the detection limit during the initial days of incubation.
Comparative genome analysis
Annotations of the chromosome and plasmid sequences of strain SC2 were performed using the Silver genome annotation interface (http://www.micro-genomes.mpg.de/). All CDS mentioned in the text have an E-value of 10210as cutoff.
Eight methanotroph genomes (Table 1) were used to setup a new comparative genomics project in the EDGAR server of the Center for Biotechnology, Bielefeld University, Bielefeld, Ger-many (http://edgar.cebitec.uni-bielefeld.de) [100]. For strain SC2 and Mm. alcaliphilum 20Z, concatenated sequences of their chromosome and the plasmid(s) were used. The strain SC2 genome was used as the reference in all comparative analyses. The EDGAR platform calculates so-called BLASTP score ratio values (SRV) and then defines orthologous proteins based on bidirec-tional best BLAST hits. As the genomes used in this comparative study represent a set of phylogenetically diverse bacteria, a comparably low SRV cutoff of 35 was used. As a consequence, paralogous genes might have been discarded during the analysis.
Construction of a core genome tree
EDGAR was used to construct a phylogenetic tree based on 154 CDS common to all analyzed species (orthology-cutoff 35% SRV) [100]. The genomic sequences that were initially aligned sum up to 1,232 CDS with a total of 473,457 amino acids. Alignments of these core genes were generated using MUSCLE [116], with non-matching parts being masked by GBLOCKS and subsequently removed [117]. The remaining parts of all the individual gene alignments were compiled in one concatenated alignment. Pairwise distances between the concatenated core genome sequences were calculated using Kimura’s two-parameter method. The distance matrix was used as input to construct a phylogenetic tree with the neighbor-joining method (implemented in the PHYLIP package). The final tree was created in Newick format and visualized in iTOL, a web server for visualizing phylogenetic trees (http://itol.embl.de/index.shtml).
Classification of CDS into functional groups
To classify CDS present in a particular genome or a selected gene set (like the core genome) into functional groups, we used the RAST server (http://rast.nmpdr.org/rast.cgi). To achieve this classification, the gene sets (in GenBank format) were subjected to automated annotation process in the SEED subsystem using RAST, and gene calls were preserved as in the uploaded file [118]. This resulted in an output where the CDS were functionally classified into 27 distinct hierarchical categories. Analysis of significant differences in the number of CDS classified for the individual strains and their core genome into each SEED subsystem was performed using STAMP (Statistical Analysis of Metagenomic Profiles) [119].
Supporting Information
Figure S1 Venn diagrams showing the number of CDS unique to and shared by different methanotrophs. Numbers in circles indicate the total number of CDS unique to each member, while those in intersections represent the number of orthologous CDS common to two or more methanotrophs. (A, B) Comparative genomics was performed between (A) four alpha-proteobacterial methanotrophs [(1)Methylocystissp. strain SC2, (2) Mce. silvestrisBL2, (3)Methylocystissp. strain Rockwell, and (4)Ms. trichosporiumOB3b] and (B) three gammaproteobacterial methano-trophs [(1)Mm. alcaliphilum 20Z, (2) Mc. capsulatusBath, and (3) Mmo. methanicaMC09]. Orthologs were detected by reciprocal best BLASTP matches with the EDGAR software.
(TIF)
Figure S2 Strain-specific differences in the number of CDS present in particular SEED subsystems relative to the core genome. The number of CDS classified for the individual strains and their core genome into each SEED subsystem was subjected to statistical analysis using STAMP. A p-value cutoff of 0.05 was used for determining significant differences. Subsystems showing significant differences in strains SC2 (A), Rockwell (B) and OB3b (C) (blue), when compared to their core genome (orange), are shown.
(TIF)
Figure S3 Purity check of strain SC2 by FISH. Represen-tative field of view showing cells of strain SC2: (A) phase contrast microscopy; (B, C) whole-cell hybridization with bacterial probe EUB338 (green) and species-specific probe Mcyst-1256 (red); (D) staining with DAPI (blue). Bar represents 10mm.
(TIF)
Table S1 Gene products that are known or likely to be involved in methane oxidation and nitrogen metabolism ofMethylocystissp. strain SC2.Gene homologs identified in the draft genomes of strain Rockwell andMs. trichosporiumOB3b are shown in the last two columns by their respective locus tags. (DOCX)
Table S2 BLAST hits of the strain SC2 plasmid-encoded
nosgenes. (DOCX)
Table S3 List of 154 CDS that form the core genome of the eight methanotrophs compared in this study and were used for the construction of the genome tree. (XLSX)
Acknowledgments
Geshe Braker and Svetlana N. Dedysh are greatly acknowledged for expert advice.
Author Contributions
Conceived and designed the experiments: BD SD WL. Performed the experiments: BD SD. Analyzed the data: BD SD JB WL. Contributed reagents/materials/analysis tools: WL. Wrote the paper: BD SD WL.
References
1. Hanson RS, Hanson TE (1996) Methanotrophic bacteria. Microbiol Rev 60: 439–471.
2. Op den Camp HJM, Islam T, Stott MB, Harhangi HR, Hynes A, et al. (2009) Environmental, genomic and taxonomic perspectives on methanotrophic
Verrucomicrobia. Environ Microbiol Rep 1: 293–306.
3. Eller G, Frenzel P (2001) Changes in activity and community structure of methane-oxidizing bacteria over the growth period of rice. Appl Environ Microbiol 67: 2395–2403.
4. Horz HP, Yimga MT, Liesack W (2001) Detection of methanotroph diversity on roots of submerged rice plants by molecular retrieval ofpmoA,mmoX,mxaF, and 16S rRNA and ribosomal DNA, includingpmoA-based terminal restriction fragment length polymorphism profiling. Appl Environ Microbiol 67: 4177– 4185.
6. Knief C, Lipski A, Dunfield PF (2003) Diversity and activity of methanotrophic bacteria in different upland soils. Appl Environ Microbiol 69: 6703–6714. 7. Knief C, Kolb S, Bodelier PL, Lipski A, Dunfield PF (2006) The active
methanotrophic community in hydromorphic soils changes in response to changing methane concentration. Environ Microbiol 8: 321–333.
8. Chen Y, Dumont MG, Cebron A, Murrell JC (2007) Identification of active methanotrophs in a landfill cover soil through detection of expression of 16S rRNA and functional genes. Environ Microbiol 9: 2855–2869.
9. Cebron A, Bodrossy L, Chen Y, Singer AC, Thompson IP, et al. (2007) Identity of active methanotrophs in landfill cover soil as revealed by DNA-stable isotope probing. FEMS Microbiol Ecol 62: 12–23.
10. McDonald IR, Murrell JC (1997) The particulate methane monooxygenase genepmoAand its use as a functional gene probe for methanotrophs. FEMS Microbiol Lett 156: 205–210.
11. Dedysh SN, Dunfield PF, Derakshani M, Stubner S, Heyer J, et al. (2003) Differential detection of type II methanotrophic bacteria in acidic peatlands using newly developed 16S rRNA-targeted fluorescent oligonucleotide probes. FEMS Microbiol Ecol 43: 299–308.
12. Chen Y, Dumont MG, McNamara NP, Chamberlain PM, Bodrossy L, et al. (2008) Diversity of the active methanotrophic community in acidic peatlands as assessed by mRNA and SIP-PLFA analyses. Environ Microbiol 10: 446–459. 13. Nauer PA, Dam B, Liesack W, Zeyer J, Schroth MH (2012) Activity and diversity of methane-oxidizing bacteria in glacier forefields on siliceous and calcareous bedrock. Biogeosciences 9: 2259–2274.
14. Belova SE, Baani M, Suzina NE, Bodelier PLE, Liesack W, et al. (2011) Acetate utilization as a survival strategy of peat-inhabitingMethylocystisspp. Environ Microbiol Rep 3: 36–46.
15. Im J, Lee S-W, Yoon S, DiSpirito AA, Semrau JD (2011) Characterization of a novel facultativeMethylocystisspecies capable of growth on methane, acetate and ethanol. Environ Microbiol Rep 3: 174–181.
16. Nyerges G, Han SK, Stein LY (2010) Effects of ammonium and nitrite on growth and competitive fitness of cultivated methanotrophic bacteria. Appl Environ Microbiol 76: 5648–5651.
17. Nyerges G, Stein LY (2009) Ammonia cometabolism and product inhibition vary considerably among species of methanotrophic bacteria. FEMS Microbiol Lett 297: 131–136.
18. Ricke P, Erkel C, Kube M, Reinhardt R, Liesack W (2004) Comparative analysis of the conventional and novelpmo(particulate methane monooxygen-ase) operons fromMethylocystisstrain SC2. Appl Environ Microbiol 70: 3055– 3063.
19. Baani M, Liesack W (2008) Two isozymes of particulate methane monoox-ygenase with different methane oxidation kinetics are found inMethylocystissp. strain SC2. Proc Natl Acad Sci USA 105: 10203–10208.
20. Dam B, Dam S, Kube M, Reinhardt R, Liesack W (2012) Complete genome sequence ofMethylocystissp. strain SC2, an aerobic methanotroph with high-affinity methane oxidation potential. J Bacteriol 194: 6008–6009.
21. Murrell JC, Dalton H (1983) Nitrogen fixation in obligate methanotrophs. J Gen Microbiol 129: 3481–3486.
22. Dedysh SN, Ricke P, Liesack W (2004) NifH and NifD phylogenies: an evolutionary basis for understanding nitrogen fixation capabilities of methano-trophic bacteria. Microbiology 150: 1301–1313.
23. Auman AJ, Speake CC, Lidstrom ME (2001) nifHsequences and nitrogen fixation in type I and type II methanotrophs. Appl Environ Microbiol 67: 4009–4016.
24. Khadem AF, Pol A, Jetten MS, Op den Camp HJ (2010) Nitrogen fixation by the verrucomicrobial methanotroph ‘Methylacidiphilum fumariolicum’ SolV. Microbiology 156: 1052–1059.
25. Zumft WG (1997) Cell biology and molecular basis of denitrification. Microbiol Mol Biol Rev 61: 533–616.
26. Waibel AE, Peter T, Carslaw KS, Oelhaf H, Wetzel G, et al. (1999) Arctic ozone loss due to denitrification. Science 283: 2064–2069.
27. Klotz MG, Stein LY (2008) Nitrifier genomics and evolution of the nitrogen cycle. FEMS Microbiol Lett 278: 146–156.
28. Wrage N, Velthof GL, van Beusichem ML, Oenema O (2001) Role of nitrifier denitrification in the production of nitrous oxide. Soil Biol Biochem 33: 1723– 1732.
29. Campbell MA, Nyerges G, Kozlowski JA, Poret-Peterson AT, Stein LY, et al. (2011) Model of the molecular basis for hydroxylamine oxidation and nitrous oxide production in methanotrophic bacteria. FEMS Microbiol Lett 322: 82– 89.
30. Bergmann DJ, Zahn JA, Hooper AB, DiSpirito AA (1998) Cytochrome P460 genes from the methanotrophMethylococcus capsulatusBath. J Bacteriol 180: 6440–6445.
31. Elmore BO, Bergmann DJ, Klotz MG, Hooper AB (2007) Cytochromes P460 and c9-beta; a new family of high-spin cytochromes c. FEBS Lett 581: 911–916. 32. Poret-Peterson AT, Graham JE, Gulledge J, Klotz MG (2008) Transcription of nitrification genes by the methane-oxidizing bacterium,Methylococcus capsulatus
strain Bath. ISME J 2: 1213–1220.
33. Sutka RL, Ostrom NE, Ostrom PH, Gandhi H, Breznak JA (2003) Nitrogen isotopomer site preference of N2O produced by Nitrosomonas europaea and
Methylococcus capsulatusBath. Rapid Commun Mass Spectrom 17: 738–745. 34. Sutka RL, Ostrom NE, Ostrom PH, Breznak JA, Gandhi H, et al. (2006)
Distinguishing nitrous oxide production from nitrification and denitrification on the basis of isotopomer abundances. Appl Environ Microbiol 72: 638–644.
35. Stein LY, Klotz MG (2011) Nitrifying and denitrifying pathways of methanotrophic bacteria. Biochem Soc Trans 39: 1826–1831.
36. Stein LY (2011) Surveying N2O-producing pathways in bacteria. Methods Enzymol 486: 131–152.
37. Arp DJ, Stein LY (2003) Metabolism of inorganic N compounds by ammonia-oxidizing bacteria. Crit Rev Biochem Mol Biol 38: 471–495.
38. Zahn JA, Duncan C, DiSpirito AA (1994) Oxidation of hydroxylamine by cytochrome P-460 of the obligate methylotrophMethylococcus capsulatusBath. J Bacteriol 176: 5879–5887.
39. Stein LY, Yoon S, Semrau JD, Dispirito AA, Crombie A, et al. (2010) Genome sequence of the obligate methanotrophMethylosinus trichosporiumstrain OB3b. J Bacteriol 192: 6497–6498.
40. del Cerro C, Garcia JM, Rojas A, Tortajada M, Ramon D, et al. (2012) Genome sequence of the methanotrophic poly-beta-hydroxybutyrate producer
Methylocystis parvusOBBP. J Bacteriol 194: 5709–5710.
41. Stein LY, Bringel F, DiSpirito AA, Han S, Jetten MS, et al. (2011) Genome sequence of the methanotrophic alphaproteobacteriumMethylocystissp. strain Rockwell (ATCC 49242). J Bacteriol 193: 2668–2669.
42. Chen Y, Crombie A, Rahman MT, Dedysh SN, Liesack W, et al. (2010) Complete genome sequence of the aerobic facultative methanotroph
Methylocella silvestrisBL2. J Bacteriol 192: 3840–3841.
43. Ward N, Larsen Ø, Sakwa J, Bruseth L, Khouri H, et al. (2004) Genomic insights into methanotrophy: the complete genome sequence ofMethylococcus capsulatus(Bath). PLoS Biol 2: e303.
44. Kits KD, Kalyuzhnaya MG, Klotz MG, Jetten MS, Op den Camp HJ, et al. (2013) Genome sequence of the obligate gammaproteobacterial methanotroph
Methylomicrobium albumstrain BG8. Genome Announc 1: e00170-13. 45. Vuilleumier S, Khmelenina VN, Bringel F, Reshetnikov AS, Lajus A, et al.
(2012) Genome sequence of the haloalkaliphilic methanotrophic bacterium
Methylomicrobium alcaliphilum20Z. J Bacteriol 194: 551–552.
46. Boden R, Cunliffe M, Scanlan J, Moussard H, Kits KD, et al. (2011) Complete genome sequence of the aerobic marine methanotrophMethylomonas methanica
MC09. J Bacteriol 193: 7001–7002.
47. Svenning MM, Hestnes AG, Wartiainen I, Stein LY, Klotz MG, et al. (2011) Genome sequence of the Arctic methanotrophMethylobacter tundripaludumSV96. J Bacteriol 193: 6418–6419.
48. Hou S, Makarova KS, Saw JH, Senin P, Ly BV, et al. (2008) Complete genome sequence of the extremely acidophilic methanotroph isolate V4, Methylacidiphi-lum infernorum, a representative of the bacterial phylumVerrucomicrobia. Biol Direct 3: 26.
49. Khadem AF, Wieczorek AS, Pol A, Vuilleumier S, Harhangi HR, et al. (2012) Draft genome sequence of the volcano-inhabiting thermoacidophilic methano-trophMethylacidiphilum fumariolicumstrain SolV. J Bacteriol 194: 3729–3730. 50. Dam B, Kube M, Dam S, Reinhardt R, Liesack W (2012) Complete sequence
analysis of two methanotroph-specific repABC-containing plasmids from
Methylocystissp. strain SC2. Appl Environ Microbiol 78: 4373–4379. 51. Kolsto AB (1997) Dynamic bacterial genome organization. Mol Microbiol 24:
241–248.
52. Lima-Mendez G, Van Helden J, Toussaint A, Leplae R (2008) Prophinder: a computational tool for prophage prediction in prokaryotic genomes. Bioinfor-matics 24: 863–865.
53. Makarova KS, Grishin NV, Koonin EV (2006) The HicAB cassette, a putative novel, RNA-targeting toxin-antitoxin system in archaea and bacteria. Bioinformatics 22: 2581–2584.
54. Yamaguchi Y, Park JH, Inouye M (2011) Toxin-antitoxin systems in bacteria and archaea. Annu Rev Genet 45: 61–79.
55. Pedersen K, Zavialov AV, Pavlov MY, Elf J, Gerdes K, et al. (2003) The bacterial toxin RelE displays codon-specific cleavage of mRNAs in the ribosomal A site. Cell 112: 131–140.
56. Zhang Y, Zhang J, Hara H, Kato I, Inouye M (2005) Insights into the mRNA cleavage mechanism by MazF, an mRNA interferase. J Biol Chem 280: 3143– 3150.
57. Kamada K, Hanaoka F (2005) Conformational change in the catalytic site of the ribonuclease YoeB toxin by YefM antitoxin. Mol Cell 19: 497–509. 58. Maisonneuve E, Shakespeare LJ, Jørgensen MG, Gerdes K (2011) Bacterial
persistence by RNA endonucleases. Proc Natl Acad Sci U S A 108: 13206– 13211.
59. Kolodkin-Gal I, Engelberg-Kulka H (2006) Induction of Escherichia coli
chromosomal mazEF by stressful conditions causes an irreversible loss of viability. J Bacteriol 188: 3420–3423.
60. Hazan R, Sat B, Engelberg-Kulka H (2004)Escherichia coli mazEF-mediated cell death is triggered by various stressful conditions. J Bacteriol 186: 3663–3669. 61. Grissa I, Vergnaud G, Pourcel C (2007) CRISPRFinder: a web tool to identify clustered regularly interspaced short palindromic repeats. Nucleic Acids Res 35: W52–57.
62. Grissa I, Vergnaud G, Pourcel C (2007) The CRISPRdb database and tools to display CRISPRs and to generate dictionaries of spacers and repeats. BMC Bioinformatics 8: 172.
63. Barrangou R, Horvath P (2012) CRISPR: New horizons in phage resistance and strain identification. Annu Rev Food Sci Technol 3: 143–162. 64. Deveau H, Garneau JE, Moineau S (2010) CRISPR/Cas system and its role in
phage-bacteria interactions. Annu Rev Microbiol 64: 475–493.
65. Horvath P, Barrangou R (2010) CRISPR/Cas, the immune system of bacteria and archaea. Science 327: 167–170.
Genome Analysis ofMethylocystissp. Strain SC2