Molecular marker heterozygosities and genetic distances as correlates of
production traits in F
1bovine crosses
Daniella Tambasco-Talhari
1, Maurício Mello de Alencar
2, Cláudia Cristina Paro de Paz
3,
Geraldo Maria da Cruz
2, Armando de Andrade Rodrigues
2, Irineu Umberto Packer
4,
Luiz Lehmann Coutinho
4and Luciana Correia de Almeida Regitano
21
Universidade Federal de São Carlos, São Carlos,
SP, Brazil.
2Instituto de Zootecnia, Nova Odessa,
SP, Brazil.
3Embrapa - Centro de Pesquisa de Pecuária do Sudeste, São Carlos,
SP, Brazil.
4Escola Superior de Agricultura Luiz de Queiroz, Departamento de Produção Animal,
Piracicaba,
SP, Brazil.
Abstract
Several studies have investigated the relationship between heterozygosity, genetic distance and production traits. The objective of the present study was to evaluate the influence of the degree of heterozygosity and genetic distance on growth, carcass and reproductive related features in F1bovine crosses. We tested 10 polymorphic markers in 330 purebred cattle (Nelore, Canchim, Aberdeen Angus and Simental) and 256 crossbred cattle belonging to four crossbred groups. Individual heterozygosities (Hi) and multilocus genetic similarity (Dm) were estimated and used in correlation analysis against individual phenotypic measurements. Significant (p < 0.05) Hieffects occurred for birth weight, 15 to 18 month weight, hot carcass weight andlongissimus rib eye area. The extent to which increased heterozygosity (∆H) in F1 crosses can be predicted from the genetic distance of parental breeds was also investigated using Nei’s standard genetic distance (Ds) and standard heterozygosity (Hs). High correlations were found between ∆Hi,∆Hs and the Ds of the parental breeds. Our results suggest that heterozygosity of the ten molecular markers used in this study may affect live weight during at least one growth phase. Parental genetic distance was a suitable predictor of the degree of progeny heterozygosity.
Key words:bovine crosses, molecular markers, heterozygosity, genetic distance, production traits. Received: January 21, 2004; Accepted: August 18, 2004.
Introduction
The selection of suitable sires for the production of the first filial generation (F1) is an important prerequisite for the success of any breeding program, but this is compli-cated by the fact that classic sire selection relies on the eval-uation of the phenotypic value of the progeny which is time-consuming for large farm animals. An essential as-sumption underlying the prediction of hybrid performance is the correlation between heterozygosity and heterosis and in recent years molecular markers have been proposed for the prediction of heterosis and genetic relationship studies of both animal and plant species.
Several studies have investigated the relationships between genetic distance, degree of heterozygosity and production traits in populations of both feral and
domesti-cated animal and plant species. Many of these studies have shown positive correlations between heterozygosity at a small number of marker loci and traits related to fitness (Pierce and Mitton, 1982; Gartonetal., 1984; Stuberet al., 1992; Xiao et al., 1995), although negative correlations have also been reported (Zhanget al., 1996). When the
cor-relation involves heterozygosity based on allozymes it is difficult to distinguish between the direct effects of the allozyme loci and their influence as neutral markers (Pogson and Zouros, 1994), because of which poly-morphisms such as microsatellites and blood groups, that are not subject to direct selection, are normally used. This approach is consistent with the associative overdominance hypothesis that predicts that the cause of correlation is not specific to the type of genetic marker used. The use of markers associated with production traits (i.e. commer-cially desirable traits) has been proposed by Charcossetet al.(1991) to strengthen the accuracy of prediction because any correlation would arise from the associated effect of
www.sbg.org.br
Send correspondence to Luciana Correia de Almeida Regitano. Embrapa Sudeste Centro de Pesquisa Pecuária, Caixa Postal 339, 13560-970 São Carlos, SP, Brazil. E-mail: luciana@cppse. embrapa.br.
each marker locus. Regarding allele number, monomorphic or nearly monomorphic loci should be avoided due to the low probability that they will affect individual hetero-zygosities and the fact that a lower number of polymorphic systems can provide the same information (Cepicaet al., 1995). If microsatellites are used, it is important to verify that Mendelian allele segregation is occurring, due to the high occurrence of null alleles (Eggleston-Stott et al.,
1997) and preferential amplification (Rodriguez et al., 2001), and in both cases the non-detectable alleles must be considered in the heterozygosity estimate.
As far as we know there have been no previous re-ports of studies on bovines concerning parental genetic dis-tance, heterozygosity and production traits. The objective of the work presented in this paper was to rectify this lack of information by investigating the relationship among paren-tal genetic distance, heterozygosity and production traits (growth, carcass and reproductive related features) in F1 bovine crosses.
Material and Methods
Experimental conditions
The animals used in this study resulted from the fol-lowing crosses: Nelore (NE) cows mated to five Aberdeen Angus (AN) bulls (TA crossbred group, number of progeny (Np= 72), five Canchim (CN) bulls (RC crossbred group, Np= 74), four Simmental (SI) bulls (TS crossbred group, Np= 65) and two Nelore (NE) bulls (NI crossbred group, Np= 44), totaling 256 progeny. Offspring belonging to the TA, RC and TS genetic groups were born in 1998 and 1999 while NI offspring were born in 1999 only. The Nelore cows used in the crosses were from several farms and repre-sented a sample of the Brazilian herd. The same cows were used in both reproductive periods (except for some replace-ments) and their ages at calving ranging from 3.4 to 17.6 years (average 6.6 years). Cows grazed on fertilized
Brachiaria brizanthapastures and received supplementary
sugarcane during the winter. Calves received a concentrate ration limited to 1.5 kg per day and were weaned between 5 and 8 months of age. After weaning the calves grazed
fertil-izedCynodon dactylon(coastcross) grass during the
rain-ing season, supplemented with 3 kg concentrate per day plus a complete mineral mixture or with only a complete mineral mixture. During the dry season, twelve-month old males were divided into two blocks according to body weight and fed in feedlot while heifers grazed on fertilized
Cynodon dactylonand received sugarcane and concentrate
as a supplement.
The restriction fragment length polymorphisms (RFLPs) used were as follows: κ-casein (LGB)-HinfI
(35.5 cM onBos tauruschromosome 6 - BTA 6) (Medrano
and Cordova, 1990);β-lactoglobulin (LGB) -HaeIII (108.7 on BTA 11) (Ronet al., 1994); growth hormone (GH)-AluI
(65.7 cM on BTA19) (Lucy et al., 1993); and the
microsatellitesBM8246(76.2 cM on BTA 1) (Stoneet al., 1995), BM1224(51.2 cM on BTA4) (Bishopet al., 1994),
BM1329(35.5 cM on BTA 6),BM7160(0 cM on BTA 7),
BM6026(6.7 cM on BTA 5),CSFM50(23.0 cM on BTA 2)
(Barendseet al., 1997) andTEXAN15(77.2 cM on BTA 5) (Burns et al., 1995). Except for BM6026,TEXAN15,
BM1329andCSN3all the markers were on different
chro-mosomes.
Statistical analysis
Allele frequencies were obtained by direct counting (Weir, 1996) and heterozygosity measured as the mean standard heterozygosity (Hs) calculated over all loci (Weir,
1996) and the individual heterozygosity (Hi), estimated as
the proportion of heterozygote loci over the ten loci in an individual animal (Mitton and Pierce, 1980). Since there was evidence for at least one null allele at theBM1224
lo-cus segregating in the Nelore population (Tambascoet al., 2000), segregation analysis was employed to detect whether homozygotes should or should not be considered heterozygotic for the null allele. The increase in heterozygosity (Cepicaet al., 1995) of the progeny in rela-tion to the mean heterozygosity of the two parental popula-tions (∆Hs) or individuals (∆Hi) were calculated as ∆H% = (HF1-HP) x 100/HP, whereHF1is either theHsor
the mean ofHiin the progeny of a given cross andHPis the
arithmetic mean ofHsor Hiof the parental populations.
Nei’s standard genetic distance (Nei, 1972), based on allele frequencies estimated from 50 unrelated animals of each breed (Vasconcelloset al., In press), was used to determine
the genetic distances between breeds (Ds). The genetic
dis-tance between individuals was calculated using the method developed by Bowcocket al. (1994) and Ciampoliniet al.
(1995) based on pair wise inter-individual comparisons re-sulting in a multilocus genetic similarity value complemen-tary to the multilocus genetic distance (Dm). TheHiandDm
parameters allowed the correlation of each individual heterozygosity and genetic distance value with the corre-sponding phenotypic measure. These measures were: birth weight (BW); weaning weight (WW); twelve subsequent weight measurements from 230 days (W1) to about 580 days (W12); body weight at first calving (W1C) and estrus (W1E); and the carcass traits hot carcass weight (HCW), backfat thickness (RFT),longissimusrib eye area (REA)
and carcass yield (CY). For both sexes, heterozygosity ef-fects on body weight (BW, WW and W1 to W12) were ana-lyzed using the SAS (Statistical Analysis System) program (Carry, 2000) and the GLM (General Linear Models) pro-cedure using the statistical modelYijklmn=µ+GGi+Sj+Tk
+Al+YBm+b(Hi) +eijklmn, where yijklmnrepresents the trait
evaluated on theijklmnthanimal;µis the overall mean for each trait;GGi,Sj,Tk,Al, andYbmare classificatory fixed
ef-fects associated with theithgenetic group, thejthsex, thekth
nutritional treatment, thelthage and themthyear of birth;b
heterozygosityHi; andeijklmnois the random error associated
with theijklmnthobservation. The same model was used to
assess the influence of multilocus genetic distance. For reproductive traits (W1C and W1E), the GLM procedure used a model comprising all the effects de-scribed above with the exception of the sex effect. Carcass composition traits were analyzed considering genetic group, nutritional treatment, year of birth and feedlot block with the heterozygosity or multilocus genetic similarity as sources of variation. Pearson correlation coefficients were calculated for the∆Hs,∆Hi,DsandDmvariables using the
CORR procedure of the SAS program (SAS, 2001).
Results
Heterozygosity and genetic distance
Segregation analysis revealed the presence of null al-leles for theBM1224microsatellite in the Nelore females
and this had to be taken into account when calculating the heterozygosity, the individual heterozygosity (Hi) ranging
from 0.2 to 0.9 and the multilocus genetic distance (Dm)
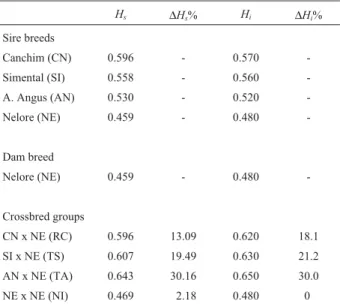
values from 0.2 to 0.7. The mean standard heterozygosity (Hs) andHialong with the increase in these values in the
crosses (∆Hiand∆Hs) are presented in Table 1.
The Pearson correlation analysis of the relationship between the genetic distances of the parental breeds (Dm, Ds) and the increase in heterozygosity (∆Hs,∆Hi)of their
crosses is summarized in Table 2. Despite their high values the correlation coefficients between the multilocus genetic distance (Dm) and∆Hs and ∆Hiwere not significant,
al-though high correlation values were detected between the genetic distances between breeds (Ds) and ∆Hs and ∆Hi
(p < 0.05). These results were to be expected because the correlation between∆Hsand∆Hiwas 0.97 (p < 0.05). No
correlation was found between theDmandDsgenetic
dis-tances.
Effect of individual heterozygosity and multilocus genetic distance on phenotypic traits.
TheHidata comprised only animals known to be
het-erozygotes or homozygotes as confirmed by segregation analysis. Results of the ANOVA for the various weight measures and carcass composition traits are summarized in Tables 3, 4 and 5. With the exception of body weight (BW) and carcass yield (CY), significant genetic group effects (p < 0.01) were verified for all traits but this was to be ex-pected because the four sire breeds used in the crosses are different in body size and weight. At each phenotypic mea-sure both the age and sex of the animal significantly af-fected all weights except for BW (p < 0.01). When included in the analysis, nutritional supplementation had a signifi-cant effect (p < 0.01) on all characteristics except for body weight at first calving (W1C) and carcass composition traits. A birth year effect was observed for most traits
ex-cept BW, W1, W12, W1C, backfat thickness (RFT),
longissimusrib eye area (REA) and carcass yield (CY).
At about 15 to 18 monthsHihad a significant effect
(p < 0.05) on BW, W10, W11 and W12, but it should be noted that at these ages the sample was composed mainly of heifers because bulls were gradually slaughtered for car-cass composition analysis during the experiment and this is also the reason why the number of phenotypic measure-ments declined during the course of the study. Despite this, the fitness model (R2) for these traits was high (0.77 to 0.85). TheHiregression coefficient for BW, W10, W11 and
W12 indicated that each heterozygote locus in the 10 ana-lyzed contributed with an increase of 0.437 kg for BW, 4.42 kg for W10, 4.22 kg for W11 and 4.53 kg for W12, as calcu-lated from the regression analysis. For carcass composition traits,Hishowed a significant effect on hot carcass weight
(HCW) and REA (p < 0.05), with the regression coefficient indicating an increase of 63 g for HCW and 1.89 cm2for REA for each heterozygote locus.
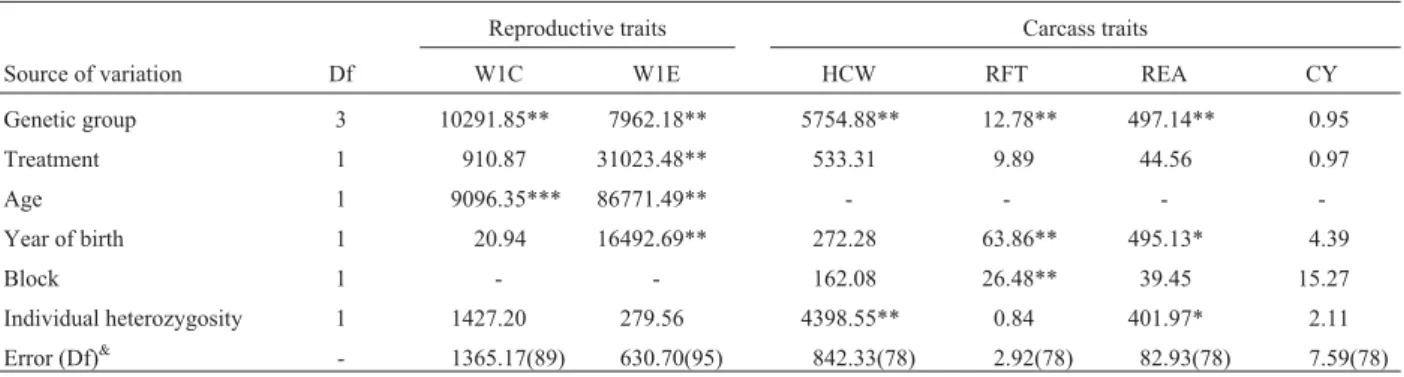
Although both genetic group and age significantly af-fected weight at estrus W1E and W1C (p < 0.05) these
re-Table 1- Standard (Hs) and individual (Hi) heterozygosity for all the
genetic groups and the increase in percentage for these parameters (∆Hi%, ∆Hs%) in the progeny compared with the mean of the two parental populations.
Hs ∆Hs% Hi ∆Hi%
Sire breeds
Canchim (CN) 0.596 - 0.570
-Simental (SI) 0.558 - 0.560 -A. Angus (AN) 0.530 - 0.520
-Nelore (NE) 0.459 - 0.480
-Dam breed
Nelore (NE) 0.459 - 0.480
-Crossbred groups
CN x NE (RC) 0.596 13.09 0.620 18.1 SI x NE (TS) 0.607 19.49 0.630 21.2 AN x NE (TA) 0.643 30.16 0.650 30.0 NE x NE (NI) 0.469 2.18 0.480 0
Table 2- Pearson correlation coefficients among the multilocus genetic
distance (Dm), Nei’s standard genetic distance (Ds), the increase in individual and standard heterozygosities of the crosses (∆Hi,∆Hs).
Dm Ds ∆Hs ∆Hi
Dm
-Ds 0.85
-∆Hs 0.84 0.95*
-∆Hi 0.94 0.96* 0.97*
productive characteristics were unaffected by Hi or Dm.
Multilocus genetic distance (Dm) did not affect any of the
traits examined.
Discussion
Two different measures of genetic diversity were used, the standard heterozygosity (Hs) representing the
fre-quency of heterozygotes observed in one population or sample over all loci analyzed (Weir, 1996) and the individ-ual heterozygosity (Hi) as estimated by the proportion of
heterozygote loci over the ten loci analyzed (an individual measure). The Nelore breed showed the lowestHsandHi
genetic diversity of the parental breeds, possibly related to the small number of founder animals in the Brazilian herd,
Table 3- Summary of analysis of variance (ANOVA) for birth weight (BW), weaning weight (WW) and the five subsequent weights (W1, W2, W3, W4
and W5).
Mean square
Source of variation Df BW WW W1 W2 W3 W4 W5
Genetic group 3 36.97 9143.80** 10255.28** 12027.67** 12797.04** 14858.48** 17068.57** Sex 1 19.14 11342.96** 38.07** 26472.97** 35353.96** 36930.88** 50414.98** Nutritional treatment 1 - - - 8469.03** 35404.41** 72417.67** 109171.80** Age 1 - 69214.99** 84872.36** 73099.23** 100673.77** 120009.39** 112348.48** Year of birth 1 19.81 10298.91** 38.08 4503.75** 25031.80** 36199.98** 74025.34** Individual heterozygosity 1 71.08* 83.01 684.84 734.21 43.51 20.99 3.60 Error (Df)& - 14.80 (236) 458.67 (228) 427.71 (210) 407.08 (209) 436.29 (207) 488.01(207) 617.12(204)
&Degrees of freedom. *p < 0.05. **p < 0.01.
Table 4- Summary of analysis of variance (ANOVA) for weights W6, W7, W8, W9, W10, W11 and W12.
Mean square
Source of variation Df W6 W7 W8 W9 W10 W11 W12
Genetic group 3 20441.18** 24594.55** 26536.19** 31331.68** 18265.84** 16009.52** 18160.82** Sex 1 146717.43** 281891.84** 580376.73** 718789.31** 320447.77** 294161.66** 61937.16** Nutritional treatment 1 99783.93** 89449.63** 57271.79** 32020.80** 30011.20** 23273.44** 21170.66** Age 1 93915.05** 105659.95** 102313.28** 80632.71** 47035.22** 28299.83** 21498.17** Year of birth 1 36934.81** 30912.89** 27303.24** 3520.40* 2736.13 11452.53** 777.08 Individual heterozygosity 1 167.92 356.51 1534.70 2534.19 3741.26* 3119.85* 3107.84* Error (Df)& - 777.47 (180) 852.99 (180) 957.56 (177) 833.43 (162) 739.62 (119) 674.76 (110) 620.74 (98)
&Degrees of freedom. *p < 0.05. **p < 0.01.
Table 5- Summary of analysis of variance (ANOVA) for weight at first calving (W1C), weight at first estrum (W1E), hot carcass weight (HCW), backfat
thickness (RFT),longissimusrib eye area (REA) and carcass yield (CY).
Reproductive traits Carcass traits
Source of variation Df W1C W1E HCW RFT REA CY
Genetic group 3 10291.85** 7962.18** 5754.88** 12.78** 497.14** 0.95
Treatment 1 910.87 31023.48** 533.31 9.89 44.56 0.97
Age 1 9096.35*** 86771.49** - - -
-Year of birth 1 20.94 16492.69** 272.28 63.86** 495.13* 4.39
Block 1 - - 162.08 26.48** 39.45 15.27
Individual heterozygosity 1 1427.20 279.56 4398.55** 0.84 401.97* 2.11 Error (Df)& - 1365.17(89) 630.70(95) 842.33(78) 2.92(78) 82.93(78) 7.59(78) &Degrees of freedom.
whereas the highestHsandHigenetic diversity was
ob-served with the Canchim breed, probably because this is a composite breed consisting of 5/8 Charolais plus 3/8 Zebu. Despite the infrequent use ofHi, the high correlation value
between∆Hsand∆Hiindicates that the individual
hetero-zygosity (Hi) is a suitable measure of genetic diversity.
We used two methods to calculate the genetic dis-tance between the breeds, Nei’s standard genetic disdis-tance (Ds; Nei, 1972) which is widely used in the literature and
takes into account evolutionary forces, and the multilocus genetic distance (Dm; complementary to the multilocus
ge-netic similarity) which is based on pair wise inter-individual comparisons (Bowcocket al., 1994; Ciampolini
et al., 1995) and which dispenses with the need to calculate
previous allele frequencies and thus allows the assessment of the genetic distance between individuals of the same breed. Ciampoliniet al. (1995) used 17 microsatellites to
analyze the inter and intrapopulation genetic variability of four Italian cattle breeds and confirmed the utility ofDmand
its agreement with classical genetic distances but we did not find the same agreement in our study because although the Pearson’s correlation coefficient was high it was not significant. To increase the sensitivity of the method and enable a better estimate the number of loci examined should be as high as possible. In our study theHiandDm
pa-rameters were chosen to investigate the effects of heterozygosity and genetic distance on production traits since these parameters allow for regression analysis for in-dividual animals. This approach was considered better than working with the average values for these parameters in the populations studied.
Previous studies have investigated the relationship between production traits, parental genetic distance and heterozygosity, and it is accepted that such relationships are related to heterosis, with several reports suggesting a strong correlation between molecular-marker heterozygosity and hybrid performance (Garton et al., 1984; Stuber et al., 1992; Xiaoet al., 1995) although, according to Zhanget al.
(1996), this relationship can be variable depending on the genetic material in question and the complexity of the ge-netic basis of heterosis. Numerous reports of both positive and negative correlations between heterozygosity and fit-ness-related traits have been published for many different organisms. Pierce and Mitton (1982), for example, ob-served significant and positive correlations between indi-vidual heterozygosity and the size of tiger salamanders while Smithet al. (1990) suggested that it was possible to use genetic distance to predict combinations of maize lin-eages that would result in high grain-yields, although Melchingeret al. (1990) found that in maize the
correla-tions were two small to be of predictive value. Cepicaet al. (1995) found a high correlation between increased heterozygosity in pig crosses and the genetic distance be-tween the parental lines while Gregoryet al. (1994)
demon-strated that in beef cattle crossbreeding systems the
retention of heterosis was approximately proportional to the expected retention of heterozygosity for most traits.
The molecular basis of heterosis could be related to overdominance or dominance events. If overdominance was the cause the superior performance of heterozygotes could be described as a manifestation of physiological dif-ferences between heterozygotes and parental homozygotes which cause variations in their metabolic rates (Trehan and Gill, 1987). The correlation between heterozygosity and phenotype can not arise from single-locus dominance be-cause homozygotes for the dominant allele would share the same phenotype as heterozygotes (Deng and Fu, 1998). If multiple-loci were involved a correlation might exist be-cause it is unusual to have two parental lines homozygotes for alternate alleles at eachlocus, with one line harboring all the dominant alleles and the other harboring all the re-cessive alleles.
In a simulation study using natural populations, Mitton and Pierce (1980) found that the estimation of indi-vidual heterozygosity obtained from as few as a dozen ran-domly chosen loci may reflect the heterozygosity determined by 100 independent loci, while Cepicaet al.
(1995) found that in polymorphic systems a smaller num-ber of polymorphic loci would be sufficient to detect differ-ences in heterozygosities between populations.
Body weight traits can be considered as essentially additive traits since they usually have high heritability and low heterosis resulting from crosses. However, growth at different ages may be the result of the action of different genes that could differ in average gene action, which could account for the fact thatHiwas significant during only one
growth period (W10-W12). In marine bivalves, Davidet al.
(1995) found that there was a significant positive correla-tion between heterozygosity and the rate of weight gain in the first half of the growth curve but no correlation with ma-ture weight. While Cheverud (2002), investigating quanti-tative trait loci affecting growth in mice, found that variability in different growth periods and physiological status are controlled by independent sets of genes. In our study, the positive and significantHieffect on hot carcass
weight (HCW) and longissimus rib eye area (REA) sup-ports the result obtained for live weight because live weight affects carcass weight. To assess whether the effect ofHion
REA was related to carcass weight we corrected REA to ac-count for carcass weight (REA/HCW) and when this was done the effects ofHion REA did not remain, indicating
thatHiaffected total growth and not just REA. Similar
limited number of loci and it is hard to predict what the re-sults would be if more markers had been used.
Our results suggest that heterozygosity at a limited number of polymorphic markers may affect live weight in at least one growth period. Whether this is an effect of gen-eral heterozygosity or the effect of heterozygosity at spe-cific loci is still unclear since at least one direct effect has been detected for the analyzed loci (Tambascoet al., 2003).
TheHiparameter has shown to be a powerful tool for
re-gression analysis and previous and present work points to the possibility of pre-selecting individuals for commercial crosses according to their heterozygosity. Also, despite the fact that multilocus genetic distance (Dm) was not
signifi-cant the hypothesis of its positive correlation with growth related traits should be investigated using a larger number of animals (increased sample size) and a greater number of markers. Moreover, our study also indicates that the genetic distance between parents is positively correlated with in-creased heterozygosity in the progeny and could be used, as in the present crosses, as a predictive measure for hetero-zygosity.
Acknowledgments
The authors wish to thank the Brazilian agencies FAPESP and CNPq financial support.
References
Barendse W, Vaiman D, Kemp SJ, Sugimoto Y, Armitage SM, Williams JL, Sun HS, Eggen A, Agaba M, Aleyasin SA, Band M, Bishop MD, Buitkamp J, Byrne K, Collins F, Coo-per L, Coppettiers W, Denys B, Drinkwater RD, Easterday K, Elduque C, Ennis S, Erhardt G, Ferretti L, Flavin N, Gao Q, Georges M, Gurung R, Harlizius B, Hawkins G, Hetzel J, Hirano T, Hulme D, Jorgensen C, Kessler M, Kirkpatrick BW, Konfortov B, Kostia S, Kuhn C, Lenstra JA, Leveziel H, Lewin HA, Leyhe B, Lil L, Martin Burriel I, McGraw RA, Miller JR, Moody DE, Moore SS, Nakane S, Nijman IJ, Olsaker I, Pomp D, Rando A, Ron M, Shalom A, Teale AJ, Thieven U, Urquhart BGD, Vage D-I, Van De Weghe A, Varvio S, Velmala S, Vilkki J, Weikard R, Woodside C, Womack JE, Zanotti M and Zaragoza P (1997) A me-dium-density genetic linkage map of the bovine genome. Mamm Genome 8:29-36.
Bishop MD, Kappes SM, Keele JW, Stone RT, Sunden SLF, Hawkins GA, Solinas Toldo S, Fries R, Grosz MD, Yoo J and Beattie CW (1994) A genetic linkage map for cattle. Ge-netics 136:619-639.
Bowcock AM, Ruiz-Linares A, Tomfohrde J, Minch E, Kidd JR and Cavalli-Sforza LL (1994) High resolution of human evolutionary trees with polymorphic microsatellites. Nature 368:455-457.
Burns BM, Taylor JF, Herring AD, Holder MT, Collins JS, Guerra TM and Sanders JO (1995) Bovine microsatellite dinucleotide repeat polymorphisms at the TEXAN11, TEXAN12, TEXAN13, TEXAN14 AND TEXAN15 loci. Anim Genet 26:201-202.
Cepica S, Wolf J, Hojny J, Vacková I and Schroffel Jr J (1995) Re-lations between genetic distance of parental pig breeds and heterozygosity of their F1 crosses measured by genetic
markers. Anim Genet 26:135-140.
Charcosset A, Lefort BM and Gallais A (1991) Relationship be-tween heterosis and heterozygosity at marker loci: A theo-retical computation. Theor Appl Genet 81:571-575. Cheverud JM (2002) Quantitative trait loci affecting postnatal
growth in mice. 7thWorld Congress on Genetics Applied to
Livestock production, Montpellier, France.
Ciampolini R, Moazami-Goudarzi K, Vaiman D, Dillmann C, Mazzanti E, Fouley J-L, Leveziel H and Cianci, D (1995) In-dividual multilocus genotypes using microsatellite polymorphisms to permit the analysis of the genetic vari-ability within and between Italian beef cattle breeds. J Anim Sci 73:3259-3268.
David P, Delay B, Berthou P and Jarne P (1995) Alternative mod-els for allozyme-associated heterosis in the marine bivalve Spisula ovalis. Genetics 139:1719-1726.
Deng H-W and Fu Y-X (1998) Conditions for positive and nega-tive correlations between fitness and heterozygosity in equi-librium populations. Genetics 148:1333-1340.
Eggleston-Stott ML, Delvalle A, Dileanis S, Wictum E and Bowling AT (1997) A single base transversion on the flank-ing region of an equine microsatellite locus affects amplifi-cation of one allele. Anim Genet 28:438-440.
Garton DW, Koehn RK and Scott TM (1984) Multiple-locus heterozygosity and the physiological energetics of growth in the coot clam,Mulinia lateralis, from a natural population.
Genetics 108:445-455.
Lucy MC, Hauser SD, Eppard PJ, Krivi GG, Clark JH, Bauman DE and Collier RJ (1993) Variants of somatotropin in cattle: Gene frequencies in major dairy breeds and associated milk production. Domest Anim Endocrinol 10:325-333. Medrano JF and Aguilar-Cordova E (1990) Genotyping of bovine
kappa-casein loci following DNA sequence amplification. Biotechnology 8:144-146.
Melchinger AE, Lee M, Lamkey KR, Hallauer AR and Woodman WL (1990) Genetic diversity for restriction fragment length polymorphisms and heterosis for two diallel sets of maize inbreds. Theor Appl Genet 80:488-496.
Mitton JB and Pierce BA (1980) The distribution of individual heterozygosity in natural populations. Genetics 95:1043-1054.
Nei M (1972) Genetic Distance Between Population. American Naturalist, New York, 291 pp.
Pierce BA and Mitton JB (1982). Allozyme heterozygosity and growth in the tiger salamander,Ambystoma tigrinum. The J Hered 73:250-253.
Pogson GH and Zouros E (1994) Allozyme and RFLP hetero-zygosities as correlates of growth rate in the scallop
Placopecten magellanicus: A test of the associative
over-dominance hypothesis. Genetics 137:221-231.
Rodriguez S, Visedo G and Zapata C (2001) Detection of errors in dinucleotide repeat typing by nondenaturing electrophore-sis. Electrophoresis 22:2656-2664.
Smith OS, Smith JSC, Bowen SL, Tenborg RA and Wall SJ (1990) Similarities among a group of elite maize inbreds as measured by pedigree, F1grain yield, grain yield, heterosis,
and RFLPs. Theor Appl Genet 80:833-840.
Stone RT, Pulido JC, Duyk GM, Kappes SM, Keele JW and Beat-tie CW (1995) A small-insert bovine genomic library highly enriched for microsatellite repeat sequences. Mamm Ge-nome 6:714-724.
Stuber CW, Lincoln SE, Wolf SE, Helentjaris T and Lander ES (1992) Identification of genetic factors contributing to heterosis in hybrid from two elite maize inbred lines using molecular markers. Genetics 132:823-839.
Tambasco DD, Jorge E, Alencar MM, Coutinho LL, Tambasco MD and Regitano LCA (2000) Evidência de alelo nulo para um loco microssatélite em uma amostra de Nelore. Genet Mol Biol 23 (suppl): 46° Congresso Nacional de Genética, Águas de Lindóia, Brasil.
Tambasco DD, Paz CCP, Tambasco-Studart M, Pereira AP, Alencar MM, Freitas AR, Coutinho LL, Packer IU and Regitano LCA (2003) Candidate genes for growth traits in beef cattle crossesBos taurusxBos indicus. J Anim Breed Genet 120:51-54.
Trehan KS and Gill KS (1987) Subunit interaction: A molecular basis of heterosis. Biochem Genet 25:855-862.
Weir BS (1996) Genetic Data Analysis: Methods for Discrete Population Genetic Data. 2nd edition. Sinauer Associates, Massachusetts, 445 pp.
Xiao J, Li J, Yuan L and Tanksley SD (1995) Dominance is the major genetic basis of heterosis in rice as revealed by QTL analysis using molecular markers. Genetics 140:745-754. Zhang Q, Zhou ZQ, Yang GP, Xu CG, Liu KD and Saghai Maroof
MA (1996) Molecular marker heterozygosity and hybrid performance in indica and japonica rice. Theor Appl Genet 93:1218-1224.
![Linking Genetic Variation in Adaptive Plant Traits to Climate in Tetraploid and Octoploid Basin Wildrye [Leymus cinereus (Scribn. & Merr.) A. Love] in the Western U.S.](data:image/gif;base64,R0lGODlhAQABAIAAAP///wAAACH5BAEAAAAALAAAAAABAAEAAAICRAEAOw==)