Efficiency of IRAP and ITS-RFLP marker systems in accessing genetic
variation of
Pyrenophora graminea
Imad Zein, Mohammed Jawhar and Mohammed Imad Eddin Arabi
Department of Molecular Biology and Microbiology, AECS, Damascus, Syria.
Abstract
The usefulness of IRAP (inter-retrotransposon amplified polymorphism) and ITS-RFLP (restriction of PCR-amplified internal transcribed spacers of the rDNA) markers in the analysis of 39Pyrenophora graminea isolates was deter-mined. Each marker system could discriminate between all of the isolates in detecting polymorphism, albeit with vari-able efficiency. IRAP and ITS-RFLP produced 85% and 77% polymorphic bands, respectively, with a corresponding mean polymorphic information content (PIC) of 0.38 and 0.36. The IRAP marker index ratio (2.41) was higher than ITS-RFLP (1.50). On one hand, the quality nature of data (QND) was higher for ITS-RFLP (0.169) than IRAP (0.093). However, correlation between both marker similarity matrices was significant (r = 0.34, p < 0.05). These findings sug-gest their combined use in phylogenetic analysis. To our knowledge, this is the first report of a comparison involving these two advanced DNA marker systems.
Key words: Pyrenophora graminea, IRAP, internal transcribed spacer, rDNA.
Received: July 30, 2009; Accepted: December 17, 2009.
Pyrenophora graminea [anamorph Drechslera graminea(Rabenh.ex.Schltdl.) Ito], the seed-borne patho-gen responsible for leaf-stripe in barley (Hordeum vulgare
L.), inflicts heavy losses on crops (Porta-Pugliaet al., 1986; Arabiet al., 2004). Several studies on morphological, phys-iological and biochemical aspects have already been under-taken (Zriba and Harrabi, 1995; Jawharet al., 2000).
Traditionally, the classification ofP. graminea iso-lates, besides requiring a certain expertise in taxonomy, may be further complicated by the inherent variation in morphological features among isolates, besides being time consuming, especially in those cases where similar species may be present in one and the same field (Gattiet al., 1992). Over the years, the methods for detecting and assess-ing genetic diversity have extended from the analysis of discrete morphological traits to those of biochemical and molecular origin. Two classes of molecular markers which have received much attention in recent studies on genetic diversity in natural populations, are inter-retrotransposon amplified polymorphism (IRAP) (Kalendar et al., 1999; Pasquali et al., 2007), and restriction fragment length polymorphisms (RFLP) of PCR amplified internal tran-scribed spacer (ITS) regions (ITS-RFLP) (Hsiang and Wu 2000; Nilssonet al., 2008). The usefulness of these two markers types extends to resolve genetic variation among species within a genus or among populations (Redeckeret al., 1997; Martin and Rygiewicz 2005; Brancoet al., 2007).
Despite the general interest, it is not clear whether these two markers have comparable power for quantifying differentiation among populations. Thus, it would be of in-terest to determine whether IRAP and ITS-RFLP markers are equally efficient at detecting genetic patterns existent amongP. gramineaisolates. However, differences would suggest that one marker may be more appreciated for de-tecting isolation, which has implications for the use of either type of marker for defining demographically inde-pendent management units (Mortiz, 1994).
The present study aimed to evaluate the usefulness of both markers in assessing and analyzing the nature and ex-tent of genetic diversity among isolates ofP. graminea col-lected from various regions in Syria.
The 39 monosporic isolates ofP. gramineaused in the study were identified, cultivated, and maintained as de-scribed by Arabiet al.(2002, 2004). They were isolated from leaf-stripe infected barley leaves, originating from various regions in Syria, and selected from among 93 iso-lates, according to morphological and physiological criteria (virulence). The isolates were grown separately in 9 cm Petri dishes containing potato dextrose agar (PDA, DIFCO, Detroit, MI. USA), and incubated for 10 days at 21±1 °C in the dark to facilitate mycelia growth.
Genomic DNA was extracted from fungal cultures as previously described (Arabi and Jawhar, 2007).
ITS regions and 5.8S rDNAs were amplified for all the isolates using the ITS1 (5’ TCCGTAGGTGAACCTGCGG 3’) and ITS4 (5’TCCTCCGCTTATTGATATGC 3’) primers designed
www.sbg.org.br
Send correspondence to Mohammed Imad Eddin Arabi. Depart-ment of Molecular Biology and Microbiology, AECS, PO Box 6091 Damascus, Syria. E-mail: [email protected].
by Whiteet al.(1990). The amplification protocol was as described by Arabi and Jawhar (2007). In separate reac-tions, 10mL of PCR reaction were digested for 3 h with six different endonucleases (AluI,EcoR1,BsurI,BamHI,RsaI and HindIII), according to manufacturer’s recommenda-tions (MBI Fermentas, York, UK). DNA fragments were size-fractionated by electrophoresis through 1.5% agarose gels. The sizes were determined by comparison with their molecular weight relative to a DNA ladder (Q.BIOgene).
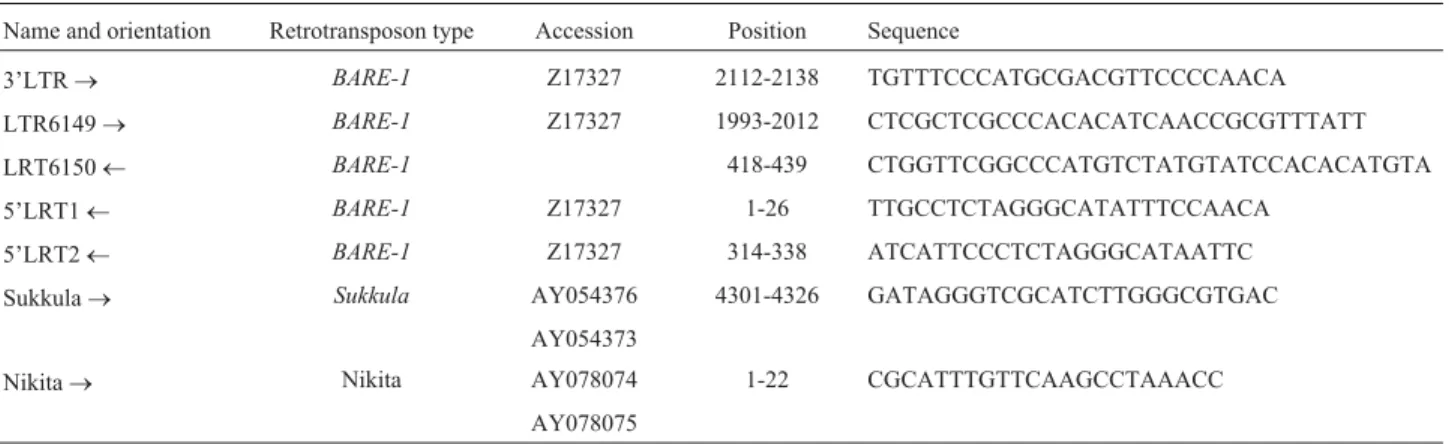
The IRAP method was used for retrotransposon am-plification, as described by Kalendaret al.(1999). Primer sequences, as well as retrotransposon type and orientation are shown in Table 1. PCR was carried out using the method described by Jawhar and Arabi (2009). Amplified products were electrophoresed in a 2% agarose gel using a 1 x Tris-borate-EDTA buffer (100 mM Tris-HCl/L, pH 8.3, 83 boric acid/L, 1 mM EDTA/L) at 100 V. Subsequently, the gels were stained with ethidium bromide solution and visualized under ultraviolet illumination. The sizes of the amplified products were determined as mentioned above.
ITS-RFLP and IRAP banding profiles were scored for the presence (1) or absence (0) of bands. The experi-ments were repeated twice for each isolate and both mark-ers, so as to confirm repeatability and remove mono-morphic bands from the analysis. The data were converted to a Jaccards similarity (Jaccard, 1908) coefficient, which was used to construct a dendrogram by the unweighted pair-group method with arithmetic averages (UPGMA) uti-lising the software package Phylip 3.7 (Felsenstein, 1985). The polymorphism information content (PIC) was calcu-lated for each locus according to Andersonet al. (1993), which provides an estimate of the discriminating power of a locus by taking into account the number of alleles gener-ated by each reaction unit and their frequency distribution in the population. The percent of polymorphic markers (b) was estimated by dividing the number of polymorphic markers by the number of obtained markers. The multiplex ratio (MR) is defined as the number of bands per reaction unit, and the effective multiplex ratio EMR as the product of MR with the fraction of polymorphic markers. Marker
utility (MI) for genetic studies was estimated as a marker index according to Powellet al., (1996) and Milbourneet al.(1997).
As PIC values are equal to gene diversity in binary marker systems, the effective number of alleles per marker was calculated as the respective reciprocal of the PIC value. The Mantel test (Mantel, 1967) was applied to ascertain the significance of correlations between pairwise genetic simi-larities in both marker systems. The probability of calcu-lated correlation was estimated based on 1000 random permutations. These computations were carried out using the Arlequin software package (Excoffieret al., 2005). The quality nature of data (QND) of the marker system and the effective marker index EMI as an overall criterion for the utility of molecular markers were calculated according to Varshneyet al.(2007).
Selected IRAP bands were cut with a surgical blade and purified with a QIAgene gel extraction kit according to manufacturers recommendations. Sequencing was carried out on a Genetic Analyzer (ABI 310, Perkin-Elmer, Ap-plied Biosystems, USA). Each sequence was identified by homology search using the Basic Local Alignment Search Tool (BLAST) program (Altschulet al.1997) against the GenBank nonredundant public sequence database.
PCR amplification with the specific primers ITS1 and ITS4 yielded single DNA fragments present in all isolates with ~ 650 bp in size, which is in agreement with the results obtained by a previous study (Arabi and Jawhar, 2007). Fingerprints generated from the five restriction digestions of the nrDNA ITS region denoted high levels of intra-specific variation within theP. gramineapopulation. A to-tal of 354 scorable DNA bands were scored, 274 of which (77%) being polymorphic, while the number of bands in isolates varied from 3 to 5.
Based on IRAP patterns, 534 bands were obtained, 454 (85%) of which were polymorphic, whereas the num-ber of DNA bands in isolates varied between 4 and 15 (Fig-ure 1). This is sustained by the findings of Taylor et al.
(2004), who found a presence of high copy numbers of
Pyggy-like sequences in theP. gramineagenome by using
Table 1- Primer name, retrotransposon type, position and sequence.
Name and orientation Retrotransposon type Accession Position Sequence
3’LTR® BARE-1 Z17327 2112-2138 TGTTTCCCATGCGACGTTCCCCAACA
LTR6149® BARE-1 Z17327 1993-2012 CTCGCTCGCCCACACATCAACCGCGTTTATT
LRT6150¬ BARE-1 418-439 CTGGTTCGGCCCATGTCTATGTATCCACACATGTA
5’LRT1¬ BARE-1 Z17327 1-26 TTGCCTCTAGGGCATATTTCCAACA
5’LRT2¬ BARE-1 Z17327 314-338 ATCATTCCCTCTAGGGCATAATTC
Sukkula® Sukkula AY054376 4301-4326 GATAGGGTCGCATCTTGGGCGTGAC AY054373
a primer derived from the LTR (long terminal repeat) of the
Pyggyretrotransposon isolated from this fungus. However, the sequence of one IRAP fragment, when using a Sukkula primer, showed similarity 19/27 (70.4%) to the LTR of the
Pyggy retrotransposon (AF533703.1). Similarity began from position 34, as position 4 was a G instead of an A, and position 6 an A instead of a G. Furthermore, bases were missing at positions 13 and 24.
In addition, theP.gramineaLTR sequence and a rice cDNA clone (Accession No. AK058381) were signifi-cantly similar, as attested by 117/147 bp identity (80%). Homology was also evident betweenP.gramineaLTR and an Alternaria alternata LTR (AB025309), with 1556/2096 bp identity (74%). These results indicated the capability of LTR-specific primer to amplify in different target species.
On the other hand, both markers were highly repeat-able, although QND was 0.191 for ITS-RFLP markers and only 0.141 for IRAP. PIC values were 0.376 and 0.355 for IRAP and ITS-RFLP, respectively. Furthermore, IRAP markers generated a substantially higher number of mark-ers (7.80) and a superior marker index (2.41) than ITS-RFLP (Table 2).
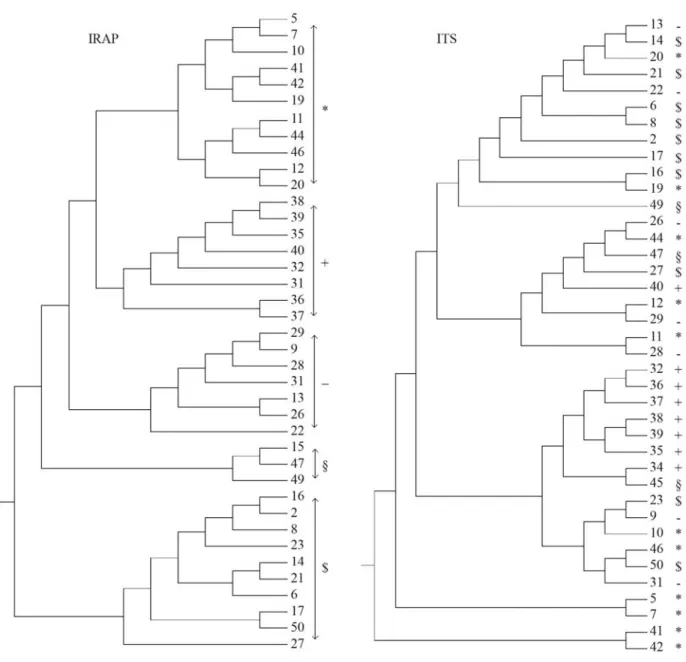
The UPGMA dendrogram generated from IRAP and ITS-RFLP data demonstrated that isolates clustered into five groups for both markers by a similarity index of 0.341 for IRAP and 0.460 for ITS-RFLP (Figure 2). The correla-tion between IRAP and ITS-RFLP similarity matrices was moderate but significant (r= 0.34, p < 0.05).
The usefulness of a molecular marker technique de-pends upon both the polymorphic information content (PIC) of the markers and the number of markers generated by each primer (Varshneyet al., 2007). Even though both IRAP and ITS-RFLP markers exhibited comparable PIC values, owing to the higher number of markers per assay, the MI of IRAP was 2.41 higher than for ITS-RFLP (Ta-ble 2). Bernardeset al.(2007) compared the performance of REMAP, a retrotransposon based maker technique, and ISSR with the fungusMagnaporthe griseaand has found an MI of 1.54 and 4.25, respectively. These marker systems
are similar to IRAP and ITS-RFLP, in that they are PCR-based, anonymous and dominantly inherited. They also de-pend on repeated patterns in the genome to provide anneal-ing sites for universal primers.
The results showed that band quality could have benefited from the additional restriction step following am-plification in the ITS-RFLP protocol, thereby leading to a clearly defined band pattern. The documentation capabili-ties of band information produced by both marker assays in gene bank systems were comparable, as they were equally evaluated. This was placed on par with the widely used AFLP markers (Varshneyet al., 2007), which are far infe-rior to single locus markers such as SSRs or SNPs with unique primers for each locus. On considering both quanti-tative and qualiquanti-tative attributes, IRAP turned out to be su-perior to ITS-RFLP, as depicted by a more effective marker index (0.338 and 0.255, respectively).
Researchers have examined the existence of correla-tions between various molecular marker techniques in
Fusarium oxysporumf. sp.lentis. Belabidet al.(2004) re-ported similar genetic relationships through RAPD and AFLP analysis. In barley, Russellet al.(1997) found that RFLP and AFLP, but not SSR, were correlated. In the pres-ent study, we found significant and moderate correlation between IRAP and ITS-RFLP inP. gramineapathogen ac-cording to the Mantel test, which confirmed in the partially conserved dendrogram topologies inferred from each of the similarity matrices (Figure 2). The moderate correspon-dence between these markers could possibly be attributed Table 2- Estimates of key statistics for evaluating the performance of IRAP and ITS-RFLP markers in 39 isolates ofP. graminea.
Component IRAP ITS
Nr. of assay units 5 (primer comb.) 6 (enzymes) Total nr. of bands 534 354 Polymorphic bands
(per-cent)
454 (85%) 274% (0.774)
Percent polymorphic loci (b)
94% 0.89%
PIC*(min; average; max) 0.139; 0.376; 0.500 0.289; 0.355; 0.500
Nr. of loci PIC > 0.3 27 14 Mean effective allele
num-ber
1.669±0.357 1.639±0.378
Multiplex Ratio (MR) 7.8 4.75 Effective Multiplex Ratio
(EMR)
6.4 4.25
Marker index (MI) 2.41 1.50 Effective Marker Index
(EMI)
0.338 0.255
Gen. simil. (min; average; max)
0.111; 0.341; 0.857 0.118; 0.460; 0.900
Quality nature of data (QND)
0.093 0.169
A
Value considering only polymorphic markers.
to different amplification targets in the P. graminea ge-nome.
To our knowledge this is the first comparative report on the two advanced IRAP and ITS-RFLP genetic marker systems. The present study emphasized that, besides their effective employment, both of these DNA markers may furnish comparable results in assays of genetic differenti-ation amongP. gramineaisolates. Furthermore, due to the specific advantages of each marker, the combination of both marker systems can give us greater confidence that the delineated patterns are real, through drawing on results from multiple genetic systems (Allendorf and Seeb, 2000).
Acknowledgments
The authors wish to thank the Director General of AECS for his support and Dr. N. MirAli the Head of the Biotechnology Department for his critical review of the manuscript.
References
Allendorf FW and Seeb LW (2000) Concordance of genetic diver-gence among sockeye salmon populations at allozyme, nu-clear DNA and mitochondrial DNA. Evolution 54:640-651. Anderson JA, Churchill GA, Autrique JG, Tanksley SD and
Sorells ME (1993) Optimizing parental selection for genetic linkage maps. Genome 36:181-186.
Arabi MIE and Jawhar M (2007) Heterogeneity inPyrenophora
graminea as revealed by ITS-RFLP. J Plant Pathol
89:391-395.
Arabi MIE, MirAli N, Jawhar M and Al-Safadi B (2002) Differen-tiation ofDrechslera gramineaisolates by cultural charac-ters and SDS-PAGE. J Plant Pathol 84:153-156.
Arabi MIE, Jawhar M, Al-Safadi B and MirAli N (2004) Yield re-sponse of barley to leaf stripe (Pyrenophora graminea) un-der experimental conditions in southern Syria.J Phytopathol 152:519-523.
Altschul SF, Madden TL, Schaffer AA, Zhang J, Zhang Z, Miller W and Lipman DJ (1997) Gapped BLAST and PSI-BLAST: A new generation of protein database search programs. Nu-cleic Acids Res 25:3389-3402.
Belabid L, Baum M, Forts Z, Bouznad Z and Eujayl I (2004) Pathogenic and genetic characterization of Algerian isolates ofFusarium oxysporumf. sp.lentisby RAPD and AFLP analyses.Afr J Biotechnol 3:25-31.
Bernardes A, Mistura CC, Carvalho FIF, Oliveira CA, Chadha S and Gopalakrishna T (2007) Comparative assessment of REMAP and ISSR marker assays for genetic polymorphism studies inMagnaporthe grisea. Curr Sci 93:688-692. Branco CJS, Vieira EA, Gaspar-Malone G, Kopp MM and
Malone E (2007) IRAP and REMAP assessments of genetic similarity in rice. J Appl Genet 48:107-113.
Excoffier L, Laval G and Schneider S (2005) Arlequin 3.0: An in-tegrated software package for population genetics data anal-ysis. Evol Bioinfo Online 1:47-50.
Felsenstein J (1985) Confidence limits on phylogenies: An ap-proach using the bootstrap. Evolution 39:783-791. Gatti A, Rizza F, Delogu G, Terzi V, Porta-Puglia A and Vannacci
G (1992) Physiological and biochemical variability in a pop-ulation ofDrechslera graminea. J Genet Breed 46:179-186. Hsiang T and Wu C (2000) Genetic relationships of pathogenic
Typhulaspecies assessed by RAPD, ITS-RFLP and ITS se-quencing. Mycol Res 104:16-22.
Jaccard P (1908) Nouvelles recherches sur la distribution florale. Bull SocVaud Sci Nat 44:223-270.
Jawhar M, Sangawn RS and Arabi MIE (2000) Identification of Drechslera graminea isolates by cultural characters and RAPD analysis. Cereal Res Comm 28:89-93.
Jawhar M and Arabi MIE (2009) Heterogeneity in the internal transcribed spacers of the ribosomal DNA inCochliobolus sativusas revealed by IRAP. J Plant Pathol 91:123-126. Kalendar R, Grob T, Regina M, Suoniem A and Schulman A
(1999) IRAP and REMAP: Two new retrotransposon-based DNA fingerprinting techniques. Theor Appl Genet 98:704-711.
Mantel N (1967) The detection of disease clustering and a gener-alized regression approach. Cancer Res 27:209-220. Martin KJ and Rygiewicz PT (2005) Fungal-specific PCR primers
developed for analysis of the ITS region of environmental DNA extracts. BMC Microbiol 5:21-28.
Milbourne D, Meyer R, Bradshaw JE, Baird E, Bonar N, Provan J, Powell W and Waugh R (1997) Comparison of PCR based marker systems for the analysis of genetic relationships in cultivated potato. Mol Breed 3:127-136.
Mortiz C (1994) Defining “evolutionary significant units” for conservation. Trends Ecol Evol 9:373-376.
Nilsson RH, Kristiansson E, Ryberg M, Hallenberg N and Larsson KH (2008) Intraspecific ITS variability in the king-dom fungi as expressed in the international sequence data-bases and its implications for molecular species identifica-tion. Evol Bioinfo 4:193-201.
Pasquali M, Dematheis F, Gullino ML and Garibaldi A (2007) Identification of race 1 of Fusarium oxysporum f. sp. lactucae on lettuce by inter-retrotransposon sequence-characterized amplified region technique. Phytopathology 97:987-996.
Porta-Puglia A, Delogu G and Vannacci G (1986)Pyrenophora gramineaon winter barley seed: Effect on disease incidence and yield losses. Phytopathology 117:26-33.
Powell W, Morgante M, Andre C, Hanafey M, Vogel J, Tingey SV and Rafalski A (1996) The utility of RFLP, RAPD, AFLP and SSRP (microsatellite) markers for germplasm analysis. Mol Breed 2:225-238.
Redecker D, Thierfelder H, Walker C and Werner D (1997) Re-striction analysis of PCR-amplified internal transcribed spacers of ribosomal DNA as a tool for species identification in different genera of the order Glomales. Appl Envir Microbiol 63:1756-1761.
Russell RJ, Fuller JD, Macaulay M, Hats BG, Jahoor A, Powell W and Waugh R (1997) Direct comparison of levels of genetic variation among barley accessions detected by RFLPs, AFLPs, SSRs and RAPDs. Theor Appl Genet 95:714-722. Taylor EJA, Konstantinova P, Leigh F, Bates JA and Lee D
(2004) Gypsy-like retrotransposons inPyrenopheraspecies: An abundant and informative class of molecular markers. Genome 47:519-525.
Varshney RK, Chabane K, Hendre PS, Aggarwal RK and Graner A (2007) Comparative assessment of EST-SSR, EST-SNP and AFLP markers for evaluation of genetic diversity and conservation of genetic resources using wild, cultivated and elite barleys. Plant Sci 173:638-649.
White TJ, Bruns T, Lee S and Taylor J (1990) Amplification and direct sequencing of fungal ribosomal RNA genes for phylo-genetics. In: Innis MA, Gelfand DH, Sninsky JJ and White TJ (eds), PCR Protocol, a Guide to Methods and Applica-tions. Academic Press, San Diego, pp 315-322.
Zriba W and Harrabi M (1995) Cultural and pathogenic variability inPyrenophora gramineaisolates. Rachis 14:99.
Associate Editor: Everaldo Gonçalves de Barros

![Linking Genetic Variation in Adaptive Plant Traits to Climate in Tetraploid and Octoploid Basin Wildrye [Leymus cinereus (Scribn. & Merr.) A. Love] in the Western U.S.](data:image/gif;base64,R0lGODlhAQABAIAAAP///wAAACH5BAEAAAAALAAAAAABAAEAAAICRAEAOw==)