Alternative parameterizations of relatedness in whole genome association
analysis of pre-weaning traits of Nelore-Angus calves
David G. Riley, Clare A. Gill, Andy D. Herring, Penny K. Riggs, Jason E. Sawyer and James O. Sanders
Department of Animal Science, Texas A&M University, College Station, TX, USA.
Abstract
Gestation length, birth weight, and weaning weight of F2Nelore-Angus calves (n = 737) with designed extensive
full-sibling and half-sibling relatedness were evaluated for association with 34,957 SNP markers. In analyses of birth weight, random relatedness was modeled three ways: 1) none, 2) random animal, pedigree-based relationship ma-trix, or 3) random animal, genomic relationship matrix. Detected birth weight-SNP associations were 1,200, 735, and 31 for those parameterizations respectively; each additional model refinement removed associations that apparently were a result of the built-in stratification by relatedness. Subsequent analyses of gestation length and weaning weight modeled genomic relatedness; there were 40 and 26 trait-marker associations detected for those traits, re-spectively. Birth weight associations were on BTA14 except for a single marker on BTA5. Gestation length associa-tions included 37 SNP on BTA21, 2 on BTA27 and one on BTA3. Weaning weight associaassocia-tions were on BTA14 except for a single marker on BTA10. Twenty-one SNP markers on BTA14 were detected in both birth and weaning weight analyses.
Keywords: birth weight, gestation length, weaning weight, Nelore, whole genome association.
Received: March 7, 2014; Accepted: June 12, 2014.
Introduction
Relatedness within animal data may be modeled in multiple ways ranging from incorporation of some aspect of family as a classification variable to more complex mod-eling of pedigree accomplished through inclusion of the nu-merator relationship matrix in mixed model equations (Henderson, 1963). The availability of dense single nucleo-tide polymorphism arrays for research permits the evalua-tion of genomic relatedness among animals with records based on their marker genotypes. Modeling of genomic re-latedness, rather than average relatedness based on pedi-gree, was considered an important opportunity for genetic prediction (Liuet al., 2002; Visscheret al., 2006; Visscher, 2009), due to the improvement of regression equations through refinement of the covariances in the coefficient matrix that are due to relatedness among animals. Inclusion of genomic relatedness in prediction equations improved estimates of variances, and hence heritability (Thomas, 2005; Visscheret al., 2006; Wolc et al., 2013) and im-proved accuracies of predicted genetic merit (Hayes and Goddard, 2008). These appear to hinge upon the improved marker-trait associations detected with models using re-fined relationship models. Genomic relationship matrices incorporated in mixed model association analyses may be a
better substitute for pedigree-based relationship in marker-QTL association studies (Yu et al., 2006; Zhang et al., 2006, 2007; Shamet al., 2009). There has not been compar-ison of association results using genomic relatedness and pedigree-based relatedness. The objectives of this study were to 1) describe the whole genome SNP-birth weight as-sociations and the consequences of modeling relationship matrices derived either from pedigree or genomic informa-tion or modeling family structure as a fixed effect (per de-sign of the experimental population), and 2) to describe weaning weight- and gestation length-SNP associations us-ing records and genotypes of F2Nelore-Angus calves.
Materials and Methods
Cattle
Calves (n = 737) were produced by embryo transfer at the Texas AgriLife Research Center near McGregor, Texas, USA. These calves were part of 14 Nelore-Angus full-sibling F2families produced by five F1Nelore-Angus sires (all F1parents were Nelore-sired) and 10 F1 Nelore-Angus cows. The five sires were represented by 1, 2, 3, 4, and 4 families, respectively. The average number of calves in each family was 33.8 and ranged from 2 to 69. Calves were spring- and fall-born from the fall of 2003 through spring of 2007. Recipient cows consisted of 229 crossbred
Bos indicus-Bos tauruscows; most had one calf, but a few Send correspondence to David G. Riley. Department of Animal
Sci-ence, Texas A&M University, 77843-2471 College Station, TX, USA. E-mail: [email protected].
had as many as four project calves. Four of those five F1 bulls were mated by natural service to 1/2Bos indicus1/2
Bos tauruscows to produce 4 half-sibling families. Most of the dams of calves in those half-sibling families were F1or F2 Brahman-Hereford; some were Brahman-Angus and Nelore-Angus. All of those calves (n = 264) were spring-born (February to late April) from 2003 through 2007. Calves were identified and weighed as soon as practical af-ter birth, usually within one day. Calves were weaned at an average of 213.8±17.9 d of age. All procedures involving animals were approved by the Texas A&M University In-stitutional Animal Care and Use Committee with multiple animal use protocols from 2002 through the present.
Genotypes
Isolation of DNA was conducted from blood samples as previously described (Rileyet al., 2013). Genotypes for all project animals were obtained from the Infinium BovineSNP50v1 assay (Illumina, Inc., San Diego, CA). There were on average 29,692 informative markers per F2 family (1 informative marker per 101 kb). Loci were ex-cluded from association analyses if 1) genotypes were missing in 10% or more individuals because phasing pro-grams and other software generally perform poorly with higher levels of missing genotypes, 2) minor allele fre-quency was less than or equal to 0.05 because very low mi-nor allele frequencies could be SNP that were segregating in founders but not transmitted to the F1and F2individuals in the context of this experimental design (family struc-ture), or 3) deviation from Hardy-Weinberg equilibrium (p£0.05, exact tests according to Wiggintonet al., 2005). The assay used is known to have approximately a 0.5% er-ror rate (Honget al., 2012); 684 Mendelian errors were de-tected in 181 of the 776 individuals (from 1 to 69 SNP in individuals).
Association analyses included 34,957 markers.
Statistical analyses
Models were built using the MIXED procedures of SAS (SAS Inst., Inc., Cary, NC). Investigated fixed effects included the main and interaction effects of year, season of birth, family, dam age (distinct categories for 2-, 3-, 4-, 5-to 10-yr-olds, and older than 10 yr), and calf gender. Re-gression of weaning weight on calf age in days was investi-gated. Association analyses were conducted using the Q-K procedures (Yuet al., 2006) of JMP Genomics (SAS Inst., Inc., Cary, NC) with fixed effects identified from the pre-liminary analyses and regression of trait on genotypic val-ues, which were coded as 0 for the homozygote of the allele with the highest frequency and 2 assigned to the other homozygote. Heterozygotes were assigned values of 1. The false discovery rate was constrained to 0.05 using method-ology of Benjamini and Hochberg (1995).
The designed relatedness in this project was evalu-ated by conducting association analyses with two random
structures. The genetic covariance among animals in this project was modeled by constructing 1) the relationship matrix based on pedigree, and 2) the genomic relationship matrix based upon genotypes from the Bovine SNP50 us-ing procedures of JMP Genomics. The pedigree-based rela-tionship matrix was constructed with coancestry coeffi-cients for pairs of animals according to methodology described by Falconer and Mackay (1996). There were 2,419 individuals in the pedigree. Elements of the genomic relationship were calculated as an approximation of iden-tity-by-descent by adjusting the probability of identity-by-descent between two individuals with the average prob-ability of identity-by-state between random individuals (Yu
et al., 2006): 1
1
nk IBDijk n
=
å
IBD X p X p
pq
ijk
ik jk
=( -2 ) (´ -2 )
2
wherenindexes genotypes,iandjindex individuals with genotypes; IBDijk is identity-by-descent estimate of the
probability that individualsiandjshare an allele at marker genotypekthat came from the same ancestor at a locus. This probability is estimated without considering pedigree information;Xik = 0, 1, 2, corresponding to genotypes at
markerkin animali; Within a genotype,p(q) is the fre-quency within each genotype of the nucleotide (A, C, G, or T) lower (higher) in the alphabet.
A third analysis was conducted using a completely fixed effects model with no relatedness modeled. For each of those 3 scenarios, additional analyses differed by the in-clusion of family as a fixed effect (18 levels: 14 full-sibling and four half-sibling families). These six analyses were conducted on birth weight (n = 737; mean 35.0 kg; SD 5.73 kg). Subsequently, those results were used to select the model for analysis of gestation length (n = 473; mean 281 days; SD 5.39 days) and weaning weight (n = 699; mean 229.7 kg, SD 30.5 kg). All outliers (those outside the mean ± 4 SD) were excluded from analyses. Quantile-quantile plots were constructed of ranked test statistics (un-adjusted probability values of F ratios for regression of phenotype on coded genotypes) at each SNP (The Wellco-me Trust Case Control Consortium, 2007), and the degree of inflation of the median probability value (l) was calcu-lated (Devlin and Roeder, 1999) as assessment of the ap-propriate removal of the effects of population substructure (Voormanet al., 2011). Values of this parameterlthat are closer to 1 are favorable, and those much larger than 1 may indicate the presence of stratification that could result in spurious association of phenotype with genotype.
re-ported are from the bovine UMD_3.1 build (Ziminet al., 2009).
Results and Discussion
Preliminary analyses indicated that a combination of year and season of birth was an efficient parameterization of these effects (p < 0.001). Cow age was retained in final models for all traits (p < 0.01), and calf gender explained significant birth weight variation. Family was considered important for all traits in these preliminary analyses (p < 0.001).
The first notable effect of refinement of the related-ness modeled was reduction of the number of detected as-sociations (Table 1). Relative to a model that included no relatedness, the number of detected associations was re-duced by over one third in analysis that modeled random animal effects with the inclusion of a pedigree-based rela-tionship matrix. The numbers of detections when employ-ing a genomic relationship matrix were drastically reduced. This implies that the failure to model animal as random re-sulted in that variation inappropriately contained in the marker regression. Smaller values ofl$indicated that addi-tional refinement by employing marker relatedness as op-posed to the average relatedness (with exception of parent-offspring, as that relatedness is exact) based on pedigree best accounted for that variation in the analyses (Figu-res S1, S2, and S3). The variation in pedigree relationships within a population may be much larger than variation within the genomic relationships among pairs with the same pedigree relationship (Hill, 2013).
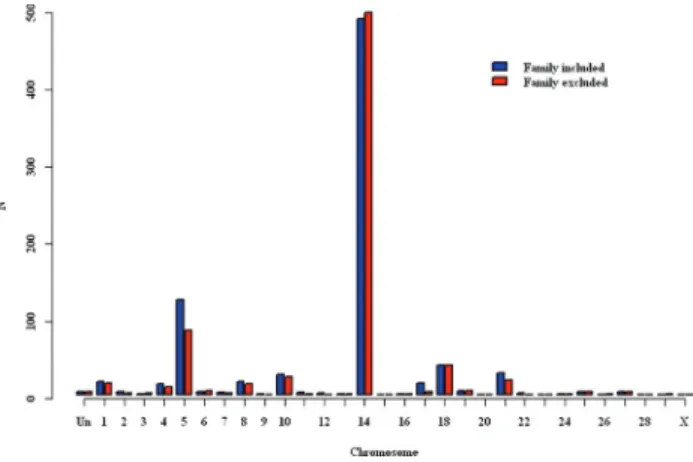
The inclusion of the designed family fixed effect had pronounced influence on the association results. In the fixed effects model (no inclusion of relationship matrix in equations corresponding to random effects), the effect of family appeared to substitute for random structure and cture variation to the extent that this model resulted in ap-proximately the same numbers of detections (Table 1, Figu-re 1) as the mixed model with pedigFigu-ree-based Figu-relatedness
included. The inclusion of family as a fixed effect resulted in additional associations detected in pedigree-based analy-ses and genomic-based analyanaly-ses (Figures 2 and 3) and a slightly larger value forl$ in the pedigree-based analysis. This is likely because family structure is confounded with information provided in the relationship matrix. Also, there must exist non-0 covariances between levels of this effect and the relatedness modeled in these mixed models. These were modeled as 0 in these analyses, and that may also have contributed to the more liberal detections of SNP-birth weight associations.
The majority of SNP loci detected as associated with birth weight in the analyses with a genomic relationship matrix included (28 of 31) were detected in each of the other analyses with different relationship parameterizations (Figure 4) except for the fixed effect model that did not in-clude family effects. The analysis that modeled no related-ness (nor family as a fixed effect) identified a large number of loci (n = 650) that were not detected otherwise.
Zhanget al.(2006) reported high correspondence be-tween relationship matrices constructed using pedigree and
Table 1- Detected SNP-birth weight associations and estimates of the degree of test statistic inflation ($l) in analyses that included different relationship matrices and the inclusion/exclusion of family structure as a fixed effect.
Family
Modeled relatedness Not included Included Overlap
No relationship matrix included
Detected associations 1,200 790 488
$
l 1.48 1.28
Pedigree-based relatedness
Detected associations 735 805 661
$
l 1.24 1.26
Genomic relatedness
Detected associations 31 37 28
$
l 0.99 0.99
molecular information, but reported that the distribution of p values (H0: no association) from a mixed model with rela-tionship matrix based on markers was closer to the ex-pected distribution than those p values produced from mixed models with pedigree-based relationship matrix in-cluded or from a fixed effect model. Incorporating marker-based relationships may increase the power of association tests (Yuet al., 2006). The most recent efforts reported that the use of both pedigree and genomic relationship may be the most appropriate for prediction of breeding values (Aguilaret al., 2010; Goddardet al., 2011; Haile-Mariam
et al., 2013). The appropriate modeling of relatedness was incorporation of the genomic relationship matrix without including family as a fixed effect.
Birth weight
There were 14, 8, and 9 SNP loci detected as associ-ated with birth weight at the p < 0.001, < 0.01, and < 0.05 levels respectively (Table S1); corresponding numbers in
Bos taurusstudies were 35, 91, and 339 (Snellinget al., 2010), and 105, 527, and 2,095 (Luet al., 2013). The ma-jority of detected loci (30 of 31) were from BTA14:16.3 to 28.4 Mb. The proportion of phenotypic variance accounted for by each SNP (singly, that is, not in a multiple regression model) ranged from 0.023 to 0.067. A single locus was de-tected at BTA5:49.5. Most recently, Luet al.(2013) re-ported multiple SNP-birth weight associations on both of these chromosomes. Kneelandet al.(2004) reported QTL for birth weight on BTA6, 19, and 21. Seven associated markers were within the bp limits of theXK, Kell blood group subunit-related family, member 4(XKR4), and an-other was upstream > 25 kb of this gene (Table S1). A sig-nificant association of a SNP within this gene with birth weight was also detected in Nelore cattle (Utsunomiyaet al., 2013); this was one of five total associations detected in that study, as those researchers applied Bonferroni correc-tions to p-values for the 434,020 loci evaluated. Detected marker-subcutaneous rump fat associations were reported for markers in and aroundXKR4 in Brahman and Brah-man-influenced cattle (Bolormaaet al., 2011; Porto Netoet al., 2012), and this was considered a candidate gene based on marker-trait associations for average daily gain, average daily feed intake, and residual feed intake inBos taurus cat-tle (Lindholm-Perryet al., 2012). Chromosome 14 has been consistently identified in association studies as important for growth traits of cattle (e.g., Snelling et al., 2010; Bolormaaet al., 2011; Luet al., 2013); summaries of detec-tions and genes in that region across time were detailed by Wibowoet al.(2008) and Hawkenet al.(2012). Although
pleiomorphic adenoma gene 1(PLAG1) on BTA14 was considered a candidate gene for influencing hip height in cattle (Karimet al., 2011), it was not the closest gene to any SNP with detected association in the present study. The closest gene to the marker with strongest association was
proenkephalin(PENK) on BTA14. This gene was identi-fied as one of 13 found within 500 kb of the SNP most sig-nificantly associated with birth weight in Nelore cattle (Utsunomiyaet al., 2013). Increasing expression ofPENK
in the bovine endometrium concurrent with the progression of pregnancy may indicate that this gene promotes or con-tributes to conceptus elongation (Fordeet al., 2013).
Peterset al.(2012) reported six SNP associated with birth weight in Brangus cattle in the similar region of BTA5. Although it was not the closest feature to the de-tected locus on BTA5 in the present study,signal trans-ducer and activator of transcription 6(STAT6) is in the same region; it has been characterized with respect to SNP associations with various cattle traits (Rincónet al., 2009). Hawkenet al. (2012) detected associations of SNP with body weight in a broad region of BTA5 and provided a good summary of earlier work with detections on that chro-mosome.
Figure 2- Number of detected SNP loci associated with birth weight by chromosome from analyses with modeled pedigree relatedness with and without the fixed effect of family (“Un” represents SNP that were not as-signed to any chromosome).
Gestation length
Almost all (37 of 40) of the markers associated with gestation length were on BTA21 (Figure 5; Table S2), as well as one marker on BTA3 and two on BTA27. The esti-mate of the degree of inflation of the median probability value (l$) was 0.98 and the quantile-quantile plot ofc2
sta-tistics and p-values is in the supplementary information (Figure S4). These did not overlap with most markers pre-viously detected as associated with gestation length (Mal-teccaet al., 2009; 2011) in dairy cattle, although Maltecca
et al.(2011) identified 6 SNP on BTA3. Some SNP in im-printed domain regions on BTA13 were associated with calving difficulty and gestation length of dairy cows (Siko-raet al., 2011). A similar region was identified on BTA21 (beginning at BTA21:68.1 Mb; Mageeet al., 2010) includ-ing delta-like 1 homolog DLK1 and deiodinase, iodothyronine, type III(DIO3); this region was associated with various traits in dairy cattle, including gestation length (Mageeet al., 2011). The closest two associated markers in the present study were approximately 30 Mb upstream of this region. Eighteen associated markers were within the bp boundaries of eight genes and four pseudogenes (Table S2).
Weaning weight
All but one of the 26 detected SNP-weaning weight associations (Figure 6; Table S3) were on BTA14. The quantile-quantile plot ofc2
statistics and p-values is in the supplementary information (Figure S4);l$was 0.99. Most of those (n = 21) were also detected as associated with birth weight; this result supported the conclusions of Snellinget al.(2010), that is, genomic regions responsible for varia-tion in both traits were largely the same and that using genomic information to select for growth in one phase while limiting or minimizing growth in another phase would be difficult. A single locus at BTA10:26.6 Mb was detected as associated with weaning weight. Lu et al.
(2013) detected associations with weaning weight on these chromosomes (plus others) in similar regions. Snellinget al.(2010) detected associations of the direct component of weaning weight with SNP on BTA10 and BTA14, but pri-marily on BTA6; they detected maternal components of weaning weight associated with SNP on the chromosomes detected in the present study. It should be noted that these mentioned represent a small subset of the overall detections from Snellinget al.(2010) that spanned essentially all
mosomes. Peterset al.(2012) reported a window of SNP associated with 205-d weight in Brangus heifers on BTA10. Fifteen of the SNP with detected association with weaning weight were located within physical boundaries of eight genes and one pseudogene (Table S3).
Conclusions and Implications
In mixed model association analyses, marker-based relationship appeared to best capture trait variance corre-sponding to relatedness. In the absence of either a relation-ship matrix based on marker genotypes or pedigree, the fixed effect of family appeared to assume that role, but to a
lesser extent. Detected associations increased when more primitive parameterizations of relatedness (or no related-ness) were employed, apparently because of stratification. Inclusion of family as a fixed effect in addition to either re-lationship matrix also resulted in increased associations de-tected, either due to duplicative modeling of relatedness or due to inappropriate assumption of non-zero covariance be-tween fixed effect levels and random effect levels. Detected associations with birth weight and weaning weight were primarily on BTA14 and consistent with other reports. The strongest association for birth weight was for a marker within PENK, which has been identified as expressed in
Figure 5- Gestation length-SNP marker associations by significance (-log[FDR] = 1.3 at the horizontal line) and chromosome.
placenta. Detected associations with gestation length were primarily on BTA21.
Acknowledgments
This project was supported by National Research Ini-tiative Competitive Grant no. 2008-35205-18767 from the USDA National Institute of Food and Agriculture. Appre-ciation is noted for B. D. Johnson, D. A. Gann, and all per-sonnel at the Texas A&M AgriLife Research Center at McGregor.
References
Aguilar I, Misztal I, Johnson DL, Legarra A, Tsuruta S and Lawlor TJ (2010) A unified approach to utilize phenotypic, full pedigree, and genomic information for genetic evalua-tion of Holstein final score. J Dairy Sci 93:743-752. Benjamini Y and Hochberg Y (1995) Controlling the false
discov-ery rate: A practical and powerful approach to multiple test-ing. J Royal Stat Soc B 57:289-300.
Bolormaa S, Porto Neto LR, Zhang YD, Bunch RJ, Harrison BE, Goddard ME and Barendse W (2011) A genome-wide asso-ciation study of meat and carcass traits in Australian cattle. J Anim Sci 89:2297-2309.
Devlin B and Roeder K (1999) Genomic control for association studies. Biometrics 55:997-1004.
Falconer DS and Mackay, TFC (1996) Introduction to Quantita-tive Genetics. 4thedition. Pearson Educ. Ltd., Essex, 480 pp. Forde N, Mehta JP, McGettigan PA, Mamo S, Bazer FW, Spencer
TE and Lonergan P (2013) Alterations in expression of endometrial genes coding for proteins secreted into the uter-ine lumen during conceptus elongation in cattle. BMC Genomics 14:e321.
Goddard ME, Hayes BJ and Meuwissen THE (2011) Using the genomic relationship matrix to predict the accuracy of geno-mic selection. J Anim Breed Genet 128:409-421.
Haile-Mariam M, Nieuwhof GJ, Beard KT, Konstatinov KV and Hayes BJ (2013) Comparison of heritabilities of dairy traits in Australian Holstein-Friesian cattle from genomic and pedigree data and implications for genomic evaluations. J Anim Breed Genet 130:20-31.
Hanna LLH and Riley DG (2014) Mapping genomic markers to closest feature using the R package Map2NCBI. Livest Sci 162:59-65.
Hawken RJ, Zhang YD, Fortes MRS, Collis E, Barris WC, Corbet NJ, Williams PJ, Fordyce G, Holroyd RG, Walkley JRW,et al.(2012) Genome-wide association studies of female re-production in tropically adapted cattle. J Anim Sci 90:1398-1410.
Hayes BJ and Goddard ME (2008) Prediction of breeding values using marker-derived relationship matrices. J Anim Sci 86:2089-2091.
Henderson CR (1963) Selection index and expected genetic ad-vance. In: Statistical Genetics and Plant Breeding. Nat Acad Sci National Research Council, Publ. No. 982, Washington, DC, pp 141-163.
Hill WG (2013) On estimation of genetic variance within families using genome-wide identity-by-descent sharing. Genet Sel Evol 45:32.
Hong H, Xu L, Liu J, Jones WD, Su Z, Ning B, Perkins R, Ge W, Miclaus K, Zhang L,et al.(2012) Technical reproducibility of genotyping SNP arrays used in genome-wide association studies. PLoS One 7:e44483.
Karim L, Takeda H, Lin L, Druet T, Arias JAC, Baurain D, Cambisano N, Davis SR, Farnir F, Grisart B,et al.(2011) Variants modulating the expression of a chomrosome do-main encompassingPLAG1 influence bovine stature. Nat Genet 43:405-413.
Kneeland J, Li C, Basarab J, Snelling WM, Benkel B, Murdoch B, Hansen C and Moore SS (2004) Identification and fine map-ping of quantitative trait loci for growth traits on bovine chromosomes 2, 6, 14, 19, 21, and 23 within one commercial line ofBos taurus. J Anim Sci 82:3405-3414.
Lindholm-Perry AK, Kuehn LA, Smith TPL, Ferrell CL, Jenkins TG, Freetly HC and Snelling WM (2012) A region on BTA14 that includes the positional candidate genes LYPLA1, XKR4andTMEM68is associated with feed intake and growth phenotypes in cattle. Anim Genet 43:216-219. Liu Y, Jansen GB and Lin CY (2002) The covariance between
rel-atives conditional on genetic markers. Gen Sel Evol 34:657-678.
Lu D, Miller S, Sargolzaei M, Kelly M, Vander Voot G, Caldwell T, Plastow G and Moore S (2013) Genome-wide association analyses for growth and feed efficiency traits in beef cattle. J Anim Sci 91:3612-3633.
Magee DA, Berry DP, Berkowicz EW, Sikora KM, Howard DJ, Mullen MP, Evans RD, Spillane C and MacHugh DE (2011) Single nucleotide polymorphisms within the bovine DKLI-DIO3imprinted domain are associated with economically important production traits in cattle. J Hered 102:94-101. Magee DA, Sikora KM, Berkowicz EW, Berry DP, Howard DJ,
Mullen MP, Evans RD, Spillane C and MacHugh DE (2010) DNA sequence polymorphisms in a panel of eight candidate bovine imprinted genes and their association with perfor-mance traits in Irish Holstein-Friesian cattle. BMC Genet 11:e93.
Maltecca C, Weigel KA, Khatib H, Cowan M and Bagnato A (2009) Whole-genome scan for quantitative trait loci associ-ated with birth weight, gestation length and passive immune transfer in a Holstein x Jersey crossbred population. Anim Genet 40:27-34.
Maltecca C, Gray KA, Weigel KA, Cassady JP and Ashwell M (2011) A genome-wide association study of direct gestation length in US Holstein and Italian Brown populations. Anim Genet 42:585-591.
Peters SO, Kizilkaya K, Garrick DJ, Fernando RL, Reecy JM, Weaber RL, Silver GA and Thomas MG (2012) Bayesian genome-wide association analysis of growth and yearling ultrasound measures of carcass traits in Brangus heifers. J Anim Sci 90:3398-3409.
Porto Neto LR, Bunch RJ, Harrison BE and Barendse W (2012) Variation in the XKR4 gene was significantly associated with subcutaneous rump fat thickness in indicine and com-posite cattle. Anim Genet 43:785-789.
Riley DG, Welsh Jr. TH, Gill CA, Hulsman LL, Herring AD, Riggs PK, Sawyer JE and Sanders JO (2013) Whole genome association of SNP with newborn calf cannon bone length. Livest Sci 155:186-196.
associa-tion with carcass traits in feedlot cattle. Anim Genet 40:878-882.
Sham PC, Cherny SS and Purcell S (2009) Application of ge-nome-wide SNP data for uncovering pairwise relationships and quantitative loci. Genetica 136:237-243.
Sikora KM, Magee DA, Berkowicz EW, Berry DP, Howard DJ, Mullen MP, Evans RD, MacHugh DE and Spillane C (2011) DNA sequence polymorphisms within the bovine guanine nucleotide-binding protein Gs subunit alpha (Gsa )-encod-ing (GNAS) genomic imprinting domain are associated with performance traits. BMC Genet 12:e4.
Snelling WM, Allan MF, Keele JW, Kuehn LA, McDaneld T, Smith TPL, Sonstegard TS, Thallman RM and Bennett GL (2010) Genome-wide association study of growth in cross-bred beef cattle. J Anim Sci 88:837-848.
The Wellcome Trust Case Control Consortium (2007) Genome-wide association of 14,000 cases of seven common diseases and 3,000 shared controls. Nature 447:661-678.
Thomas SC (2005) The estimation of genetic relationships using molecular markers and their efficiency in estimating herita-bility in natural populations. (Special issue. Population ge-netics, quantitative genetics and animal improvement. Pa-pers in honour of William [Bill] Hill). Philos Trans R Soc B Biol Sci 360:1457-1467.
Utsunomiya YT, do Carmo AS, Carvalheiro R, Neves HHR, Matos MC, Zavarez LB, Pérez O’Brien AM, Sölkner J, McEwan JC,et al.(2013) Genome-wide association study for birth weight in Nellore cattle points to previously de-scribed orthologous genes affecting human and bovine height. BMC Genet 14:e52.
Visscher PM (2009) Whole genome approaches to quantitative genetics. Genetica 136:351-358.
Visscher PM, Medland SE, Ferreira MA, Morley KI, Zhu G, Cornes BK, Montgomery GW and Martin NG (2006) As-sumption-free estimation of heritability from genome-wide identity-by-descent sharing between full siblings. PLoS Genet 2:e41.
Voorman A, Lumley T, McKnight B and Rice K (2011) Behavior of QQ-plots and genomic control in studies of gene-environment interaction. PLoS One 6:e19416.
Wigginton JE, Cutler DJ and Abecasis, GR (2005) A note on exact tests of Hardy-Weinberg equilibrium. Am J Hum Genet 76:887-893.
Wibowo TA, Gaskins CT, Newberry RC, Thorgaard GH, Michal JJ and Jiang Z (2008) Genome assembly anchored QTL map of bovine chromosome 14. Int J Biol Sci 4:406-414. Wolc A, Arango J, Settar P, Fulton JE, O’Sullivan NP, Preisinger
R, Fernando R, Garrick DJ and Dekkers JCM (2013) Analy-sis of egg production in layer chickens using a random re-gression model with genomic relationships. Poultry Sci 92:1486-1491.
Yu J, Pressoir G, Briggs WH, Bi IV, Yamasaki M, Doebley JF, McMullen MD, Gault BS, Nielsen DM, Holland JB,et al. (2006) A unified mixed-model method for association map-ping that accounts for multiple levels of relatedness. Nat Genet 38:203-208.
Zhang Z, Mateescu RG, Lust G, Phavaphutanon J, Tsai K, Mur-phy K, Todhunter RJ and Buckler ES (2006) Association mapping accounting for background QTLs: Relationship based on pedigree vs.molecular markers. Proc 8thWorld Congr Genet Appl Livest Prod 20-08, Belo Horizonte, CD-ROM Communication No. 20-08.
Zhang Z, Todhunter RJ, Buckler ES and Van Vleck LD (2007) Use of marker-based relationships with multiple-trait deriv-ative-free restricted maximal likelihood. J Anim Sci 85:881-885.
Zimin AV, Delcher AL, Florea L, Kelley DR, Schatz MC, Puiu D, Hanrahan F, Pertea G, Van Tassell CP, Sonstegard TS,et al. (2009) A whole-genome assembly of the domestic cow,Bos taurus. Genome Biol 10:R42.
Supplementary Material
The following online material is available for this article: Table S1 - Single nucleotide polymorphism markers asso-ciated with birth weight.
Table S2 - Single nucleotide polymorphism markers asso-ciated with gestation length.
Table S3 - Single nucleotide polymorphism markers asso-ciated with weaning weight.
Figure S1 - Quantile-quantile plots and 95% confidence bands of observedc2
values against expected probability values of birth weight-marker association F statistics from models with no relationship matrix included, and the fixed effect family included (upper) or not included (lower). Figure S2- Quantile-quantile plots for models based on av-erage pedigree relatedness.
Figure S3- Quantile-quantile plots for models with genomic relationship matrix.
Figure S4- Quantile-quantile plots of gestation length-marker association and weaning weight- length-marker associa-tion F statistics.
This material is available as part of the online article from http://www.scielo.br/gmb.
Data Access: Data will be shared with collaborators upon request.
Associate Editor: Dario Grattapaglia

![Figure 5 - Gestation length-SNP marker associations by significance (-log[FDR] = 1.3 at the horizontal line) and chromosome.](https://thumb-eu.123doks.com/thumbv2/123dok_br/15794675.647301/6.918.159.760.95.468/figure-gestation-length-marker-associations-significance-horizontal-chromosome.webp)
