Carina Alexandra Rebelo Ramos
Licenciatura em Engenharia do Ambiente
Potential of CPV receivers integrating
screen-printed solar cells
Dissertação para obtenção do Grau de Mestre em Energias Renováveis – Conversão
Eléctrica e Utilização Sustentável
Orientador: Prof. Doutor Stanimir Valtchev
Co-orientador: Doutor Luís Pina
Júri: Presidente: Prof. Doutor Adolfo Steiger Garção Arguente(s): Prof. Doutor Jorge Pamies Teixeira Vogal(ais): Prof. Doutor Stanimir Valtchev Doutor Luís Pina
A presente dissertação intitulada “Potential of CPV receivers integrating screen-printed solar cells”, escrita por mim, Carina Alexandra Rebelo Ramos, tem o seguinte termo de COPYRIGHT:
To my parents and brother, for believing in me.
To you David, for all patience and dedication.
“The height of your accomplishments will equal the depth of your convictions”
Acknowledgements
Becomes essential, a word of thanks to all those who, directly or indirectly, enabled one more of the objectives of my life come truth.
I would like to thank...
... my supervisor Dr. Stanimir Valtchev for creating the conditions and the protocol that enabled me to develop this master thesis on the R&D Department of WS Energia, giving me the opportunity of doing research in a business environment, as I was looking forward to and for the support, interest and availability that always showed throughout the course of this work;
... my co-supervisor, Dr. Luis Pina, for all the support and guidance along this work, and for keeping my work focused on what really matters;
... MSc Filipa Reis for the supervision, advice, patience and also for helping me going through the hurdles of this work, without which there would have been impossible to perform the same;
... all the staff of WS Energia, for their time and warm welcome;
… all the FCUL team, for the unconditional help that always offered and by providing all the equipment that made possible the realization of the experimental part of this thesis.
... my family for the support during the thesis work and through all my master degree. In particular, my parents and brother, for all the patience and support not only during the writing stage of the thesis, but my entire life; to my cousin Vera Teles, for the help and support that always showed in the right moments;
... all my friends, for understanding my absences and for providing me great and extremely important relaxing times.
And finally, to David, for always being by my side over the years, even when we were apart; for the dedication, love, understanding and patient that always demonstrated. For this, I will always be grateful.
ABSTRACT
Photovoltaic systems present themselves as an excellent alternative for clean energy production. To reach large applications, obstructions as high silicon prices must be overcome. Solar concentration systems are a potential solution since silicon is replaced by cheaper material (like mirrors or lenses). Nevertheless, there are still many issues and challenges yet to overcome. One of these challenges is the economic cost of the solar cells, since the CPV systems need to integrate expensive high efficiency solar cells specially designed to operate at high levels of radiation. Thus, it is necessary to explore new approaches.
In this thesis presents a study of the potential of the screen-printed silicon solar cells to integrate the CPV systems, concretely the HSUN system. Two solar cells, conventional 1Sun and conventional 15Suns, were analyzed and integrated in the HSUN sub-receivers, in order to understand their behavior under several levels of concentration and when integrated in series in sub-receivers. After the first part of the experimental campaign (electrical characterization of solar cells) it was concluded that the conventional standard silicon solar cells are unsustainable for use in the HSUN system (which operates a 15 suns), since these solar cells only work properly up to a concentration of 5 suns. Regarding the Upgraded 1-sun silicon solar cells, the results were satisfactory regarding their behavior under concentration, until a concentration level of 20 suns.
In the second part of the experimental campaign, the Upgraded 1-sun solar cells were integrated in the HSUN sub-receivers and their behavior was analyzed. The results taking from this part of the experimental campaign prove the good performance of the Upgraded solar cells and that their performance is unaffected by their integration in the sub-receivers. Associated to this part of the experiments, was also performed the optimization of the mounting process of the sub-receivers. This optimization provided a faster process with a lower probability of damaging the solar cells. To a complete study of the potential of these solar cells, it is important to take into account the economic viability of the solar cells. Comparing the cost-efficiency of the standard conventional solar cells, the LGBC solar cells (cells used actually in the HSUN system) and the Upgraded 1-sun solar cells, it was concluded that the solar cells more viable up to a concentration level of 24 suns are the Upgraded 1-sun solar cells, being that from this concentration level the LGBC solar cells solar cells present themselves as the most viable.
Therefore, and taking into account all the work developed along this thesis, it was concluded that the most cost-efficient solar cells to integrate the HSUN system are the conventional solar cells with some characteristics optimized for the required concentration levels.
Keywords: Concentration Photovoltaic systems, Silicon solar cells, Screen- printing, Laser Grooved
RESUMO
Os sistemas fotovoltaicos apresentam-se como uma excelente alternativa para produção de energia limpa. Os concentradores solares mostram-se como uma potencial solução, uma vez que parte do silício é substituído por materiais menos dispendiosos (como espelhos e lentes). Contudo, existem ainda vários desafios associados a este tipo de sistemas que necessitam ser resolvidos. Um desses desafios prende-se com os custos económicos associados ao uso de células solares de alta eficiência muito caras, desenhadas para funcionarem a altos níveis de radiação. Assim, mostra-se necessário a exploração de novas ideias e tecnologias. Nesta tese é apresentado um estudo da potencialidade de células solares screen-printed de silício para integração em sistemas de CPV, concretamente no sistema HSUN.
Dois tipos de células solares, convencionais standards e células solares de silício optimizadas para uma concentração de 15 sois, foram analisadas, com o objectivo de se perceber o seu comportamento e a sua performance sob vários níveis de concentração. No fim da primeira parte da campanha experimental desenvolvida (caracterização eléctrica das células solares), foi possível concluir que as células convencionais não são uma opção viável para integrar o sistema HSUN (que opera a uma concentração de 15 sóis), uma vez que as estas células apenas apresentam um correcto funcionamento até uma concentração de 5 sóis. No que respeita as células solares de silício optimizadas, os resultados foram satisfatórios, tendo em consideração o seu comportamento sob concentração até 20 sóis.
Na segunda parte da campanha experimental, as células solares optimizadas foram integradas em sub-receptores e o seu comportamento foi analisado. Os resultados obtidos provaram a boa performance, já demonstrada na sua caracterização eléctrica, e que o seu funcionamento não é afectado através da sua integração em sub-receptores. Associado a esta parte experimental, foi ainda realizada a optimização do processo de montagem dos sub-receptores. Esta optimização proporcionou um processo de montagem mais rápido e com menor probabilidade de danificação das células solares. Por fim, e comparando o custo vs. eficiência das células convencionais, das células solares optimizadas e das células solares de contacto enterrado (usadas actualmente no sistema HSUN), foi possível concluir que a célula solar mais viável até uma concentração de 24 sóis é a célula solar optimizada, sendo que a partir desse nível de concentração as células solares de contacto enterrado passam a ser as mais viáveis.
Assim, e tendo em conta todos os resultados obtidos ao longo do desenvolvimento desta tese, concluiu-se que as células solares mais viáveis para integrar o sistema HSUN são células solares convencionais com algumas características optimizadas para o nível de concentração requerido.
Palavras-chave: Sistemas de Concentração Fotovoltaica, Célula solar de silício, Tecnologia
CONTENTS
Acknowledgements ... xi
ABSTRACT ... xiii
RESUMO ... xv
LIST OF TABLES ... xxv
List of Abbreviations ... xxvii
INTRODUCTION ... 1
1.1 Context ... 1
1.2 Scope and objectives ... 2
1.3. Structure of the thesis ... 3
Concentration Photovoltaic Systems ... 5
2.1. Photovoltaic Solar Energy ... 5
2.2. Concentration of photovoltaic ... 7
2.2.1. Why Concentration? ... 7
2.2.2. Fundamentals of CPV systems ... 8
2.2.1.1Optics ... 9
2.2.1.2. Tracking systems... 11
2.2.1.3.Receiver ... 11
Fundamentals of Solar Cells to CPV systems ... 13
3.1. Basic principles of photovoltaic solar cells ... 13
3.1.1. Equivalent electric circuit of the solar cell ... 13
3.2. Electrical parameters of a solar cell... 19
3.2.1. Short-circuit current and open-circuit voltage ... 20
3.2.2. Maximum power point ... 20
3.4.Overview of Solar Cells for CPV ... 23
3.4.1.Single-crystalline solar cells for CPV applications ... 25
3.4.1.1.Modified screen-printed solar cells ... 26
3.4.1.2.Laser Grooved Buried Contact (LGBC) solar cells ... 27
3.4.1.3.Back contact cells ... 29
3.4.1.3.1. Emitters wrap trough (EWT) solar cells ... 29
3.4.1.3.2. Metallization wrap trough (MWT) solar cells ... 30
Theorectical characterization of Solartec and KVAZAR solar cells ... 31
4.1.Physical characteristics of the KVAZAR and Solartec solar cells ... 31
4.1.1.KVAZAR solar cells ... 31
4.1.2.Solartec solar cell ... 36
4.2.Mathematical model to estimate the behavior of solar cells under concentration ... 39
4.3.Theorical behavior of the Solartec and KVAZAR solar cells under concentration ... 43
Experimental characterization of the Solartec and KVAZAR solar cells ... 47
5.1. Electroluminescence of solar cells ... 47
5.1.1. Electroluminescence ... 47
5.1.2. Experimental procedure ... 49
5.1.3. Results ... 50
5.1.3.1. KVAZAR solar cells ... 50
5.1.3.2. Solartec solar cells ... 54
5.1.4. Main Conclusions ... 55
5.2. Measurement of electrical parameters of the solar cells... 56
5.2.1. Electrical parameters ... 56
5.2.2. Experimental procedure ... 57
5.2.3. Results ... 59
5.2.3.1. KVAZAR solar cells ... 59
5.3.1. I-V curves ... 68
5.3.1.1. Theoretical Introduction ... 68
5.3.1.2. Results ... 71
5.3.2. Suns Voc method ... 74
5.3.2.1. Theoretical Introduction ... 74
5.3.2.2. Results ... 75
5.3.3. Conclusions ... 75
5.4. Spectral Response and Quantum Efficiency ... 79
5.4.1. Theoretical Introduction ... 79
5.4.2. Experimental procedure ... 81
5.4.3. Results ... 82
5.5. Thermal coefficients of solar cells ... 86
5.5.1. Thermal coefficients concept ... 86
5.5.2. Experimental procedure ... 87
5.5.3. Results ... 88
5.5.4. Main conclusions ... 90
Integration of the solar cells in the HSUN sub-receivers ... 91
6.1. Integration of solar cells in the HSUN technology ... 91
6.2. Mounting process of the receiver and preliminary tests ... 92
6.2.1. Process ... 93
6.2.2. Tests ... 97
6.2.3. Optimization of the mounting process ... 116
6.2.3.1. Tests ... 118
6.3. Electrical performance ... 123
6.3.1 Experimental procedure ... 123
6.3.2. Results ... 124
6.3.2.1. Analysis of the results taking into account the incident radiation ... 127
6.3.2.2. Analysis of the results taking into account the radiation and cell temperature ... 129
6.3.2.2.1. Experimental procedure ... 129
6.3.2.2.2. Results ... 129
6.3.2.3. Adjust of the results obtained by the temperature estimated of the solar cells ... 131
8.1. Conclusions ... 139
8.2. Future Work ... 140
REFERENCES ... 143
LIST OF FIGURES
Figure 2.1 - Adams and Days' Selenium glass tube ... 5
Figure 2.2– Vanguard 1 ... 6
Figure 2.3 - Annual Photovoltaic Installation from 2000 to 2010 ... 7
Figure 2.4 – Concentration of the light in the solar cell ... 7
Figure 2.5 - Relative cost of the components of a PV systems as to its total cost for a conventional PV system and for a CPV system. ... 8
Figure 2.6 - Schematic of Linear-Focus Trough PV Concentrator ... 9
Figure 2.7 - Fresnel lens configurations ... 10
Figure 2.8 - Reflective concentrator configurations. ... 10
Figure 2.9 – Types of Tracking systems: (a) 1 axis tracker and (b) 2 axis tracker ... 11
Figure 3.1- Principle of operation of a solar cell. ... 14
Figure 3.2 - I-V characteristic of a silicon diode ... 14
Figure 3.3 - Diagram of equivalent circuit;Characteristic curve of the cell in total darkness ... 16
Figure 3.4 - Diagram of equivalent circuit, Characteristic curve of the irradiated cell ... 17
Figure 3.5 - Representation of the electrical circuit of one real solar cell ... 17
Figure 3.6 - Effect of variation of series resistance in the I-V curve ... 18
Figure 3.7 - Effect of the variation of the parallel or shunt resistance in the I-V curve ... 18
Figure 3.8 - I-V and P-V characteristic curve of an silicon cell ... 19
Figure 3.9 - I-V curve and point of maximum power draw of the CIEMAT’s simulator. ... 20
Figure 3.10 - Fill Factor of solar cells ... 21
Figure 3.11 - Effect of a) irradiance and b) temperature in the I-V curve ... 23
Figure 3.12 - Historic summary of champion cell efficiencies for various PV technologies. ... 24
Figure 3.13 - (a) The structure of a MJ solar cell. (b) Graph of spectral irradiance G vs. Wavelength λ over the AM1.5 solar spectrum. ... 25
Figure 3.14 - Monocrystalline solar cells ... 26
Figure 3.15 - Normalized plot of Efficiency against the concentration ratio of the optimized and unoptimized grid solar cell. ... 27
Figure 3.16 - Buried contact solar cells ... 28
Figure 3.17 - Buried contact in a silicon solar cell ... 28
Figure 3.18 - Emitters wrap trough (EWT) solar cells ... 29
Figure 3.19 - Metallization wrap trough (MWT) solar cells ... 30
Figure 4.1 - Front surface of the KVAZAR solar cell (main cell) ... 32
Figure 4.2 - Back surface of the KVAZAR solar cells ( main cell) ... 32
Figure 4.7 - Front surface of the Solartec solar cells ... 36 Figure 4.8 - Back surface of the Solartec solar cells ... 36 Figure 4.9 –Solartec solar cells with different front grid designs: a) one busbar; b) two busbars ... 37 Figure 4.10 – Reference of the Solartec solar cells ... 38 Figure 4.11 - Calculated values for Voc and Isc as function of concentration level in the a) KVAZAR
solar cells and b)Solartec solar cells ... 43
Figure 4.12 - Estimated power loss (Ploss) and efficiency (ε) as a function of the concentration level of a) Solartec solar cells and b) KVAZAR solar cells ... 44
Figure 5.1 - Electroluminescence image of a) a monocrystalline and b) poly-crystalline silicon cell. 48 Figure 5.2 – Electroluminescence System. ... 49 Figure 5.3 – Electroluminescence apparatus ... 50 Figure 5.4 - Power and characteristic curves of a solar cell ... 57 Figure 5.5 – Measurement of the FF from the I-V curve of a solar cell ... 57 Figure 5.6 – Solar Simulation located in the Laboratory of FCUL ... 58 Figure 5.7 – Detail of the solar cell placed on the sample holder in the solar simulator. ... 58 Figure 5.8 – I-V curve of cell nº 6.2 with the I-V tracer ... 60 Figure 5.9 – I-V curve of cell nº 6.3 with the I-V tracer ... 60 Figure 5.10 – I-V curve of cell nº 6.4 with the I-V tracer ... 60 Figure 5.11 – I-V curve of cell nº 6.5 with the I-V tracer ... 60 Figure 5.12 – I-V curve of cell nº 6.6 with the I-V tracer ... 60 Figure 5.13 – I-V curve of cell nº 6.7 with the I-V tracer ... 60 Figure 5.14 – I-V curve of cell nº 6.8 with the I-V tracer ... 61 Figure 5.15 – Values of a) Voc and b) Isc measured from the I-V curves before and after the soldering
process of the KVAZAR solar cells ... 61
Figure 5.16 – I-V curves traced with the four-point I-V measurement (green) and the I-V tracer
(violet) of the a)solar cell nº 6.2, b) solar cell nº 6.4, c) solar cell nº 6.7 and d) solar cell nº 6.8 ... 63
Figure 5.24 - Two I-V curves of the same solar cell under different illumination intensities. ... 70 Figure 5.25- I-V curve registered for the a) KVAZAR, b) Solartec and c) NaREC solar cells under 1,
2 and 10 suns. I-V curves are normalized to Isc and Voc. ... 71
Figure 5.26 - Concentration Simulator placed in the FCUL laboratory ... 72 Figure 5.27 – Suns-Voc apparatus placed in the FCUL laboratory. ... 74 Figure 5.28 - The spectral response of a silicon solar cell under glass ... 79 Figure 5.29 - Quantum Efficiency of a silicon solar cell ... 81 Figure 5.30 - System for measuring the spectral response and quantum efficiency ... 81 Figure 5.31 - Measurement of the SR in the solar cells: a) reference solar cell, b) KVAZAR or
Solartec solar cell ... 82
Figure 5.32 - External quantum efficiency of a conventional solar cell (KVZ.40 – 6.8) measured in
different positions on the cell. ... 83
Figure 5.33 - External quantum efficiency of a conventional solar cell (KVZ.40 – 6.7) measured in
different position ... 83
Figure 5.34 - External quantum efficiency of the Solartec solar cell a) class 24; b) class 26; c) with
two busbar ... 84
Figure 5.35 - QE curves obtained for the KVAZAR and the Solartec solar cells. ... 85 Figure 5.36 - Measured temperature coefficients for voltage for solar cell with uniform and
nonuniform temperature during testing. ... 86
Figure 5.37 – Solar Simulator located in the Laboratory of the WS Energia S.A. ... 87 Figure 5.38 - Variation of the Voc and Isc as a function of the temperature of the: a) KVAZAR, b)
SLT.C24, c) SLT.C26 and d) SLT.2BB solar cells. ... 89
Figure 6.19 – Pressure Board ... 117 Figure 6.20 – Pen flux ... 118 Figure 6.21 – Presence of spot sand balls of soldering paste on the solar cell busbar. ... 119 Figure 6.22– Percentage of sub-receivers that are within a certain range of Pmp. ... 120 Figure 6.23 – Maximum power point before and after the re-soldering process of sub-receivers. .... 121 Figure 6.25 – Open circuit voltage before and after the re-soldering process ... 122 Figure 6.25 – Sub-receiver with the output ribbons soldered. ... 123 Figure 6.27 – Experimental set to measure the I-V curves under outdoor conditions. ... 124 Figure 6.28 – Placement of the a) thermocouple at the rear surface of the sub-receiver and b) the
radiation meter apparatus side-by-side with the sub-receiver. ... 124
Figure 6.29 – I-V curves measured to sub-receivers. ... 125 Figure 6.30 – Measured values of Pmp of the sub-receiver and the average of the Pmp of the solar
cells. ... 126
Figure 6.31 – Estimated values of FF of the sub-receiver ... 126 Figure 6.32 –Values of a) Isc and b) Voc of each solar cell (different red hue bars) and sub-receiver
(blue bars) normalized at outdoor conditions ... 127
Figure 6.33 –Values of a) Isc and b) Voc of each solar cell (different red hue bars) and sub-receiver
(blue bars) normalized at outdoor conditions ... 128
Figure 6.34 - Placement of the Thermocouple in the back rear surface of the solar cell ... 129 Figure 6.35 - I-V curves measured in the sunlight exposure from the a) SLT.C26-2 and b) SLT.C24-2
sub-receivers. ... 130
LIST OF TABLES
Table 2.1 - Description of Classes of CPV systems ... 9 Table 4.1 - Dimensions and materials of KVAZAR solar cells ... 33 Table 4.2 - Physical characteristics of solar cells ... 35 Table 4.3 – Dimensions and materials of Solartec solar cells ... 37 Table 4.4- Calculated electrical parameters of Solartec and KVAZAR solar cells under different
concentration levels ... 45
Table 5.1 - Photographs taken with the Electroluminescence method: before and after the cutting
process of KVAZAR solar cells, and after the soldering process. ... 53
Table 5.2- Electroluminescent images taken to Solartec solar cells after the soldering process. ... 54 Table 5.3 - Values of parameters of the solar cells tested before and after the soldering process... 63 Table 5.4 – Electrical parameters estimated for KVAZAR solar cells at 1 sun. ... 64 Table 5.5 - Values of parameters of the solar cells tested before and after the soldering process... 66 Table 5.6 - Values of electrical parameters of the Solartec and KVAZAR solar cells. ... 66 Table 5.7 – Series Resistance estimated by the slope method ... 72 Table 5.8 – Series Resistance estimated by the multiple light intensities method... 73 Table 5.9 - Series Resistance estimated by the Suns Voc setup ... 75 Table 5.10 – Series Resistance of the KVAZAR, Solartec and NaREC solar cells estimated by the
different methods. ... 77
List of Abbreviations
Acronyms
CPV – Concentrated photovoltaic
ECT – Equivalent Cell Temperature
EL – Electroluminescence
EWT – Emitters Wrap Trough
FCT-UNL – Faculdade de Ciências e Tecnologia – Universidade Nova de Lisboa
FCUL – Faculdade de Ciências da Universidade de Lisboa
HCPV – High Concentration Photovoltaic
I-V – Current-voltage
LCPV – Low Concentration Photovoltaic LGBC – Laser Grooved Buried Contact
MCPV – Medium Concentration Photovoltaic
MWT – Metallization Wrap Trough
QE – Quantum Efficiency
PCB – Printed Circuit Board
PV – Photovoltaic
RE – Renewable Energy
R&D – Research and Development
ε – Efficiency
λ – Wavelength
β – Thermal coefficient
Eg –Energy gap
FF – Fill Factor
I0 - Reverse Saturation Current (or leakage current)
IMPP – Current at Maximum Power Point
Isc – Short-circuit current
k – Boltzmann constant
Jsc – Short-circuit current density Ploss – Power losses
Pmp – Maximum power point
q –Electron charge
Rs – Series resistance
Rsh – Shunt resistance
T – Temperature
VMPP – Voltage at maximum power point
Introduction
Chapter 1
INTRODUCTION
1.1 Context
Since 1860, the average surface temperature increased 0.6 °C. Different future scenarios predict that by 2100, this temperature will increase between 1.5 and 6º C, if the energy choices and habits of current consumption remain unchanged [1].
The Renewable Energy whose conversion technologies have reached a maturity which allows commercial and technical perspective the application of economic significance, are forms of energy that regenerate cyclically in a reduced scale of time. That is, energies that are in constant renewal, are inexhaustible and can be continuously used [2]. Thus, the renewable energies are pointed out as one of the solutions to mitigate the energetic problems, as well as a sustainable alternative to fossil fuels [2]. Among them, solar energy has the biggest developing potential and has proven to be an efficient and cost-effective energy source for different applications.
The Sun is the most abundant power source and is estimated that the sunlight that reaches the Earth's surface is enough to provide more energy as it is currently used. On a global average, each square meter of land is exposed to enough sunlight to produce 1700 kWh of power every year [3].
Photovoltaic (PV) technology involves the generation of energy from the direct conversion of the sunlight into electricity. Since 2000, total PV production increased almost by two orders of magnitude, with annual growth rates between 40% and 90%. The most rapid growth in annual production over the last five years could be observed in Asia, where China and Taiwan together now account for almost 60% of world-wide production. However, the major barrier towards very large-scale use of PV systems has been the cost of electricity generation with this type of technology [4].
(refractive or reflective) and the geometry, but also by the type of solar cells used. Since the CPV systems operate under concentration, it’s necessary that the solar cells used in this kind of systems present several proprieties that lead to a good performance. Thus, the solar cell choice is decisive for a CPV system to achieve high performance and to be reliable over its entire lifetime [5].
1.2 Scope and objectives
This master thesis was developed within the framework of the HSUN project, a new CPV system that is being developed in a collaboration between the research and development (R&D) Wemans and Sorasio Laboratories of WS Energia, the Departamento de Engenharia Electrotécnica from Faculdade de Ciências e Tecnologia – Universidade Nova de Lisboa (FCT-UNL) and the Faculdade de Ciências da Universidade de Lisboa (FCUL) and intends to contribute to evolution of
science and technology on photovoltaic systems, and thus increase the penetration of solar energy in the markets.
The objective of this research was to study the performance of various types of solar cells under solar concentration and thus, contributing for the development of the HSUN technology. Thus, taking into account the main objective, the thesis is divided in two distinct parts:
• Laboratorial characterization of the solar cells in study to validate the theoretical method that was used for predicting the behavior of solar cells under different concentration levels.
• Improvement of the mounting process of the HSUN receivers. Through the implementation of this process, the soldering of solar cells has become faster with a lower probability of damaging the solar cells. It was also performed an experimental campaign to understand the behavior of the solar cells when integrated into the HSUN sub-receivers.
Introduction
1.3.Structure of the thesis
This thesis is organized in eight Chapters:
Chapter 1 sets the context, scope and main objectives of the thesis as the necessity of a correct
choice of the solar cell that integrates the CPV system.
Chapter 2 presents the fundamental concepts and state of the art of concentrated photovoltaics
systems
Chapter 3 presents the fundamental concepts of the solar cells and describes the state of the
art of the solar cells that are suitable to integarte the CPV systems. Also in this chapter it is presented the physical characteristics of the solar cells under study in this thesis.
Chapter 4 covers the estimated behavior of the solar cells under different concentration
levels. A mathematical model to estimate the behavior of solar cells under concentration is explained and the expected behavior of the solar cells under concentration is presented.
Chapter 5 describes the laboratorial characterization of the solar cells under study, with the
presentation of a full experimental campaign where several experimental procedures were performed in order to test and analyze the electrical and physical parameters of the solar cells.
Chapter 6 describes the behavior of the solar cells tested integrated in the HSUN
sub-receivers. Also in this chapter is explained the whole soldering process of solar cells developed in the context of this thesis.
Chapter 7 describes the cost-efficiency analysis of screen-printed solar cells to integrate CPV
systems.
Chapter 8 presents the main conclusions of this work, as well as directions for future
Concentration Photovoltaic Systems
Chapter 2
Concentration Photovoltaic Systems
This chapter introduces the fundamental concept and a brief history of Photovoltaic (PV) technology. Within this area, Concentration photovoltaic (CPV) systems are pointed out as an interesting technological option to significantly reduce the PV electricity costs. The main areas of CPV technology are then briefly described.
2.1.Photovoltaic Solar Energy
The photovoltaic (PV) effect consists on the direct conversion of sunlight into electricity. Such effect, involves the transfer of the photon energy of the incident radiation to the electrons of the atomic structure of the semiconductor material. This translates into the creation of free charges in the semiconductor, which are separated inside the device by the electric field of the junction, thus producing an electric current outside [6].
This effect was first observed in 1839 by Edmond Becquerel who found that metal plates, platinum or silver, dipped in an electrolyte, when exposed to light, produces a small potential difference. Later in 1877, two inventors from the U.S., W. G. Adams and R. E. Day, used the photoconductive properties of selenium, to develop the first solid state device for producing electricity when exposed to light (Fig. 2.1).
Figure 2.1 - Adams and Days' Selenium glass tube
gold, semi-transparent, which worked as a front contact. Despite the low conversion efficiency of the device (about 0.5%) in the late nineteenth century, the German engineer Werner Siemens (founder of the industrial empire with his name) marketed as selenium cell light meters for cameras [7]. With the advent of the space age, the photovoltaic technology has assumed a new importance, since the solar cells began to be used as backup to the chemical batteries used in satellites, in 1958 (Fig.2.2) [7].
Figure 2.2– Vanguard 1 was the fourth artificial satellite launched and the first to be solar power. It’s the oldest satellite
orbiting Earth, but there is no longer any communication with it.
Source: http://nssdc.gsfc.nasa.gov/nmc/spacecraftDisplay.do?id=1958-002B
The history of photovoltaic had expected its major scientific developments on the first half of the twentieth century, including the explanation of the photoelectric effect by Albert Einstein in 1905, the advent of quantum mechanics and in particular the theory of bands and the physics of semiconductor producers [7].
Concentration Photovoltaic Systems
Figure 2.3 - Annual Photovoltaic Installation from 2000 to 2010
Source: see reference [4]
2.2.
Concentration of photovoltaic
2.2.1. Why Concentration?
Nowadays, the PV technology shows up as a very attractive option for clean energy generation. However, this technology have been limited in use due to the high cost associated to these systems [8] which was mainly associated to the solar cells price. One approach to reduce PV electricity cost lies in the development of concentration photovoltaic (CPV) systems which lead to a decrease in the amount of semiconductor material per watt of generated power by providing an increase of the radiation intensity per area (Fig. 2.4) [8].
Figure 2.4 – Concentration of the light in the solar cell
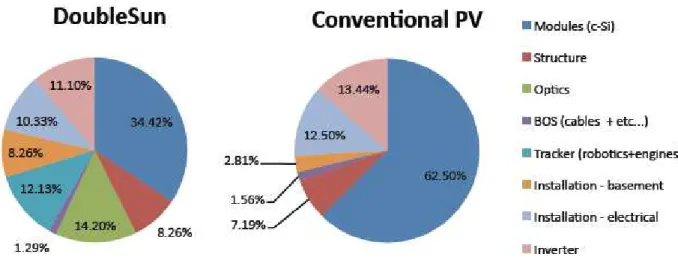
from a large area, into a smaller area [9]. Since the optical elements are cheaper than the solar cells, a further cost reduction on the PV electricity may be expected [9]. The CPV technology advantage is illustrated by Fig. 2.5 which shows the percentage of each PV system component cost as to the total cost of the system. The relative costs are presented for conventional silicon PV modules integrated in two different configurations: a fixed structure and a CPV system, the DoubleSun® technology which was developed by WS Energia S.A. As can be observed, in the case of CPV systems, the impact of semiconductor material (i.e. of the module), in the total cost of the system, decreases to almost a half.
Figure 2.5 -Relative cost of the components of a PV systems as to its total cost for a conventional PV system (on the
right-hand) and for a CPV system, the DoubleSun® technology (on the left-hand).
Source: Reis, Filipa, “LCoE analysis as a decision tool for design of concentrated photovoltaic system”, 2011
2.2.2. Fundamentals of CPV systems
Concentration Photovoltaic Systems
Table 2.1 - Description of Classes of CPV systems
Source: S. Kurtz, “Opportunities and Challenges for Development of a Mature Concentrating Photovoltaic Power Industry”, 2009
Class of CPV Typical Concentration Ration
High-concentration >400 suns Medium-concentration 10 suns – 100 suns
Low-concentration 2 suns -10suns
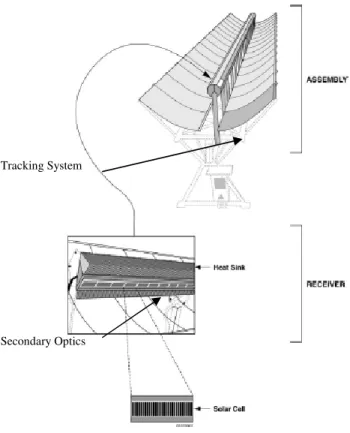
As showed in Fig. 2.6, a CPV system can be divided in 3 main components (optics, trackers and receiver) which are presented and brief described in the next sections.
Figure 2.6 - Schematic of Linear-Focus Trough PV Concentrator
Source: IEC62108 Norm
2.2.2.1. Optics
The optics of a CPV system is the component that concentrates the sunlight into solar cells. It can be divided in two main groups: refractive optics and reflective optics. The refractive optics usually consists on Fresnel lenses and can have two distinct configurations: i) point-focus, where is
sunlight is focused on a line of solar cells which are placed in a string (Fig. 2.7) [10].
Figure 2.7 - Fresnel lens configurations: a point-focus Fresnel lens (on the left-hand) and a domed linear Fresnel (on the right-hand)
Source: see reference [10].
Regarding the reflective optics, the most common solution is the use of mirrors. These components can have different configurations such as: i) linear (used for low concentration levels) and ii) parabolic shaped (used for medium and high concentration levels). As in the case of the Fresnel lenses, the parabolic shapes can be classified in two groups: parabolic with point focus, where parabolic dishes are used to focus the sunlight; and linear focus, where the light is focuses through the use of parabolic troughs (Fig. 2.8) [10].
Figure 2.8 - Reflective concentrator configurations: a point-focus parabolic mirror concentrating (on the left-hand) and a
linear parabolic (on the right-hand).
Source: see reference [10].
Concentration Photovoltaic Systems
or even on a higher homogeneity of the radiation that falls on the cells. As the primary optics, there are several configurations for the secondary optics [10].
2.2.2.2. Tracking systems
To correctly concentrate the sunlight on the solar cells, the optics of the CPV systems have to be aligned with the sun rays, thus demanding for a tracking system which places the CPV system towards the sun from sunrise until sunset [8].In general, the tracking systems, depending of the optics requirements, can track in 1 or 2 axes (Fig. 2.9). In the case of the point focus optics (that was mentioned above) usually requires the tracking in 2 axes while, in the case of the linear focus optics, the tracks in 1 vertical axis can be enough to guarantee a proper performance of the CPV system. Although in most cases the solar cells are the most expensive component that integrates the CPV system, in some of the cases, when a elevated tracking precision is required, the tracking system and its structure can become the most expensive component of a CPV system [10]. Thus, the higher the precision, the greater is the cost associated with this equipment.
(a) (b)
Figure 2.9 – Types of Tracking systems: (a) 1 axis tracker and (b) 2 axis tracker
Source : see reference [10].
2.2.2.2. Receiver
affect the cells performance. Thus, a cooling system may be required. The cooling system can be classified in two strands: passive, where the cooling of the module is made through by aluminum fins; and active, where the cooling of the module is made with running water[11].
Fundamentals of Solar Cells to CPV Systems
Chapter 3
Fundamentals of Solar Cells to CPV systems
This Chapter covers the basic principles of PV solar cells by addressing: i) the equivalent electrical circuit; ii) the main electrical parameters that characterize a solar cell and iii) the influence of radiation and temperature on solar cells performance. This chapter ends with an overview of the solar cells that are suitable for CPV applications.
3.1. Basic principles of photovoltaic solar cells 3.1.1. Equivalent electric circuit of the solar cell
Photovoltaic cells are made of semiconductor material, i.e. material with intermediate characteristics between a conductor and an insulator. Silicon presents itself typically as sand. However, through the appropriate methods is obtained silicon in a pure form. The crystal of pure silicon has no free electrons and therefore is a poor electrical conductor [12].
Thus, in order to change this situation, percentages of other elements, as phosphorus and boron, are added to the silicon. This process is named doping. Through the doping of silicon with phosphorus, a material with free electrons or materials with negative charge carriers (n-type silicon) is obtained. By performing the same process, but now added boron instead of phosphorus, is obtained a material with the opposite characteristics, i.e. lack of electrons or a material with free positively charges (p-type silicon) [12].
Figure 10- Principle of operation of a solar cell. Source: http://www.esdalcollege.nl/eos/vakken/na/zonnecel.htm
The junction works as a rectifier or diode because the application of a potential difference, with the positive potential applied to the p-type material, decreases the potential barrier and allows current to pass through the interface, while the application of a reverse potential difference increases the potential barrier and not allow the passage of current. Figure 3.2 illustrates the characteristic curve of a silicon diode [13].
Figure 11 - I-V characteristic of a silicon diode
Fundamentals of Solar Cells to CPV Systems
When the diode is connected to a circuit so as that the potential is positive on the anode doped with impurities of type p, and negative on the cathode doped with impurities of type n, the diode is directly polarized. In this case its applied the first quadrant of characteristic curves, where, from a defined voltage (threshold driving voltage in this case is 0.7 V), the current will flow [13].
If the diode is reverse-biased, current is prevented to move in this direction and in this case, it applies to the third quadrant of the characteristic curve. The diode goes into avalanche or breakdown region when the reverse voltage exceeds a given threshold value (which may lead to its destruction), specific for each diode, called rupture strain. It is the "knee" strain of the I-V curve, and it is designated by VZK. In the region of rupture, the reverse current grows quickly, while the corresponding increase in voltage drop too low [13].
The expression that gives us the variation of intensity of the diode current (Id ) with a difference of potential on the terminals is the Shockley equation [13]:
= exp − 1 (1)
where:
I0 - Reverse Saturation Current (or leakage) that passes through the diode;
V - Difference of potential on the terminals of the diode;
m - Ideality factor of the diode (when m = 1, we have a ideal diode; when the m> 1, we have a real diode);
VT - Thermal Potential that is given by the equation 2
= (2)
k -Boltzman Constant ( = 1.38 × 10 / );
T - Absolute temperature of the cell (in Kelvin);
decreases when qV is negative for a value of saturation negative.
A solar cell that is not exposed to solar radiation is represented by the equivalent circuit of a diode and the respective I-V curve in Fig. 3.3 [13].
Figure 12 - a) Diagram of equivalent circuit; b) Characteristic curve of the cell in total darkness Source: see reference [13]
The equation that expresses the variation of current vs. voltage for the ideal solar cell is given by [13]:
= #− $⇔ = # − &' − 1 (3)
where IL is the current generated due to exposure to light or solar radiation. Then, it proves that if does not exist solar radiation, the value of IL is 0, and the equation (3) leads to the equation (1). In the presence of solar radiation, the characteristic curve of diode is deflected by the peak current IL in the direction of reverse bias (fourth quadrant in the diagram of I-V curve) (Fig. 3.4) [13]. The current generated by the solar radiation can be electrically represented by a current source (Fig. 3.4).
Fundamentals of Solar Cells to CPV Systems
Figure 13 - a) Diagram of equivalent circuit b) Characteristic curve of the irradiated cell Source: see reference [13]
However, contrary to what occurs in the ideal solar cell, in reality the PV cells have associated to their characteristic parasitic resistances that affect their performance. As such, the equivalent electric circuit should include two elements, the series (Rs) and shunt or parallel (Rsh) resistance [13]. Figure 3.5 shows the equivalent electric circuit that represents the operation of one real solar cell when connecting its terminals to one electrical charge (Z).
Figure 14 - Representation of the electrical circuit of one real solar cell
Source: http://www.newworldencyclopedia.org/entry/Solar_cell
The Rsh is arises from the defects present in the solar cells, while the Rs is formed by many individual resistances:
• Emitter sheet resistance;
• Bulk substrate;
• Resistance of the the busbar and fingers;
• Contact resistance between front gridlines and emitter;
• Resistance of the back busbar.
slope of the curve near the open circuit voltage (Voc) region [6].
Figure 15 - Effect of variation of series resistance in the I-V curve Source: see reference [14]
Fundamentals of Solar Cells to CPV Systems
Both resistances influence the I-V curve by reducing the cell fill factor. Very high values of Rshand very low values of Rs may cause the reduction in short circuit current and in the open circuit voltage, respectively. In the presence of these resistances, the general equation of the characteristic curve of the cell is given by [6, 15]:
= # − &' + )* × − 1 − + )* ×)+, (4)
3.2. Electrical parameters of a solar cell
When through one variable resistance that varies the electrical charge on the terminals of a photovoltaic module or other photovoltaic device exposed to solar radiation, the photogenerated electrical current that runs through the resistance varies according to the voltage on the terminals. The graphical representation of current as a function of voltage is called the characteristic curve, also named I-V curve. Figure 3.8 represented a typical I-V curve and a P-V (Power-Voltage) curve for a solar module [13].
Figure 17 - I-V and P-V characteristic curve of an silicon cell
Source: http://www.cleanenergybrands.com/shoppingcart/products/HukseFlux-IV400.html
3.2.1. Short-circuit current and open-circuit voltage
The two parameters obtained from the intercept of the I-V curve with the axis system for a given radiation and temperature, allow to characterize one solar cell of a given area.
This two parameters are the short-circuit current (Isc(V = 0)) and the maximum voltage on the terminals of the cell by the open circuit voltage (Voc (I = 0)) [16].
According to equation 5 and 6, the value of ISC and the Voc is given, respectively, by [16]:
*- = # (5)
.- = × × /01
02+ 1 3 (6)
3.2.2. Maximum power point
Another parameter that it can be seen through the I-V curve is the maximum power point (Pmp). The region of the characteristic curve between Isc and Voc that corresponds to cell functioning as a generator, for each point on the I-V curve, yielding a value of voltage and respective current, or a power (P = VxI), which can be represented as shown in Fig. 3.9 [6].
Figure 18 - I-V curve and point of maximum power draw of the CIEMAT’s simulator.
Fundamentals of Solar Cells to CPV Systems
The power delivered is given by the above product and there will be an operating point (Impp, Vmpp) at which maximum power is delivered - the point of maximum power.
In a short circuit or in an open circuit the power is zero. The maximum power that emerges from the cell (Pmp), occurs at the point of the characteristic curve where the product (I x V) is maximum, ie (05)(5) = (6)(5)= 0.
So, according to equation 7, the value of voltage at the maximum power point is given by [16]:
'' = 78− × × /0012+ 1 3 (7)
And, according to the equation 8, the value of current at the maximum power is given by [16]:
'' = −59::5
; × &' / 59::
5; 3 (8)
The value of maximum power is therefore calculated by the product of the maximum values of intensity and voltage of the solar cell at the Pmp, as can be seen in the equation 9 [14].
< ' = '' × ( '') = '' × '' (9)
3.2.3. Fill Factor
The Fill Factor (FF) is a parameter which, in conjunction with Voc and Isc, determines the maximum power from a solar cell. The FF is defined as the ratio of the maximum power from the solar cell to the product of Voc and Isc and is represented in the following figure by the light blue area. It can be estimated by the equation 10 [14].
Figure 19 - Fill Factor of solar cells
== = *- × .-'' × '' (10)
The FF is a parameter of great importance and of great practical use because it is the indicator of the quality of the cells[6].
Making use of the definition of FF, the Pmp delivered by a cell is given by equation 11 [6].
< ' = == × *- × .- (11)
3.2.4. Conversion efficiency
The energy conversion efficiency of a solar cell is defined by the ratio between the Pmp and the power that falls on the solar cell, G [6].
> =< '? (12)
Naturally, this efficiency and maximum power is obtained only if the load resistance is adequate, given by Vmpp / Impp. For example, when one says that a commercial cell has an efficiency of 15% it means that if we had a cell surface of 1m2 that is illuminated with 100W/m2 of incident radiation, the maximum output power will be 15W [14].
3.3.
Influence of temperature and radiation intensity on the characteristic curve
Fundamentals of Solar Cells to CPV Systems
Figure 20 - Effect of a) irradiance and b) temperature in the I-V curve
Source: see reference [13]
As shown by Fig.3.11, the value of Isc is increased with the raise of the incident radiation on the cell, but this variation is more important for lower values of incident radiation. When a PV cell is exposed to higher temperatures, the Isc increases slightly, while the Voc decreases more significantly. Thus, for a specified set of ambient conditions, higher temperatures result in a decrease of Pmp [13].
3.4.
Overview of Solar Cells for CPV
Figure 21 - Historic summary of champion cell efficiencies for various PV technologies. The highest efficiencies have been achieved for multijunction solar cells; these efficiencies are still increasing each year. Multijunction cell efficiencies have
the potential to approach 50% in the coming years.
Source: see reference [5]
Within the crystalline solar cells, the monocrystalline technology are historically the most widely used and marketed for converting solar energy into electricity and are made from a single silicon crystal. These cells are the most efficient of all silicon cells. The crystal is obtained from high purity fused silica (Si = 99% to 100%) in reactors under controlled atmosphere and with very slow speeds for the crystal growth (process known as Czochralski method). Finally, the cells are obtained by cutting the ingots into fine discs (0.4-0.5 mm thick). The efficiency of this solar cells to convert the sunlight into electricity is over 15% [17, 18].
Multijunction (MJ) cells consist of multiple semiconductors, each one capable of absorbing in a different region of electromagnetic spectrum. The semiconductors are carefully chosen to absorb nearly the entire solar spectrum, thus generating electricity from as much of the solar energy as possible (Fig. 3.13) [19]. This approach allows the cell to cover more of the light spectrum, but
Figure 22 - (a) The structure of a MJ (BSF) layers, window layers, tunnel jun G v
Source: h
However, the MJ solar cel cells unsuitable to integrate the l As so, the silicon solar cells w MCPV technology (as the HSU demonstration performance and a this technology a very reliable te
3.4.1. Monocrystalline solar
The conventional standard 1000 W/m2 (1 sun). When this t higher amount of irradiation, the resistance losses, thus leading to
In order to guarantee an ef solar cells must be fabricated sp describe several approaches tha applications.
Fundamentals of Solar Ce
J solar cell. There are six important types of layers: p-n juncti junctions, anti-reflective coating and metallic contacts; (b) Gra
vs. Wavelength λ over the AM1.5 solar spectrum.
http://en.wikipedia.org/wiki/Multijunction_photovoltaic_cell
cells have a very high cost, which, in the short term e low and medium concentration systems, such as were pointed out as the most cost‐effective solut SUN system). The silicon solar cells have man d a well standardized process for high volume prod technology benefitting from economies of scale [20
lar cells for CPV applications
ard monocrystalline solar cells (Fig. 3.14) are desi is type of solar cells are integrated in the CPV syst the current that flows in the solar cells increases, to a decrease of the FF and the efficiency of the sol efficient operation of solar cells under concentratio specifically for concentration systems. In the fol that were taken to improve silicon solar cells eff
Cells to CPV Systems
ctions, back surface field raph of spectral irradiance
erm, makes these solar as the HSUN concept. lution to integrate the any years of on‐field
oduction which makes [20].
esigned to work under ystems and exposed to s, as well as the Joule solar cell) [21].
Figure 23 - Monocrystalline solar cells
Source: http://www.directindustry.com/prod/kpe-co-ltd/monocrystalline-photovoltaic-solar-cells-54445-358166.html
3.4.1.1. Modified screen-printed solar cells
The modified conventional silicon solar cells shows up as the best choice for the existence of a compromise between high efficiency and low cost, since small changes on one-sun cell can lead to high efficiency cells with higher cost than the standard ones, but affordable when integrated in CPV systems and the industrial lines of standard silicon solar cells are easily adaptable to the new high efficiency silicon cells, thus benefiting from economies of scale [21].
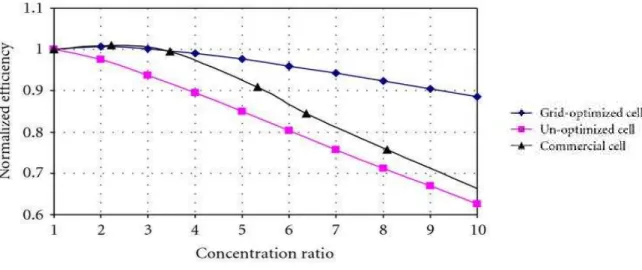
The screen-printed method is an economical metallization technique used by most manufactures of conventional solar cells[22]. By printing additional metal on the solar cell front surface the resistive losses are reduced; however, additional metal causes additional shading of the top surface of the cell. Thus, the design of the front grid contact must result from a tradeoff between the shading and the resistive power loss [23]. With an optimized grid design, in accordance with conductivity and shadowing factor, we can maintain their efficiency up to a concentration level of 15 suns [24]. Through the optimized grid design we obtain a low-cost and low-level technological process which allows the use of conventional solar cells, with costs of production similar to the 1 sun conventional solar cells [24].
Fundamentals of Solar Cells to CPV Systems
As can be seen, after the optimization of the font grid of the solar cell, the efficiency remains high until a concentration of 10 suns. Without the optimization of the front grid, the losses are significantly greater beyond 4 suns [24].
Figure 24 - Normalized plot of Efficiency against the concentration ratio of the optimized and unoptimized grid solar cell.
Source: see reference [24]
However, there are other approaches such as the Laser Grooved Buried Contact (LGBC) solar cells, the Emitters Wrap Trough (EWT) solar cells and the Metallization Wrap Trough (MWT) solar cells, among others. The main problem in using these technologies is that the production process of these new solar cells, such as occurred in multijunction solar cells, is still very recent and aren't yet completely solidified in the PV market. So, compared to Upgraded 1-sun solar cells, they are more expensive [20].
3.4.1.2. Laser Grooved Buried Contact (LGBC) solar cells
Figure 25 - Buried contact solar cells
Source: http://pvcdrom.pveducation.org/MANUFACT/BCSC.HTM
A key to the high efficiency feature of this type of technology is that, unlike in the screen-printed cells, the metal is buried in a laser-formed groove inside the solar cell. This type of contact allows for a large metal height-to-width ratio. So, by using this type of technology a large volume of metal is used in the contact finger, without having a wide strip of metal on the top surface (thus minimizing the shadow effect on the front of the solar cell) [20].
In addition to good reflection properties, the buried contact technology also allows low parasitic resistance losses due to its high metal ratio, its fine finger spacing and its plated metal for the contacts (Fig 3.17). The metal grid resistance is also low since the finger resistance is reduced by the large volume of metal in the grooves and by the use of copper, which has a lower resistivity than the metal paste used in screen printing.
Figure 26 - Buried contact in a silicon solar cell Source: http://pvcdrom.pveducation.org/MANUFACT/BCSC.HTM
Fundamentals of Solar Cells to CPV Systems
buried contact technology is that it can be used for concentrator systems [20] and, after the Upgraded 1-sun solar cells, it is the most viable technology to be used in the MCPV systems. The solar cells currently used in the HSUN system, manufactured by the NaREC company, are Laser Grooved Buried Contact (LGBC) solar cells and their specifications and electrical parameters are presented in the Annex II.
3.4.1.3. Back contact cells
3.4.1.3.1. Emitters wrap trough (EWT) solar cells
The "emitter-wrap-through" (EWT) solar cell is a back-contact cell that can use solar-grade silicon. "Emitter" refers to the current-collection junction that is commonly formed in silicon solar cells by diffusing phosphorus (an n-type dopant) into a p-type silicon substrate. The key enabling element for the EWT cell is the use of laser machining to make an array of holes in the silicon substrate (Fig. 3.18) [20].
These holes are diffused with phosphorus during the emitter diffusion, thereby wrapping the emitter from the front surface to the rear surface [20].
Figure 27 - Emitters wrap trough (EWT) solar cells Source: see reference [20]
The EWT cell is particularly useful with low-quality solar-grade materials because there is an emitter on both the front and much of the rear surface over much of the cell. This effectively doubles the collection length of carriers in the bulk of the device. Early prototypes of the EWT cell at Sandia National Laboratories demonstrated efficiencies a little above 18% and 15%, using thin-film metallization and the more commercially relevant screen-printed metallization, respectively.
3.4.1.3.2. Metallization wrap trough (MWT) solar cells
The contact wrap-through or metallization wrap-through (MWT) back-contact cell is the concept that is most closely linked to the conventional cell structure. In these cells, the emitter is located near the front surface, but part of the front metallization grid is moved from the front to the rear surface (the busbar on the front surface of the solar cells are transferred to the rear side of the cell). In the schematic representation in Fig. 3.19, this is depicted as the busbar moving from one surface to the other, while the remaining front surface grid is connected to the interconnection pads on the rear surface by extending it through a number of openings in the wafer [20].
Figure 28 - Metallization wrap trough (MWT) solar cells Source: see reference [20]
The MWT cells requires only a relatively small number of through-holes to direct photogenerated electrons to the back surface, through the metal electrodes and n-doped emitters, and produce higher collection photocurrents due to absence of a bus bar (main electrode) on the front surface (as in conventional cells). A high Jsc of 37.3 mA/ cm–2 and an efficiency of 18.3% were reported for a recent MWT cell by Kyocera, and the module efficiency for MWT cell modules by ECN, 16.4%, is the highest reported to date [25].
Fundamentals of Solar Cells to CPV Systems
Chapter 4
Theoretical characterization of Solartec and KVAZAR solar cells
This chapter covers the theoretical behavior of the Solartec and KVAZAR solar cells under concentration. In section 4.1, the physical characteristics of the Solartec and KVAZAR solar cells are presented; in section 4.2, a description of the mathematical model used for estimate the behavior of the solar cells is describe and in section 4.3, the theorical results obtained and the consequents conclusions are presented.
4.1.Physical characteristics of the KVAZAR and Solartec solar cells
In this thesis two types of silicon solar cells were studied: i) the conventional solar cells, provided by the KVAZAR company and ii) Upgraded 1-sun screen printed silicon solar cells, provided by the Solartec company. In the next section, the physical characteristics of these solar cells are explained and the datasheets provided by the suppliers are presented in the Annex III.
4.1.1. KVAZAR solar cells
Figure 29
The KVAZAR solar cells approximately. The active area o by the contacts of the cell) is, app
The front of the solar cell cell) with 1.5 mm and 0.04 mm two soldering pads with 3mm of
Figure 30
29 - Front surface of the KVAZAR solar cell (main cell)
lls (Fig. 4.1) have a total area of 156.25 cm2 and a th a of these conventional solar cells (i.e. total area les approximately, 150 cm2
.
ells is composed by a busbar and fingers (negative mm of width, respectively. The back of the solar c of width and a back surface field (Fig. 4.2).
30 - Back surface of the KVAZAR solar cells ( main cell)
a thickness of 200 m, less the area occupied
Theorical Characterization of Solartec and KVAZAR solar cells
Table 4.1 summarizes the main features (dimensions and materials) of the KVAZAR solar cells.
Table 4.1 - Dimensions and materials of KVAZAR solar cells
Dimensions
Cell Cell width (mm) 125
Cell length (mm) 125
Cell area (mm2) 15625
Thickness (mm) 0.20
Active area (mm2) 15000
Fingers Number of fingers 50
Finger width (mm) 0.04
Finger length (mm) 125
Distance between fingers (mm) 3 Area occupied by the fingers (mm2) 250
Busbar Number of busbars 2
Busbar width (mm) 1.50
Busbar length (mm) 125
Area occupied by the Busbar (mm2) 375
Materials
Waffer Single crystalline silicon (sc-silicon) Front grid contacts Cu + Ag
Rear contact AlSi alloy + Cu + Ag
Figure 4.31 - Drawing of the cut (and dimensions) performed in the solar cells
Each cell was identified with a reference number as showed in Fig. 4.4. This reference number takes into account the position of the new cell in the “main cell” as showed in Fig. 4.5.
Figure 32 - Reference of the KVAZAR solar cells.
KVZ.40 – 6.1
Company that provides the
solar cell
Total number of
Main Cell
Number of the Main Cell
Cell
Position of the solar cell
Theorical Characterization of Solartec and KVAZAR solar cells
Figure 33 – Number given to each cell according to its position at the conventional wafer.
Table 4.2 presents the physical characteristics of the solar cells obtained after the cutting process.
Table 4.2 - Physical characteristics of solar cells
Dimensio
ns
Cell Cell width (mm) 14
Cell length (mm) 62.50
Cell area (mm2) 875
Thickness (mm) 0.20
Active area (mm2) 814.13
Fingers Number of fingers 25
Finger width (mm) 0.04
Finger length (mm) 14
Distance between fingers (mm) 3 Area occupied by the fingers (mm2) 14
Busbar Busbar width (mm) 0.75
Busbar length (mm) 62.50
Area occupied by the Busbar (mm2) 46.88
1
2
3
4
5
6
7
8
The Solartec solar cells (Fig. 4.7) are conventional solar cells that can be optimized taking into account the concentration level under which they are intended to operate. In this case, the cells were optimized for 15 suns which is the concentration level that is expected in the HSUN technology. These solar cells are made of monocrystalline silicon and the metallization method is the screen printing.
Figure 35 - Front surface of the Solartec solar cells
The Solartec solar cells (Fig. 4.7) have a total area of 8.78 cm2 and a thickness of 180 m. The active area of these solar cells (i.e. total area less the area occupied by the contacts of the cell) is about 4.75 cm2
.
As in the case of KVAZAR solar cells, the Solartec solar cells presents a front surface of the solar cells is composed by a busbar and fingers (negative contact of the solar cell) with 1.5 mm and 0.02 mm of width, respectively. However, in these solar cells, the back of the solar cells is composed by an oval soldering pad with 3mm of diameter and a back surface field (Fig. 4.8).
Figure 36 - Back surface of the Solartec solar cells
Theorical Characterization of Solartec and KVAZAR solar cells
- Front grid design: the cells can have one or two busbar in the front surface (Fig. 4.9).
- Classes: there are five different classes 23, 24, 25, 26 and 27. This classification is provided
by Solartec according to the electrical performance of each solar cell. However, in this thesis only the classes 24 and 26 were analyzed.
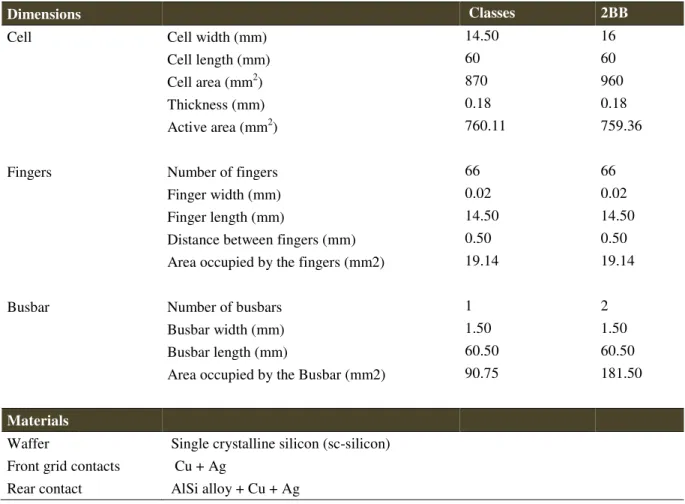
Table 4.3 summarizes the main features (dimensions and the materials) of the Solartec solar cells and the Fig. 4.9 presents the front grid designs of the Solartec solar cells.
Figure 37 –Solartec solar cells with different front grid designs: a) one busbar; b) two busbars
Table 4.3 –Dimensions and materials of Solartec solar cells
Dimensions Classes 2BB
Cell Cell width (mm) 14.50 16
Cell length (mm) 60 60
Cell area (mm2) 870 960
Thickness (mm) 0.18 0.18
Active area (mm2) 760.11 759.36
Fingers Number of fingers 66 66
Finger width (mm) 0.02 0.02
Finger length (mm) 14.50 14.50
Distance between fingers (mm) 0.50 0.50
Area occupied by the fingers (mm2) 19.14 19.14
Busbar Number of busbars 1 2
Busbar width (mm) 1.50 1.50
Busbar length (mm) 60.50 60.50
Area occupied by the Busbar (mm2) 90.75 181.50
Materials
Waffer Single crystalline silicon (sc-silicon) Front grid contacts Cu + Ag
present research focuses on the solar cells classified with the class 24 and class 26. As in the KVAZAR solar cells, the Solartec cells were also identified with a reference number (Fig. 4.10).
Figure 38 – Reference of the Solartec solar cells
SLT.C24 – 1
Company that provides the cell
Class of the solar cell
![Figure 12 - a) Diagram of equivalent circuit; b) Characteristic curve of the cell in total darkness Source: see reference [13]](https://thumb-eu.123doks.com/thumbv2/123dok_br/16581748.738577/46.892.162.731.257.494/figure-diagram-equivalent-circuit-characteristic-darkness-source-reference.webp)
![Figure 13 - a) Diagram of equivalent circuit b) Characteristic curve of the irradiated cell Source: see reference [13]](https://thumb-eu.123doks.com/thumbv2/123dok_br/16581748.738577/47.892.165.729.111.346/figure-diagram-equivalent-circuit-characteristic-irradiated-source-reference.webp)
![Figure 15 - Effect of variation of series resistance in the I-V curve Source: see reference [14]](https://thumb-eu.123doks.com/thumbv2/123dok_br/16581748.738577/48.892.249.626.199.529/figure-effect-variation-series-resistance-curve-source-reference.webp)