195
Metallurgy and materials
Metalurgia e materiais
Study of the thermomechanical
behavior of API 5L X80 steel
micro-alloyed with Nb-Ti
through hot torsion tests
Estudo do comportamento termomecânico
do aço API 5L X80 microligado ao Nb-Ti
através de ensaios de torção a quente
Fernanda Huebra Martins
Analista de Mercado da Arcelor Mittal Tubarão Serra – Espírito Santo – Brazil
Marcelo Lucas Pereira Machado
Professor Titular do Instituto Federal do Espírito Santo - IFES - Metallurgy and Materials Vitória – Espírito Santo – Brazil [email protected]
Abstract
The controlled rolling of high strength low alloy steel has been widely used in the production of large diameter pipes for the oil and gas industry. The thermo-mechan-ical control process (TMCP) is used to maximize grain reinement and achieve both higher strength and toughness in the steels. In this sense, API 5L X80 micro-alloyed Nb-Ti steel was submitted to hot torsion tests to evaluate its hot deformation behavior. The critical temperatures (Tnr, Ar3 and Ar1) were obtained by testing with multiple strains in continuous cooling. From the low stress curves generated in the isothermal tests, it was possible to obtain a critical strain that starts dynamic recrystallization, the peak strain for temperatures ranging from 1150ºC to 850ºC, and the strain rates at 0.2; 0.4 and 0.8s-1. The results showed that peak and critical stress values increase as
the temperature decreases and strain rate increases.
Keywords: Hot torsion test, API 5L X80 steel, dynamic recrystallization (DRX), low
stress curves.
http://dx.doi.org/10.1590/0370-44672015680191
Steels produced by controlled rolling are of great importance for the metallurgy due to their excellent performance at low production costs. These steels have many applications in the production of oil and gas pipelines.
Austenite hardening in the inish-ing rollinish-ing produces very high values for the rolling forces (GORNI, et al., 2009). An alternative to this situation is the use of steels with a relatively high niobium content, usually between 0.08 and 0.11%,
which increases the non-recrystallization temperature. This rolling type is known as High Temperature Processing (HTP). One of the main beneits of the HTP alloy project is the processing capacity at tem-peratures higher than the conventionally controlled rolling, which allows a reduc-tion in the rolling forces (SICILIANO, et al., 2008).
The objective of this study was to ind the critical processing temperatures of API 5L X80 steel microalloyed Nb-Ti
and evaluate its thermomechanical be-havior during hot deformation. For this purpose, hot torsion with multiples strains in continuous cooling and isothermal tests were done.
The value of Tnr can be determined by the chemical composition in Equa-tion 1 proposed by Borato, Barbosa and Santos, from the results obtained in hot torsion tests with multiple strains
(BORATO et al, 1988; MACCAGNO
et al, 1994):
1. Introduction
( )
C
C
(
Nb
Nb
) (
V
V
)
Ti
Al
Si
Tnr
º
=
897
+
464
.
+
6445
.
644
+
732
.
230
.
+
890
.
+
363
.
357
.
(1)
(2)
The value of Ar3 can be obtained from Equation 2 developed by Ouchi (MACCAGNO et al, 1994):
( )
º
910
310
.
80
.
20
.
15
.
55
.
80
.
0
.
35
(
8
)
3
C
=
C
Mn
Cu
Cr
Ni
Mo
+
t
The critical temperatures were obtained through multiple strains in continuous cooling tests, and iso-thermal tests produced the low stress curves, whereby it was possible to analyze the thermomechanical be-havior of the material. The dynamic recrystallization (DRX) and dynamic
recovery were veriied.
The Dynamic recrystallization is an important mechanism for control-ling the microstructure during hot de-formation. This softening mechanism has an important part in reducing the low stress, and austenite grain size. It is also useful for controlling the
me-chanical properties during processing. The prediction of the critical condi-tion for the beginning of the DRX is of great importance for industrial processes modeling (SARMENTO and EVANS, 1992), (SICILIANO and JONAS, 2000), (SHABAN and EGHBALI, 2010).
2. Materials and methods
The material used in the test was API 5L X80 steel (with high Nb) pro-duced in a Hot Strip Mill at ArcelorMit-tal Tubarão. The chemical composition (% in weight) was C < 0.10; Si < 0.30; Mn < 1.70; P < 0.018; S < 0.005; Al < 0.050; N < 0.0100; Nb ~0.09; Ti < 0.030 and Ca < 0.0050.
The torsion specimens were per-formed on a plate made from a coil of 15.88 x 1500 x 500 mm, with a length of 20 mm and diameter of 5 mm. The tests were done in an INSTRON model 55MT horizontal hot torsion machine, installed in the mechanical conforma-tion laboratory at the Instituto Federal do Espírito Santo (IFES). Specimens were enclosed in a quartz tube with a
continuous, inert Argon gas to avoid steel oxidation during induction heating. The temperature was monitored by a type K thermocouple that was inserted in a hole at the end of the specimen located immediately after the useful section. The test results corresponded to the measured values of the torque and angle that are converted into equivalent stress and equivalent strain, respectively.
For the multiple strain under continuous cooling test, the specimen was heated to a soaking temperature of 1240ºC at a heating rate of 3°C/s, and maintained at this temperature for 3 minutes. Then the specimen was cooled at a cooling rate of 1°C/s with a constant strain of 0.2 every 30 seconds at a strain
rate of 0.2s-1 from 1170ºC until 600°C.
For the isothermal test, the speci-mens were heated to a soaking tem-perature of 1240ºC at a heating rate of 3°C/s, and maintained at this tempera-ture for 3 minutes. Then the specimens were cooled at a rate of 1°C/s up to the test temperature and maintained at that temperature for 1 minute, to eliminate thermal gradients before the onset of deformation. Tests were carried out at 1150ºC; 1100°C; 1000°C; 950°C and 850°C for the same strain rate of 0.2s-1
and the maximum strain used during the test was 3. The tests were also car-ried out at 1150ºC and strain rate of 0.2s-1, 0.4s-1 and 0.8s-1 with the same
maximum strain.
3. Results and discussions
3.1 Test with multiple strains in continuous cooling
From these tests, the critical tem-peratures, Tnr, Ar3 and Ar1, were obtained. In Figure (1a), it is possible to see the result of the curves of true stress x true strain obtained through the hot torsion tests. As the stress increases, the temperature decreases until 750ºC. For temperatures below 1050ºC, starting
from the 5th pass, there is an accentuated
low stress increase, which characterizes a change of the recrystallization area to a hardening area; in other words, areas where there is no recrystallization. Soon afterwards, with temperature decrease, the low stress falls after 750ºC show-ing ferrite emergence, which is the start
of the intercritical area (γ + α) or Ar3 of the Fe3C diagram. Finally, the low stress increases again starting with the temperature of 690ºC, showing the cementite emergence, which is the be-ginning of the ferrite-cementite area or Ar1. This temperature is known as the transformation inal temperature γ→α.
Fig. 1
Curves generated in the hot torsion test with multiple strains in continuous cooling for a API 5L X80 steel. Strain rate of 0.2s-1, deformation of 0.2 in each pass. The tem-peratures (ºC) to which the strains were subjected are above each curve.
(a) True Stress versus True Strain. (b) Mean Flow Stress versus 1000x1/T.
0 50 100 150 200 250 300 350
0 0.5 1 1.5 2 2.5 3 3.5 4 4.5
T
rue Stress (MPa)
True Strain
1110 1080 1050 1020
990 960 930
900 870
840
1140 1170
810
780 750 720 690 660
630 600
197
For more accurate determination of the Tnr value, the Mean Flow Stress (MFS) was calculated. This is deined
as the area below the stress curve in relation to the plastic deformation as shown in the Equation 3 (SICILIANO
and JONAS, 2000), (SOLHJOO and EBRAHIMI, 2010):
MFS =
σ
=
ε
1
2
ε
2ε
1ε
1
σ
d
ε
(3)
Hence, a graph of the Mean Flow Stress (MFS) for each curve in function of the inverse temperature in Kelvin was obtained. In Graph (1b), there is a straight line veriied at high tempera-tures, where austenite recrystallization takes place and another straight line at lower temperatures, with a larger incli-nation than the irst, where austenite recrystallization doesn’t take place. Tnr is deined in the intersection of these two straight lines (SICILIANO and JONAS, 2000), (SOLHJOO and EBRAHIMI,
2010). As illustrated in this graph, Tnr is conirmed at 1050ºC. Also, Ar3 and Ar1 values can also be determined by the change in the curve behavior pattern at lower temperatures. The values obtained for the temperatures Ar1, Ar3 and Tnr were 690, 750 and 1050ºC, respectively.
Equation 1 for Tnr calculation could not be used, as the Nb (~0.09%) content in the steel was above the maximum for the equation’s validity (<0.05%).
In the HULKA and GRAY
ex-periment for a low carbon steel with Nb (0.09 / 0.10%) content similar to this work, the resulting Tnr value was 1060ºC (HULKA and GRAY, 2001). The variation between Tnr values of the present work and of previous experiment is approximately 1%.
Equation 2 provided a value of 747ºC at the beginning for tempera-ture of the phase transformation phase γ→α (Ar3). There is a 0.4% difference between values obtained by equation 2 (747ºC) and the torsion test (750ºC).
3.2 Isothermal tests
Through the isothermal test, it was possible to plot the true low stress curves versus true strain, where the peak stress (σp) and steady state
stress (σss) are identified. The flow
stress curves are represented in two graphs: Figure 2 displays the tests with different temperatures and rates
of constant strain, and Figure 3 shows different strains rates and constant temperature tests.
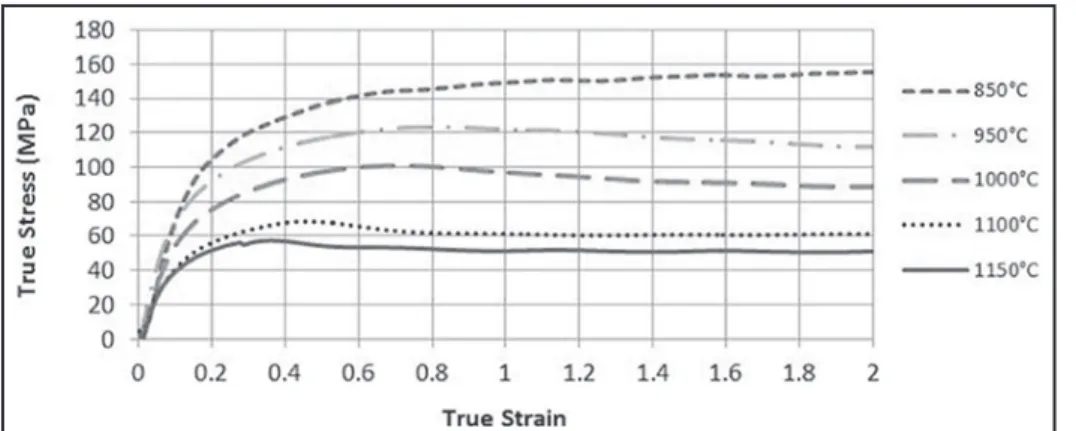
Fig. 2
True Stress Curves versus True Strain obtained by hot torsion tests for API 5L X80 steel at different temperatures and a constant strain rate of 0.2s-1.
0 50 100 150 200 250 300 350
0.60 0.70 0.80 0.90 1.00 1.10 1.20
Mean Flow Stress (MPa)
1000/T (K -1 )
Ar1 = 6900C
Ar3 = 7500C
Tnr = 10500C
Fig. 1 Curves generated in the hot torsion test with multiple strains in continuous cooling for a API 5L X80 steel. Strain rate of 0.2s-1, deformation of 0.2 in each pass. The
tem-peratures (ºC) to which the strains were subjected are above each curve. (b) Mean Flow Stress versus 1000x1/T.
Fig. 3 True Stress Curves versus True Strain obtained by hot torsion test for API 5L X80 steel with different strain rates at a temperature of 1150ºC. In Figure 2, there is an increase in peak stress as the temperature decreases, presenting a similarity to another study with hot torsion testing (BARCELOS, 2013). This behavior is expected, since the density and distribution of disloca-tions, as well as energy stored in the deformation process, are factors that depend directly on the temperature dur-ing metal deformation (PADILHA and SICILIANO, 2005). As temperature
decreases the dislocation mobility de-creases, generating a low stress increase and a displacement of the curves to the left, which shows that there is a greater hardening of the material.
At the 1150ºC and 1100ºC tem-peratures, the low stress curves show a typical feature for material that recrys-tallizes dynamically, in other words, initially the low stress increases with the strain until a maximum value and soon
afterwards its value decreases to a steady state stress. This behavior was expected because these temperatures are above the Tnr (1050ºC). For temperatures of 1000ºC, 950ºC and 850ºC the curves have a typical feature of material that recovers dynamically; that is, a larger hardening occurs at the start of defor-mation reaching peak stress. In lower temperatures, the hardening is greater because metal recovery becomes slower.
0 10 20 30 40 50 60 70 80
0 0.2 0.4 0.6 0.8 1 1.2 1.4 1.6 1.8 2
T ru e S tr e ss ( MP a ) True Strain 0.8 0.4 0.2
In Figure 3, the three resulting curves from tests with different strains rates and 1150ºC temperature show a shape typical of material that recrystallizes dynamically. This behavior was expected because the test temperature is above Tnr (1050ºC). The greater strain rates show that the low stress versus strain curves tend to move upward and to the right. Consequently, the greater the applied strain rate, the greater the steel peak stress. For dynamic recrystallization to occur, the low stress curves have to reach certain critical values; the ones which can be found through the Strain Hardening Rate (θ) x True Stress (σ). The strain hardening rate (θ) is deined by the derived stress in relation to strain (dσ/dε). The inlection point of this curve represents the point at which the stress curve versus strain changes behavior, given that only dynamic recovery occurs
(PADILHA and SICILIAN, 2005). In the curve θ x σ, at the point where the strain hardening rate is equal to zero corresponds to the peak stress (σp), and the inlection
point of the curve indicates the critical stress (σc) at which dynamic
recrystalliza-tion begins (PADILHA and SICILIAN, 2005; SHABAN and EGHBALI, 2010).
In Figure (4a), the strain hardening rate (θ) versus true stress (σ) curves are shown for tests carried out with a strain rate of 0.2s-1 for deformation temperatures
above Tnr and in (4b) for different strain rates and a temperature of 1150ºC. In Figure (4a), the strain hardening rate de-creases as the stress inde-creases initially in a linear way and soon afterwards in an approximately parabolic way, as expected. This behavior change of the curves is due to dislocation accumulation and the ap-pearance of subgrains. In the parabolic
sector of the curves, an inlection point is observed that corresponds to critical stress (σc) for the start of the dynamic
recrystal-lization. To determine the critical strain (εc), the critical stress value (σc) moves
towards the low stress curve versus strain and meets the critical deformation (εc).
Still in Figure (4a), the strain hardening rate (θ) decreases until a maximum stress value that corresponds to the peak stress (σp), where the strain hardening rate (θ) is
equal to zero.
In Figure (4b), there was a peak strain rate (0.8s-1) and the inlection point
was not observed. This behavior can be explained by the high strain rate, which tends to generate more dislocations in a short space of time, hindering the percep-tion of the inlecpercep-tion point in the curve. The recrystallization inluence is clearer with smaller strain rates (0.2 and 0.4s-1).
Fig. 4
Strain Hardening Rate Variation (θ) versus True Stress for API 5L X80 steel:
(a) for different temperatures at a cons-tant strain rate 0.2s-1.
(b) for different strain rates and a cons-tant temperature of 1150ºC.
(a) (b) -50 0 50 100 150 200 250 300 350 400 450
20 40 60 80
Strain Hardening Rate (MPa)
True Stress (MPa)
11500C
11000C
-50 0 50 100 150 200 250 300
0 20 40 60 80
Strain Hardening Rate (MPa)
True Stress (MPa)
199
For a better visualization of the critical stress (σc), we can calculate the
derivative of the strain hardening rate in function of the stress (dθ/dσ), and
plot the graph (dθ/dσ x σc), as can be
seen in Figure 5. The maximum point of the curve represents the critical stress (σc), which is used to determine the
critical strain (εc) corresponding to the low stress curve (σxε) (SHABAN and EGHBALI, 2010).
Fig. 5 Derived hardening rate (dθ/dσ) versus the true stress (σ) curves for API 5L X80 steel: (a) at different temperatures and a constant strain rate of 0.2s-1. (b) with different strains and a constant temperature of 1150ºC.
Using the curve details in Figures 2 to 5, Table 1 was elaborated with
thermo-mechanical parameters, such as peak stress (σp), critical stress (σc), peak
strain (εp), critical strain (εc) and steady
state stress (σss).
-50 -40 -30 -20 -10 0 10
20 40 60
d
θ
/d
σ
True Stress (MPa)
11500C
11000C -50
-40 -30 -20 -10 0
20 40 60 80
d
θ
/d
σ
True Stress (MPa)
0.2 0.4 0.8
(a) (b)
Temperature
(ºC) ε (s•-1) (MPa)σp (MPa)σc εp εc εc/εp (MPa)σss
1150 0.2 57.4 48.5 0.36 0.17 0.47 50.5
1150 0.4 58.8 49.8 0.46 0.23 0.50 53.1
1150 0.8 76.2 64.1 0.62 0.35 0.57 68.3
1100 0.2 68.3 59.7 0.45 0.24 0.53 61.1
1000 0.2 100.9 - 0.70 - - 88.6
950 0.2 123.4 - 0.80 - - 107.0
850 0.2 155.6 - 1.99 - - 155.6
According to Table 1 the values of peak and critical stress increase as the temperature decreases and the strain rate
increases. For lower carbon steels, the εc/εp
relationship is 0.83 and for niobium steels that value can reach 0.5 (PADILHA and
SICILIANO, 2005). For temperatures above Tnr, the value for the εc/εp
relation-ship is in agreement with literature.
4. Conclusions
Based on the results from the hot torsion tests, we can conclude that:
1. The critical temperatures of the API 5L X80 steel microalloyed Nb-Ti were Tnr = 1050ºC, Ar3 = 750ºC and Ar1 = 690ºC that present values close to those found in literature.
2. As expected, in the isothermal
tests the values of the peak stress and critical stress increase as the tem-perature decreases and as the strain rate increases, and values in relation to εc/εp were close to 0.5. The curves
generated in the tests show a similar behavior to other steel studies.
3. In the isothermal tests for
temperatures above Tnr (1050ºC), the main restoration mechanism is dynamic recrystallization. This can be conirmed through the shape of the low stress curve. Below this tem-perature, the curves showed a slower recovery, characteristic of dynamic recovery.
5. References
BARCELOS, M. V. Análise do comportamento mecânico de um aço estrutural através de ensaios de torção. REM – Revista Escola de Minas, v. 66, n. 3, p. 317-322, 2013.
BORATO, F., BARBOSA, R., YUE, S., JONAS, J. J. Effect of chemical com-position on the critical temperature of microalloyed steels. ISIJ International, p.383-390,1988.
GORNI, A. A., SILVEIRA, J. H. D., REIS, J. S. S. Metalurgia dos aços micro-ligados usados na fabricação de tubos soldados com grande Diâmetro. Revista Tubo & Companhia, v.5, n.26, p. 52-63, 2009.
HULKA, K., GRAY, J. M. High Temperature Processing of Line-Pipe Steels.
Niobium Science and Technology. TMS, 2001.
MACCAGNO, T. M., JONAS, J. J., YUE, S., MACCRADY, B. J., SLOBODIAN, R., DEEKS, D. Determination of recrystallization stop temperature from rolling mill logs and comparison with laboratory simulation results. ISIJ International, v. 34, n.11, p. 917-922, jul. 1994.
PADILHA, A. F., SICILIANO JR. F. Encruamento, recristalização, crescimento de grão e textura. (3 ed.). São Paulo: ABM, 2005. 232 p.
SARMENTO, F.H., EVANS, J.F. Proc. Int. Conf. On Processing, Microstruture and Properties of Microalloyed and Other High Strength Low Alloy Steels, Iron and Steel Soc. Of AIME, Warrendale, PA, USA, 1992. p.105.
SHABAN, M., EGHBALI, B. Determination of critical conditions for dynamic recrystalization of a microalloyed steel. Materials Science and Engineering, v. 527, 20 p. 4320–4325, 2010.
SICILIANO, F., JONAS, J.J. Mathematical modeling of hot strip rolling of microalloyed Nb, multiply-alloyed Cr-Mo, and plain C-Mn steels, Metallurgical and Materials Transactions A, 31A, p.511-530, 2000.
SICILIANO, F., STALHEIM, D.G., GRAY, J. M. Modern high strength steels for oil and gas transmission pipelines. In: INTERNATIONAL PIPELINE CONFER-ENCE, 7. Canada, 2008.
SOLHJOO, S., EBRAHIMI, R. Prediction of no-recrystallization temperature by simulation of multi-pass low stress curves from single-pass curves. 2010.