www.ambi-agua.net E-mail: ambi.agua@gmail.com
This is an Open Access article distributed under the terms of the Creative Commons Attribution License, which permits unrestricted use, distribution, and reproduction in any medium, provided the original work is properly cited.
Combined use of O
3/H
2O
2and O
3/Mn
2+in flotation of dairy
wastewater
ARTICLES doi:10.4136/ambi-agua.2078
Received: 27 Jan. 2017; Accepted: 21 Jan. 2018
Marta Cristina Silva Carvalho1; Alisson Carraro Borges1*; Magno dos Santos Pereira1;
Fernanda Fernandes Heleno1; Leda Rita D´Antonino Faroni1; Luiza Cintra Campos2
1Universidade Federal de Viçosa (UFV), Viçosa, MG, Brasil
Departamento de Engenharia Agrícola. E-mail: marta.carvalho@ufv.br, borges@ufv.br, magno.pereira@ufv.br, fernanda.heleno@ufv.br, lfaroni@ufv.br
2University College London (UCL), London, United Kingdom
Departament of Civil, Environmental and Geomatic Engineering. E-mail: l.campos@ucl.ac.uk *Corresponding author
ABSTRACT
This work investigated the degradation of organic matter present in synthetic dairy wastewater by the combination of ozonation (ozone (O3)/hydrogen peroxide (H2O2)) and catalytic ozonation (ozone (O3)/manganese (Mn2+)) associated with dispersed air flotation process. The effect of independent factors such as O3 concentration, pH and H2O2 and Mn2+
concentration was evaluated. For the flotation/O3/H2O2 treatment, the significant variables (p ≤ 0.05) were: O3 concentration (linear and quadratic effect), H2O2 concentration linear and
quadratic effect, pH values (linear and quadratic effect) and interaction O3 concentration versus pH. For catalytic ozonation, it was observed that the significant variable was the linear effect of O3 concentration. According to the desirability function, it was concluded that the optimal condition for the treatment of flotation/O3/H2O2 can be obtained in acidic solution using O3
concentrations greater than 42.9 mg L-1 combined with higher concentrations of H2O2 to 1071.5 mg L-1. On other hand, at pH values higher than 9.0, the addition of O3 may be neglected
when using higher concentrations than 1071.5 mg L-1 of H2O2. For flotation/ozonation catalyzed by Mn2+, it was observed that metal addition did not affect treatment, resulting in an optimum condition: 53.8 mg L-1 of O3 and pH 3.6.
Keywords: advanced oxidation processes, catalytic ozonation, physico-chemical treatment.
Uso combinado de O
3/H
2O
2e O
3/Mn
2+para flotação de águas
residuárias de laticínio
RESUMO
Rev. Ambient. Água vol. 13 n. 2, e2078 - Taubaté 2018
(linear e quadrático) e interação concentração de O3 versus pH. Para a ozonização catalítica, observou-se que houve diferença significativa no tratamento apenas para o efeito linear da concentração de O3. De acordo com a função de desejabilidade, concluiu-se que a condição ótima para o tratamento de flotação/O3/H2O2 pode ser obtida em meio ácido utilizando concentrações de O3 superiores a 42,9 mg L-1 associada com concentrações de H2O2 mais elevadas que 1071,5 mg L-1. No entanto, em valores de pH maiores do que 9,0, a utilização de O3 pode ser negligenciada quando se usam concentrações mais elevadas do que 1071,5 mg L-1 de H2O2. Observou-se também que a flotação/ozonização catalisada pela adição do metal Mn2+ não afetou o tratamento, obtendo-se como condição ótima de 53,8 mg L-1 O3 e pH 3,6.
Palavras-chave: ozonização catalítica, processos oxidativos avançados, tratamento físico-químico.
1. INTRODUCTION
Brazil is a major milk-producer, ranking fourth in the world, with the production of 35 billion liters in 2013 (FAO, 2013). The generation of wastewater from dairy products and derivatives is growing, so the management, recycling and treatment of these effluents have become a growing concern in Brazil and worldwide (Leal et al., 2006).
In the dairy industry, according to Matos et al. (2011), a relationship of about 1 to 5 can be observed between volumes of wastewater and milk processed, depending on the final product and the technological level of the industry. The polluting organic load that these effluents present is high, and in the case of inappropriate treatment or disposal, major environmental impacts can be seen in the areas near this type of industry.
Because biological treatment is economically viable, it is one of the most-used options for the removal of organic matter in dairy effluent. However, the so-called biological reactors may present some practical limitations. Biodegradation depends on a stable and diverse microbial population, the interaction between the various microorganisms present in the treatment system, pH, and temperature, among other factors, which are not always easily controlled. Furthermore, the long treatment time and space required for the implementation of the treatment plants may hamper the application of biological processes. Another common problem of this treatment is the oscillation of organic load in the effluents of dairy products, which may affect the balance of the microbial community present in the reactor and compromise the efficiency of biological processes (Villa et al., 2007).
Among physico-chemical treatments, the flotation used as primary treatment can be highlighted, where the separation of particles present in the effluent occurs through their adhesion to gas bubbles. The bubble-particle aggregate rises in the aqueous phase, thereby allowing separation of the particle.
To complement the treatment of dairy effluent, advanced oxidation processes (AOPs) have been a widely studied alternative because they are less selective, have an electrophilic property, and the kinetics of the reaction can be controlled. These processes generate hydroxyl radicals
(•OH) that are capable of oxidizing a wide variety of organic compounds into carbon dioxide
(CO2), water (H2O), and inorganic ions (Oliveira and Leão, 2009). The hydroxyl radicals originate from combinations between oxidants, such as ozone (O3), hydrogen peroxide (H2O2), and ultraviolet (UV) irradiation, with catalysts, such as metal ions or semiconductors (Glaze et al.1987 apud Melo et al., 2009).
Among the AOPs, ozone gas has been widely used in water and wastewater treatment. This gas is able to react with a wide range of organic compounds, mainly due to its high oxidative potential (E0 = 2.07 V), greater than KMnO4 and Cl2. Under certain conditions,ozone leads to
Rev. Ambient. Água vol. 13 n. 2, e2078 - Taubaté 2018
(E0 = 2.80 V) and tends to be more effective in treating certain recalcitrant compounds (Mahmoud and Freire, 2007).
The stability of the ozone depends on several factors, especially pH, because hydroxyl ions initiate the ozone decomposition process (Von Gunten, 2003). In an acidic environment, ozone will react with compounds that have specific functional groups, such as electrophilic, nucleophilic, or dipole addition (direct reaction with O3). However, at high pH (basic medium),
ozone decomposes into radicals •OH, which react with organic compounds unselectively.
H2O2 combined with ozone gas is widely used as a good source of radicals •OH, as it is
easily found, highly adaptable to existing ozonation equipment, and has the lowest cost of AOP
systems based on the radical •OH.
Another way to increase the ozonation efficiency is with the use of catalysts. Several studies have reported the use of several metal salts in ozonation of effluents. Hewes and Davinson (1972) showed that the effluent ozonation in the presence of Fe2+, Mn2+, Ni2+, and Co2+ resulted in an increase of total organic carbon removal efficiency compared to conventional ozonation process (without addition of a catalyst).
This study aimed to determine the optimal conditions for the degradation of organic matter present in synthetic dairy effluent, using flotation concomitantly with AOPs.
2. MATERIALS AND METHODS
Synthetic dairy wastewater (SDW) was prepared by adding 10.0 mL of Type A supplemented whole milk to distilled water to make 1.0 L of solution with COD concentrations close to 2000 mg L-1 (Brião and Tavares, 2007). After preparing the synthetic solution, the alkalinity of the sample was measured, having an average value of 75.56 mg L-1 CaCO3.
The ozone gas was obtained using an ozone generator (Model O&G 10.0 MRI, Ozone & Life, São José dos Campos, Brazil). Oxygen used as feedstock was obtained from a hub installed on the ozone generator body. The concentration of ozone gas in the air that was injected in the bottle washer during treatment was quantified as recommended by the International Ozone Association, using the iodometric method by indirect titration (APHA et al., 2012).
The ozonation was performed at a flow rate of 1.0 L min-1 in a bottle washer with a capacity of 1.0 L. A porous diffuser was placed inside the bottle close to the bottom from which the gas was introduced. Based on preliminary analysis, the ozonation period was set at 180 min.
The experimental design used was the central composite rotational design (CCRD), because this method allows for easier, more economical, and faster analysis of several variables (factors) with a variety of levels. The CCRD is an evolution of factorial experiments with 2 levels and n factors composed of three parts: Vertex points (complete or fractional factorial),
axial points (α = n1/2; allows tests of significance for quadratic or cubic curvature effects) and central points (executed with replicas allowing the estimation of the pure error and a lack of fit test of the model).
The resident concentration divided by the influent concentration or relative concentration of COD, denoted by COD (C/C0), was used as the dependent variable, applied at the startup of the batch, determined by the colorimetric method (APHA et al., 2012). The “C” represents the
COD of the samples measured at the end of the treatment and “C0” the COD of the samples at the start. The C/C0 parameter was chosen for its capacity to represent treatment efficiency and due to its mathematical advantages during statistical analysis. COD removal (%) = (1 - C/C0) x 100.
Rev. Ambient. Água vol. 13 n. 2, e2078 - Taubaté 2018
Tables 1 and 2 present the level values used in the CCRD for the ozonation experiments with H2O2 and Mn2+, respectively.
Table 1. Values used in the CCRD to three factors, using H2O2 as an
aide to the ozonation.
Variables Units Levels
-α = -1,68 -1 0 +1 α = +1.68
O3 (X1) mg L-1 0.0 10.9 26.9 42.9 53.8
H2O2 (X2) mg L-1 0.0 272.1 673.5 1071.5 1343.6
pH (X3) - 3.6 5.0 7.0 9.0 10.4
Table 2. Values used in the CCRD to three factors, using Mn2+ as
catalyst in the ozonation.
Variables Units Levels
-α = -1,68 -1 0 +1 α = +1.68
O3 (X1) mg L-1 0.0 10.9 26.9 42.9 53.8
Mn2+ (X
2) mg L-1 0.0 0.008 0.020 0.032 0.040
pH (X3) - 3.6 5.0 7.0 9.0 10.4
The variation ranges between the lower limit and the top of each independent variable were assumed based on literature (Assalin et al., 2006; Mahmoud and Freire, 2007) and preliminary tests.
The hydrogen peroxide solutions were prepared using H2O2 solution with 30% w/w, [H2O2] = 9.007 mol L-1 and density of 1.1 g mL-1. The manganese source was the monohydrate manganese sulphate (MnSO4.H2O).
Interference caused by H2O2 in COD analysis was eliminated by determining its concentration in the sample by the iodometric method and subsequent determination of its COD according to Equation 1 (Oliveira and Leão, 2009):
CODperoxide = – 4.06x10⁻⁵ [H2O2]2 + 0.4706 [H2O2] (1) To calculate the main effects of the factor, their interactions on the response variable (C/C0), as well as to obtain data relating to the analysis of variance (ANOVA), Statistica 10 (StatSoft, Inc., Tulsa, USA) and Minitab 17 (Minitab Inc., State College, PA, USA) software were used.
3. RESULTS AND DISCUSSION
Tables 3 and 4 present, for H2O2 and Mn2+ respectively, the values of COD removal and the C/C0 obtained for each trial suggested by the CCRD design.
It was noticed that among all the tests, the best results were in trial number 13 (Tables 3 and 4), where the ozone central points and the catalyst/auxiliary -α were used with -α pH of 3.6,
Rev. Ambient. Água vol. 13 n. 2, e2078 - Taubaté 2018 Table 3. Array of values to the concentrations of ozone, H2O2 and
the pH of the samples in the delineation of the CCRD.
Trial O3 H2O2 pH COD Removal (%) (C/C0)
1 10.9 272.1 5.0 62.5 0.37
2 10.9 272.1 9.0 15.2 0.85
3 10.9 1071.5 5.0 65.3 0.35
4 10.9 1071.5 9.0 24.9 0.75
5 42.9 272.1 5.0 59.6 0.40
6 42.9 272.1 9.0 43.3 0.57
7 42.9 1071.5 5.0 62.7 0.37
8 42.9 1071.5 9.0 64.5 0.35
9 0.0 673.5 7.0 6.5 0.93
10 53.8 673.5 7.0 43.9 0.56
11 26.9 0.0 7.0 15.5 0.84
12 26.9 1343.6 7.0 50.5 0.49
13 26.9 673.5 3.6 74.4 0.26
14 26.9 673.5 10.4 23.7 0.76
15 26.9 673.5 7.0 12.4 0.88
16 26.9 673.5 7.0 17.1 0.83
17 26.9 673.5 7.0 12.1 0.88
18 26.9 673.5 7.0 14.6 0.85
19 26.9 673.5 7.0 7.6 0.92
20 26.9 673.5 7.0 13.3 0.87
Table 4. Array of values to the concentrations of ozone, Mn2+
and the pH of the samples in the delineation of the CCRD.
Trial O3 H2O2 pH COD Removal (%) (C/C0)
1 10.9 0.008 5.0 12.9 0.89
2 10.9 0.008 9.0 14.7 0.87
3 10.9 0.032 5.0 4.3 0.98
4 10.9 0.032 9.0 17.9 0.84
5 42.9 0.008 5.0 28.7 0.73
6 42.9 0.008 9.0 39.9 0.61
7 42.9 0.032 5.0 45.9 0.55
8 42.9 0.032 9.0 43.4 0.58
9 0.0 0.020 7.0 0.7 1.00
10 53.8 0.020 7.0 49.0 0.52
11 26.9 0.000 7.0 26.5 0.75
12 26.9 0.040 7.0 26.3 0.75
13 26.9 0.020 3.6 73.9 0.27
14 26.9 0.020 10.4 17.9 0.84
15 26.9 0.020 7.0 33.7 0.68
16 26.9 0.020 7.0 30.3 0.71
17 26.9 0.020 7.0 26.5 0.75
18 26.9 0.020 7.0 30.3 0.71
19 26.9 0.020 7.0 30.1 0.71
Rev. Ambient. Água vol. 13 n. 2, e2078 - Taubaté 2018
3.1. COD degradation of the synthetic dairy wastewater by the flotation process/ozonation combined with H2O2
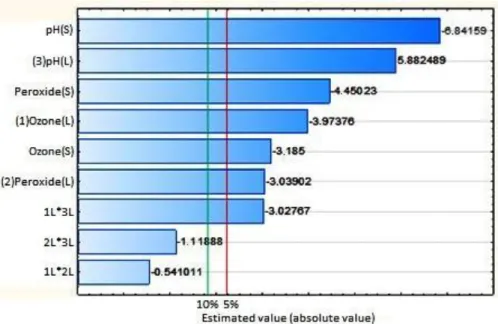
Figure 1 shows the Pareto chart for the regression performed, which presents the statistical significance of each term of the equation for α levels equal to 5 to 10%.
Figure 1. Pareto chart of the regression performed for COD degradation in the synthetic dairy effluent, using the flotation/ozonation combined with H2O2. “L” is the linear
coefficient part of the model and “S” is the square coefficient
part of the model.
As can be seen in Figure 1, just the linear model coefficients for the interaction of H2O2
with ozone and pH was not significant for an α of 5% or 10%, indicating that in the treatment
process the three factors had an significant effect and there was a significant interaction between ozone and pH at the range of values tested. The removal of the least-significant term (peroxide-ozone interaction) did not cause changes in the model-fitting. Thus, it was decided to withdraw these two terms from the modeling (peroxide-ozone interaction and interaction peroxide - pH).
Table 5 shows the coefficients values used to evaluate the quality of the model fits to the data, also considering the raw data and transformed data (Box-Cox transformation considering
λ = 0.5). The two regressions were significant at the 5% level.
Table 5. Model-fitting results.
Model/Statistic Model with natural response Model with transformed response
R2 (%) 92.14 92.58
R2 adjusted (%) 87.55 88.25
Fcalc/Fcrit (regression) 5.15 7.46
Fcalc/Fcrit (lack of fit) 2.94 3.41
S (standard error of regression) 0.0836 0.0533
Rev. Ambient. Água vol. 13 n. 2, e2078 - Taubaté 2018
Based on data presented in Table 5, the model for the COD removal from the dairy effluent using flotation and combined ozonation O3/H2O2 was significant, with a 95% confidence level, because for the regression the Fcalculated is greater than that of Fcricitcal. However, the lack of fit was also significant (Fcalculated/Fcritical > 1), although ideally Fcalculated should be a smaller value than the Fcricitcal, i.e. not significant. However, since the averages of the means were very close and the pure error was very small (0.0003), the model was considered valid for predictive purposes (Barros Neto et al., 2007). The mean square experimental error was very small; thus, the significance tests for the lack of fit may be deemed irrelevant (Waszczynsky and Nelsen, 1996).
The regression coefficient (R2) indicates that 92.58% of the variation observed in the data could be explained by the model (Table 5). According to Barros Neto et al. (2007), R2 measures the proportion of the total variation of the response that is explained by the model. Thus, the closer to 1 the R2 value is, the smaller the error and better the model will be. According to these authors, models with R2 < 0.60 should be used only as trend indicators, never for predictive purposes.
With the obtained results, it was possible to determine the regression coefficients and to present the model with variables not coded. The empirical mathematical model, uncoded and in 2nd order, was found to represent the root of the relative concentration of COD in terms of ozone concentrations, H2O2, and solution pH with their respective statistical coefficients (Equation 2).
(C/C0)0.5 = - 1.11900 + 0.01901 [O3] + 0.00040 [H2O2] + 0.45270 [pH] - 0.00017 [O3]2 - 1.2x10 -5 [H2O2]2 - 0.02535 [pH]2 - 0.00188 [O3] [pH] (2) Maintaining the pH in the fixed central point (pH 7) and varying the concentrations of ozone and H2O2, the contour plot for the dependent variable (i.e. COD (C/C0)) is shown in Figure 2 (A). Figure 2 (B) displays the contour plot, keeping the concentration of H2O2 fixed at the midpoint (i.e. 673.5 mg L-1) and varying the ozone concentration and the pH of the effluent. According to Figure 2 (A), in a neutral solution (pH 7) the relative concentration of COD (C/C0) decreased with increasing concentrations of both ozone and H2O2. This is consistent with the positive values of the regression coefficients obtained for the O3 and H2O2 (Equation 2).
A) B)
Figure 2. Contour plot showing the effect of the concentrations of ozone and H2O2
on the relative concentration of COD (C/C0) with central point fixed at pH 7. (A).
Contour plot showing the effect of ozone concentration and pH on the relative concentration of COD (C/C0), maintaining the fixed H2O2 concentration at the
Rev. Ambient. Água vol. 13 n. 2, e2078 - Taubaté 2018
A similar result was observed in the work of Cortez et al. (2010), when the increase of H2O2 concentration (200 - 400 mg L-1) - led by the use of combined ozonation (O3/H2O2) with 112 mg L-1 ozone, at pH 7 for 60 min to treat landfill leachate - increased the removal efficiency of COD by 16%.
By further analyzing the contour plot in Figure 2 (A), it can be seen that using an ozone concentration of 26.9 mg L-1 (midpoint) to treat the dairy synthetic effluent was more efficient at lower pH values, independent of the added H2O2 concentration. A similar result was observed by Torres-Sanchez et al. (2014) using the combination of ozone with Fenton (H2O2/Fe2+) in acidic solution (pH 3) applied to synthetic dairy effluent. These authors observed a reduction of up to 30% of COD in the effluent after 25 min of treatment.
On the other hand, the treatment using ozone (26.9 mg L-1) in a basic solution proved to be advantageous only for the removal of COD at high concentrations of H2O2 and high pH levels (pH > 9), presenting a quadratic behavior, which indicates a "valley bottom" for H2O2 values close to 500 mg L-1.
It can be seen from Figure 2 (B) that flotation/ozonation combined with H2O2 was favored under acidic conditions (pH < 5), independent of the concentration of ozone applied. However, the treatment was effective only at high concentrations of ozone and higher pH. In alkaline solutions H2O2 becomes more unstable than in acidic solutions (Cavalcante, 2005). Furthermore, H2O2 standard electrode potential ranges from 1.78 V to 0.87 V when pH changes from 0 to 14, which makes the treatment of effluents with H2O2 most promising at low pH values.
It is noteworthy that the only interaction with significant effect was ozone and pH (Equation 2), presenting a coefficient of -0.002 (negative). Since ozone and pH concentrations are positive, it appears that the ozonation process is acting indirectly at high pH values and high concentrations of ozone (via hydroxyl radicals) (Balcioglu and Ötker, 2003).
During the ozonation macro- or microbubbles are formed, so the process of flotation can also occur if the coagulation/flocculation characteristics of the wastewater favor the adhesion of the bubbles to the particles/flocs, producing the so-called Ozoflotation process (Edzwald and Harrhoff, 2012). During the ozoflotation process, part of the organic matter (i.e. suspended matter) is removed by flotation by a physical treatment and the other part of the organic matter (i.e. dissolved matter) is removed by the ozone oxidation in a chemical treatment.
For good coagulation, chemistry conditions, and higher flotation efficiencies, it is expected
that the flocs formed have little or no electrical charge, so electrostatic forces are low or near
zero (Edzwald, 2010). According to Quirk and Matusky (1971), casein is the major protein found in milk (about 80%) and has an average isoelectric point at pH 4.6, so at this pH casein is found at its point of lowest solubility due to the decrease of intermolecular repulsions.
Therefore, a possible explanation for the acidic solution to have produced the best results in the removal of COD from the synthetic dairy effluent is that it is due to the natural coagulation/flocculation of milk proteins in the dairy effluents in an acid medium that favored the flotation process and enhanced the global treatment efficiency (Puget et al., 2004). 3.2. Degradation of COD in the synthetic dairy wastewater by the flotation process/ozonation catalyzed by Mn2+
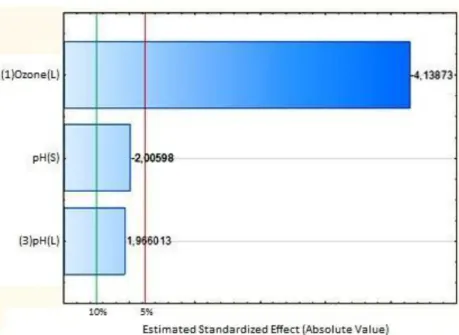
The attempt to fit a full quadratic regression model was not successful due to the lower R2 value of the model that was equal to 42.91% and significance was only observed for the linear term of the ozone concentration. Thus, it was decided to withdraw most of the terms, concurrent with the adoption of a changed response by Box-Cox transformation, considering λ = 0.5. In
Rev. Ambient. Água vol. 13 n. 2, e2078 - Taubaté 2018 Figure 3. Pareto chart corresponding to the transformed
response (Box-Cox transformation considering λ = 0.5) for
the degradation of COD in synthetic dairy effluent using the flotation/ozonation catalyzed by Mn2+.
Table 6 shows the results of the model fitting to the observed data.
Table 6. Model fitting results.
Model/Statistics Model Transform Response
R2 (%) 61.08
R2 adjusted (%) 53.78
Fcalc/Fcrit (regression) 2.88
Fcalc/Fcrit (lack of fit) 9.17
S (standard error of regression) 0.0728
For the regression model, the Fcalculated divided by the Fcritical, at 5% of probability, was higher than 1, so the model was significant. Despite the lack of adjustment showing significance (Fcalc/Fcrit > 1), the value obtained for the mean square of the pure error was very low (0.0002), so the model can be considered valid for predictive purposes.
The coefficient of determination obtained (Table 6) showed that only 61.08% of the observed data could be explained and the model could be used for predictive purposes. (Barros Neto et al., 2007).
One clearly sees that this fitting model, even after transformation of the response variable, was inferior to the experiment used for flotation/ozonation combined with H2O2. Another indication of the low-response modeling was the Fcalc/Fcrit of the regression, equal to 2.88 (Table 6). According to Barros Neto et al. (2007), good model fits have Fcalc/Fcrit greater than or equal to 4.
Rev. Ambient. Água vol. 13 n. 2, e2078 - Taubaté 2018
(C/C0)0.5 = 0.409 - 0.005 [O3] + 0.152 [pH] - 0.009 [pH]2 (3) As seen in Figure 3 and Equation 3, even after the Box-Cox transformation, the concentration of Mn2+ added to catalyze the treatment of flotation/ozonation was not significant for the removal of COD. This contradict the work of Assalin et al. (2006), and Mahmoud and Freire (2007) who found that the addition of Mn2+ in concentrations greater than 0.5 mg L-1 as a catalyst for ozonation effluent was more efficient in removing total organic carbon (TOC) compared to conventional ozonation processes.
Assalin et al. (2006) also compared the TOC degradation efficiency by conventional ozonation process and catalyzed by Mn2+ at a concentration of 1.0 mg L-1 in an acidic solution (pH 3). The catalytic ozonation enhanced the removal of the organic load increasing from 4% to 63% efficiency in only seven minutes of ozonation. Also the addition of metals to the ozonation process increases the formation of hydroxyl radicals according to the complexation mechanism proposed by Pines and Reckhow (2002), acting as inhibitors of certain anions (carbonates and bicarbonates) that are capable of interfering with the oxidizing ability of the hydroxyl radicals.
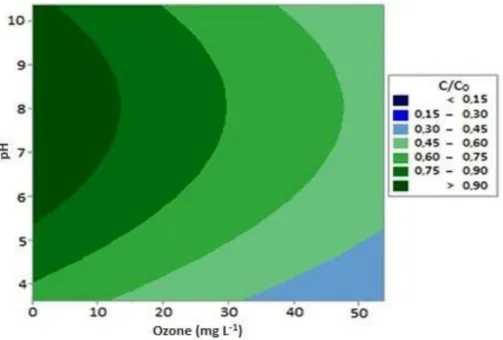
One explanation for the insignificant effect of the catalyst during the ozonation process may be the low concentration of Mn2+used in this experiment (≤ 0.040 mg L-1). According to Xiao et al. (2012), Mn2+ concentrations greater than 0.05 mg L-1 were effective in aiding ozone degradation of compounds that are difficult to degrade. On the other hand, the same authors found that concentrations greater than 0.1 mg L-1 showed no significant increase in efficiency. Figure 4 shows the variation of the relative concentrations (C/C0) of COD with pH and concentration of ozone gas.
Figure 4. Contour plot showing the effect of ozone concentration and pH on the relative concentration of COD (C/C0).
It is observed in Figure 4 that the increased ozone concentration positively influenced the removal of organic matter of the SDW, indicating the action of the ozone as an oxidant (chemical treatment) in the ozoflotation process.
Rev. Ambient. Água vol. 13 n. 2, e2078 - Taubaté 2018
conditions (pH < 4), indicating a possible better oxidation of the organic matter of the SDW through direct action of the ozone.
Similarly to the combined treatment O3/H2O2 which also showed better results under acidic conditions, part of this result can be explained also by the removal of organic matter due to the
casein’s clotting ability in acidic media (Puget et al., 2004). Thus, part of the COD of the SDW
was removed by flotation in the washer bottle.
3.3. Optimization of the flotation/ozonation process combined with H2O2 and catalyzed by
Mn2+ according to their respective independent variables using the function desirability
The estimate of the optimal conditions for the removal of COD in the SDW was based on the proposed statistical model and with the aid of the simultaneous optimization technique called "desirability function".
The desirability profiles were obtained from the Statistica 10 program through the function called "profiles for predicted values and desirability". This function indicates, based on the statistical analyses, which combination of values from the tested parameters gives the best response for the treatment being studied.
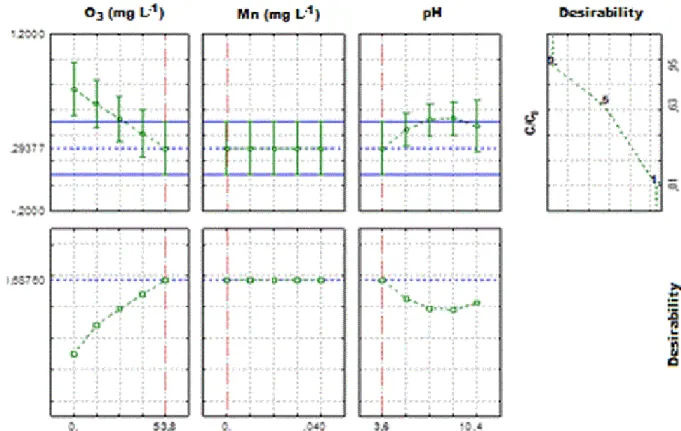
Figures 5 and 6 show the diagrams of the desirability function for describing the optimal conditions for the relative concentration of COD (C/C0) after flotation/ozonation combined with H2O2 and flotation/ozonation catalyzed by Mn2+, respectively, within the value ranges stated in the experiments.
Rev. Ambient. Água vol. 13 n. 2, e2078 - Taubaté 2018
Figure 6. Profiles for desirability and predicted values for COD relative concentration (C/C0)
obtained from the flotation/ozonation process catalyzed by Mn2+.
Considering the confidence limit for the optimum value, the most desirable values for the three factors of interest are shown in Figure 6. The profile located on the right shows the range
of the desirability response (0 < D < 1). The larger the “D” value, the more convenient the
system response is; i.e., the maximum value of D is the optimal condition of the system. For the second group, the dashed blue line presents optimum values where trends are revealed only by the factors (Figures 5 and 6). The vertical dotted lines present in the graphic corresponding to the optimum values of the parameters studied.
The concentration of ozone (Figure 5) required to achieve the ideal desirability response
(D = 1.0) should be greater than 42.9 mg L-1 with H2O2 concentration exceeding 1071.5 mg L-1 for a high pH values of the synthetic dairy effluent (pH > 9.0).
For flotation/ozonation catalyzed by Mn2+, the desirability graph (Figure 6) suggests optimum values using 53.8 mg L-1 O3 with any concentration of Mn2+ (0 to 0.04 mg L-1) at pH 3.6 to give better removal efficiency of COD (D = 0.6876).
Tables 7 and 8 were obtained making use of the desirability function, where possible solutions are presented based on optimal points found for processes of flotation/ozonation combined with H2O2 and catalyzed by Mn2+, respectively.
Table 7. Examples of independent variables values that resulted in a great desirability for the process of flotation/ozonation combined with H2O2.
Solution O3 - mg L-1 H2O2 - mg L-1 pH Desirability - D
1 6.4 1343.6 3.6 1.00
2 0.5 1326.4 3.8 0.99
Rev. Ambient. Água vol. 13 n. 2, e2078 - Taubaté 2018 Table 8. Example of independent variable
values that resulted in an ideal desirability for the flotation process/ozonation catalyzed by Mn2+.
Solution O3 - mg L-1 pH Desirability - D
1 53.8 3.6 0.69
It can be seen in Table 7 that there was no need for the addition of ozone in strongly acidic medium (Solutions 1 and 2). However, the treatment should consist of flotation combined with high ozone concentration to achieve COD removal desirable in a basic medium (Solution 3).
In the process of flotation/ozonation catalyzed by Mn2+ (Table 8), manganese had no significant effect on the removal of the COD of the effluent, confirming the results above. Therefore, the desirability function presents a solution for obtaining a maximum desirability for the case where the optimum point would be at high ozone concentrations and acidic conditions. Thus, it is suggested that further experiments be conducted to evaluate the optimal conditions of treatment to the operational and economic feasibility of the process.
4. CONCLUSIONS
For the process of flotation/ozonation combined with H2O2, the optimal treatment point was found to be for high concentrations of O3 (more than 42.9 mg L-1) and H2O2 (greater than 1071.5 mg L-1) in acidic solutions. However, in basic solutions (pH > 5.0) the addition of ozone gas can be neglected.
In the process of flotation/ozonation catalyzed by Mn2+, the addition of metal Mn2+ was not efficient, so the maximum removal efficiency of COD was obtained using concentrations of O3 equal to 53.8 mg L-1 in an acidic solution (pH 3.6), independent of the concentration of Mn2+ used.
In general, the best COD removal efficiencies were obtained by the process of flotation/ozonation combined with H2O2 compared to the process of flotation/ozonation catalyzed by Mn2+ for the synthetic dairy effluent. An acidic environment was more efficient for both processes (O3/H2O2 and O3/Mn2+), due to the organic load removal of the synthetic effluent, by the precipitation of milk casein which was subsequently removed by flotation in the bottle gas scrubber.
5. REFERENCES
AMERICAN PUBLIC HEALTH ASSOCIATION – APHA; AMERICAN WATER WORKS ASSOCIATION – AWWA; WATER ENVIRONMENT FEDERATION – WEF. Standard methods for the examination of water and wastewater. 22nd ed. Washington, 2012. 1496p.
ASSALIN, M. R.; SILVA, P. L.; DURAN, N. Comparação da eficiência do processo de ozonização e ozonização catalítica (Mn II e Cu II) na degradação de fenol. Química Nova, v. 29, p. 24-27, 2006. http://dx.doi.org/10.1590/S0100-40422006000100006 BARROS NETO, B. de; SCARMINIO, I. S.; BRUNS, R. E. Como fazer experimentos:
pesquisa e desenvolvimento na ciência e na indústria. 3. ed. Campinas: UNICAMP, 2007. 480 p.
Rev. Ambient. Água vol. 13 n. 2, e2078 - Taubaté 2018
BALCIOGLU, I. A.; ÖTKER, M. Treatment of Pharmaceutical wastewater containing antibiotics by O3 and O3/H2O2 processes. Chemosphere, v. 50, n. 1, p. 85-95, 2003. https://doi.org/10.1016/S0045-6535(02)00534-9
CAVALCANTE, A. M. Técnicas oxidativas para a remoção de matéria orgânica de uma corrente de soda exausta de refinaria de petróleo. 2005. 127f. Dissertação (Mestrado) - Universidade Federal do Rio de Janeiro, 2005.
CORTEZ, S.; TEIXEIRA, P.; OLIVEIRA, R.; MOTA, M. Ozonation as polishing treatment of mature landfill leachate. Journal of Hazardous Materials, v. 182, n. 1-3,p. 730-734, 2010. https://doi.org/10.1016/j.jhazmat.2010.06.095
EDZWALD, J. K. Dissolved air flotation and me. Water Research, v. 44, p. 2077-2100, 2010. https://doi.org/10.1016/j.watres.2009.12.040
EDZWALD, J. K.; HARRHOFF, J. Dissolved air flotation for water clarification. New York: Mac Graw Hill, 2012. p. 182.
FOOD AND AGRICULTURE ORGANIZATION - FAO. Faostat. Rome, 2013.
HEWES, C. G.; DAVISON, R. R. Renovation of wastewater by ozonation. Water AIChE Symposium Series, v. 129, p. 71-80, 1972.
LEAL, M. C. M. R.; FREIRE, D. M. G.; CAMMAROTA, M. C.; SANT’ANNA Jr., G. L.
Effect of enzymatic hydrolysis on anaerobic treatment of dairy wastewater. Process
Biochemistry, v. 41, n. 5, p. 1173–1178, 2006.
https://doi.org/10.1016/j.procbio.2005.12.014
MAHMOUD, A.; FREIRE, R. S. Métodos emergentes para aumentar a eficiência do ozônio no tratamento de águas contaminadas. Química Nova, v. 30, n. 1, p. 198-205, 2007. https://doi.org/10.1590/S0100-40422007000100032
MATOS, A. T.; ABRAHAO, S. S.; PEREIRA, O. G. Desempenho agronômico de capim-napier (Pennisetum purpureum) cultivado em sistemas alagados construídos. Engenharia na Agricultura, v. 19, n. 5, 2011.http://www.locus.ufv.br/handle/123456789/15663
MELO, S. A. S.; TROVO, A. G.; BAUTITZ, I. R.; NOGUEIRA, R. F. P. Degradação de fármacos residuais por processos oxidativos avançados. Química Nova, v. 32, n. 1, p. 188-197, 2009. http://dx.doi.org/10.1590/S0100-40422009000100034
OLIVEIRA, D. M. E.; LEÃO, M. M. D. Avaliação da biodegradabilidade de efluentes têxteis do beneficiamento secundário de malhas de poliéster tratados com reagente de fenton. Química Nova, v. 32, n. 9, p. 2282-2286, 2009. https://doi.org/10.1590/S0100-40422009000900008
PINES, D. S.; RECKHOW, D. A. Effect of dissolved cobalt (II) on the ozonation of oxalic acid. Environmental Science Technology, v. 36, n. 19, p. 4046-4051, 2002. https://doi.org/10.1590/S0100-40422009000900008
PUGET, F. P.; MELO, M. V.; MASSARANI, G. Modelling of the dispersed air flotation process applied to dairy wastewater treatment. Brazilian Journal of Chemical Engineering, v. 21, n. 02, p. 229-237, 2004. http://dx.doi.org/10.1590/S0104-66322004000200012
Rev. Ambient. Água vol. 13 n. 2, e2078 - Taubaté 2018
TORRES-SÁNCHEZ, A. L.; LÓPEZ-CERVERA, S. J.; LA ROSA, C.; VEGA, M. M.; SANTOYO, M. M.; HERNANDEZ, J. M. P. Electrocoagulation process coupled with advanced oxidation techniques to treatment of dairy industry wastewater. International Journal of Electrochemical Science, v. 9, n. 7, p. 6103–6112, 2014.
VILLA, R. D.; SILVA, M. R. A.; NOGUEIRA, R. F. P. Potencial de aplicação do processo foto-fenton/solar como pré-tratamento de efluente da indústria de laticínios. Química Nova, v. 30, n. 8, p. 1799-1803, 2007. http://dx.doi.org/10.1590/S0100-40422007000800002
VON GUNTEN, U. Ozonation of drinking water: Part I. Oxidation kinetics and product formation. Water Research, v. 37, n. 7, p. 1443-1467, 2003. https://doi.org/10.1016/S0043-1354(02)00457-8
XIAO, D.; LIU, G. B.; FENG, W.; XU, X.; YAO, W. Coupled spin and valley physics in monolayers of MoS 2 and other group-VI dichalcogenides. Physical Review Letters, v. 108, n. 19, p. 196802, 2012. https://doi.org/10.1103/PhysRevLett.108.196802