*Embrapa, Brasília, DF, Brasil Recebido: 31/10/2012; Aceito: 5/3/2013
The meat market: a dea international perspective and
an econometric behavioral model for Brazil
Geraldo da Silva e Souzaa, Eliane Gonçalves Gomesb*,
Dirceu João Duarte Talaminic, Renner Marrad
a[email protected], Embrapa, Brasil b*[email protected], Embrapa, Brasil c[email protected], Embrapa Suínos e Aves, Brasil
d[email protected], Embrapa, Brasil
Abstract
We describe the relative participation of the Brazilian meat market (beef, pork and chicken) in total agribusiness exports and in total country exports. An analysis of the world meat market is carried out from the point of view of the values of consumption, production, exports and imports. A DEA (data envelopment analysis) approach is then used to generate classifications of the importance of countries in the meat world market, and the insertion of Brazil into this market is viewed from these perspectives. A partial equilibrium model for the meat market is fitted to Brazilian data by a three-stage least squares procedure. The model is consistent with the data and is used for simulation purposes. In this context, we investigate the joint and separate effects of changes in the corn price and in the exchange rate on the market of endogenous variables, ceteris paribus.
Keywords
Three-stage least squares. Simultaneous system of equations. Data envelopment analysis. Meat market.
1. Introduction
Researchers and institutions have been showing a growing interest in the use of prediction and of partial equilibrium models for agricultural commodities. Typical examples are provided by Contini et al. (2006), Gazzola et al. (2006), G. S. Souza et al. (2008), Heisey, Wang and Fuglie (2011), Organisation for Economic Co-operation and Development/Food and Agriculture Organization of the United Nations (2011), and Ministério da Agricultura, Pecuária e Abastecimento (BRASIL, 2011). The advantage of having a partial equilibrium model available relative to unstructured time series models is the possibility of using it to assess the effects of sector polices through simulation. Indeed, this is the general motivation behind computable equilibrium models, and is frequently carried out in the context of a plethora of applications in agriculture, going from outlook scenarios to risk management.
The problem with the use of computable equilibrium models is that they do not use current information on
parameters, and as a result, it is our experience, the models are seldom supported by the data. Typically in such models important elasticities are computed elsewhere and freely used to specify equations. The Aglink/2006 outlook for the meat market, for example, is examined in detail in Gazzola et al. (2006). They showed in their article that the elasticities estimated from regressions differ markedly from the ones used in the specification of the meat market models and, frequently, sign inversions occur, indicating probable specification errors.
achieved a reasonable degree of agreement for all equations (consumption, supply and exports) for all products which are jointly estimated. Our statistical findings improve previous results obtained by G. S. Souza et al. (2008). We consider a joint effect on the endogenous variables resulting from the increase in 10% in the price of corn and a reduction of 10% in the exchange rate to illustrate the use of our model in simulations. Effects of this type are of particularly importance for the meat sector, where a concern is frequently raised regarding the increase in input prices associated with the potential increase in corn prices due, for example, the increasing use of corn in ethanol production by the US. Another frequent complain has to do with the over valorization of the Brazilian real relative to the US dollar, generating unfair competition for Brazilian exports. This approach is also an improvement over G. S. Souza et al. (2008).
Parallel to this domestic market analysis we develop and suggest an approach for the assessment of the relative importance of actors (countries) in the international meat trade. This assessment is of interest since it may be used to identify competitive actors and new trade possibilities for Brazil. The methodology proposed is based on ranks and on Data Envelopment Analysis models.
The results of the different approaches used here to analyze the meat market do not directly influence
each other. They are useful, however, to provide understanding of the different aspects of this market (overall perception), to describe local characteristics and the international insertion of Brazil (indicating competitors and potential consumer markets), and to explain the domestic market in terms of equilibrium equations and possible impacts of exogenous variables.
The article proceeds as follows. In Section 2 we update the descriptive results of G. S. Souza et al. (2008) on the meat market. In Section 3 we discuss the world market of meat jointly and separately by type of meat, pinpointing the main actors in the market, highlighting in particular the Brazilian performance. In Section 4 we specify and estimate the partial equilibrium model for the Brazilian meat sector. Finally, in Section 5 we summarize the main findings of our statistical exercise.
2. Meat market – a domestic perspective
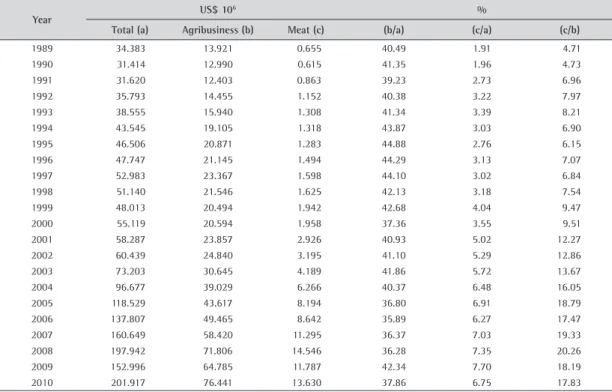
Table 1 updates the corresponding data showed in G. S. Souza et al. (2008). The statistics are informative on the importance of the agribusinesses in total exports. It varies in the range 35% to 45% for the 22 years period investigated. Meat in recent years is responsible from 17.5% to near 20% of this market. In this context, one captures the economic importance
Table 1. Brazil: total exports (a), agribusinesses’ total exports (b) and meat exports (c).
Year US$ 10
6 %
Total (a) Agribusiness (b) Meat (c) (b/a) (c/a) (c/b)
1989 34.383 13.921 0.655 40.49 1.91 4.71
1990 31.414 12.990 0.615 41.35 1.96 4.73
1991 31.620 12.403 0.863 39.23 2.73 6.96
1992 35.793 14.455 1.152 40.38 3.22 7.97
1993 38.555 15.940 1.308 41.34 3.39 8.21
1994 43.545 19.105 1.318 43.87 3.03 6.90
1995 46.506 20.871 1.283 44.88 2.76 6.15
1996 47.747 21.145 1.494 44.29 3.13 7.07
1997 52.983 23.367 1.598 44.10 3.02 6.84
1998 51.140 21.546 1.625 42.13 3.18 7.54
1999 48.013 20.494 1.942 42.68 4.04 9.47
2000 55.119 20.594 1.958 37.36 3.55 9.51
2001 58.287 23.857 2.926 40.93 5.02 12.27
2002 60.439 24.840 3.195 41.10 5.29 12.86
2003 73.203 30.645 4.189 41.86 5.72 13.67
2004 96.677 39.029 6.266 40.37 6.48 16.05
2005 118.529 43.617 8.194 36.80 6.91 18.79
2006 137.807 49.465 8.642 35.89 6.27 17.47
2007 160.649 58.420 11.295 36.37 7.03 19.33
2008 197.942 71.806 14.546 36.28 7.35 20.26
2009 152.996 64.785 11.787 42.34 7.70 18.19
2010 201.917 76.441 13.630 37.86 6.75 17.83
of the meat market. The meat market is dominated by beef followed by poultry and pork.
Table 2 conveys information on the proportional values of production of each meat type at export prices adjusted for 2011 US dollars. The profile of the shares is approximately constant in the last years and close to 59% for beef, 33% for poultry and 8% for pork. These figures motivate the need for a continuous observation on the variables composing the meat market, and for proper assessment of their agents’ behavior. That is the fundamental economic reason why organizations, like the Brazilian Ministry of Agriculture and the Brazilian Agricultural Research Corporation (Embrapa), are interested in the development of econometric models to describe this market.
G. S. Souza, Salustiano and Moreira (2012) assess the technical efficiency of the major Brazilian companies that operate in the international meat market – Minupar, Excelsior, Friboi, Marfrig, Minupar, Minerva and Brazil Foods. For this purpose they use a stochastic frontier model with a normal-half-normal error structure with variances depending on exogenous factors. The companies found to be fully efficient are Minupar and Excelsior. Each of the other major groups shows decreasing levels of efficiency in the period 2007-2011. All companies are publicly traded on the Bolsa de Valores de Sao Paulo (BOVESPA). The stocks of living animals (beef, pork and poultry) and the subprime crisis negatively affects technical efficiency. The firms operate in a market with imperfect competition and, for this reason show increasing returns to scale.
3. Meat market – an international
perspective
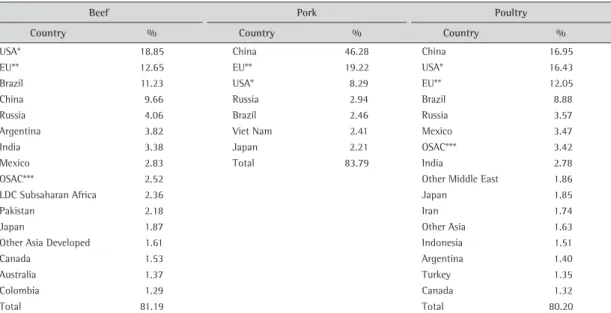
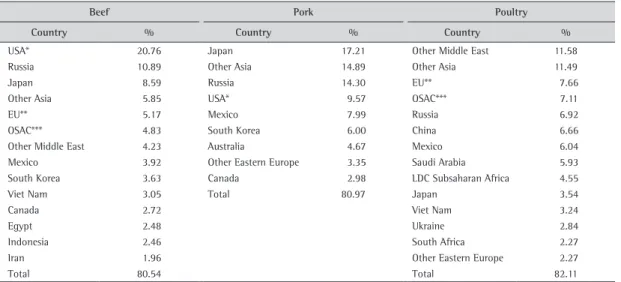
Tables 3, 4, 5, and 6 show the proportional participation (quantum) of selected countries in the world production, consumption, imports and exports of meat for 2009-2010. Data source is Organisation for Economic Co-operation and Development/Food and Agriculture Organization of the United Nations (2011). The countries considered are the ones defined in Organisation for Economic Co-operation and Development/Food and Agriculture Organization of the United Nations (2007) report. Overall Brazil, United States, European Union and China dominate the world production of meat. Beef consumption is dominated by the United States, European Union, Brazil and China, while pork and poultry consumption by China, European Union and the United States. The world imports of beef are dominated by United States, Russia and Japan. Imports of pork are dominated by Japan, Other Asian countries and Russia, and of poultry by Other Middle East countries, Other Asian countries and by the European Union. Beef exports are dominated by Brazil, Australia and the United States, pork exports by the United States, European Union, Canada, Brazil and China and poultry exports by Brazil and the United States.
A joint (beef, pork, and poultry) view of the meat market for each of the dimensions of major interest (production, imports, and exports) is conveyed here with the consideration of linear programming. The approach we choose for a multivariate country classification is based on the Data Envelopment Analysis – DEA (COOPER; SEIFORD; ZHU, 2011).
An index of importance is constructed as follows. Firstly, ranks are computed for each type of meat within each dimension or category (production, imports or exports), generating a three dimensional output (beef, poultry, pork). The use of ranks is justified in univariate and multivariate analysis by the following properties: (a) provides a robust measure of variation, since the transformation is not affected by the presence of outliers; (b) it has nonparametric properties and therefore is not dependent on normality or any other distributional assumptions; (c) it is robust against hetroskedasticity. Relative variation measured using untransformed values, as it is commonly performed with the Tornqvist index for instance, will be well suited if the underlying technology is in the Translog family, but it is not generally robust (COELLI et al., 2005). The three dimensional output is then considered in a performance DEA model with unit input, generating a performance measurement for each category of trade taking into account all three types of meat. These partial categories indexes define a new three
Table 2. Production shares based on export prices.
Year Beef Pork Poultry
1995 78.96 6.01 15.03
1996 74.04 9.59 16.37
1997 72.08 8.08 19.84
1998 70.69 5.68 23.63
1999 66.81 6.19 26.99
2000 60.98 11.48 27.54
2001 50.85 13.58 35.56
2002 49.51 10.05 40.45
2003 49.60 10.43 39.98
2004 48.74 11.20 40.06
2005 49.54 10.27 40.18
2006 54.91 9.56 35.53
2007 52.56 8.75 38.69
2008 57.84 7.05 35.11
2009 53.99 6.94 39.08
2010 57.40 7.60 34.99
2011 59.89 7.64 32.48
Table 4. World consumption (2009-2010).
Beef Pork Poultry
Country % Country % Country %
USA* 18.85 China 46.28 China 16.95
EU** 12.65 EU** 19.22 USA* 16.43
Brazil 11.23 USA* 8.29 EU** 12.05
China 9.66 Russia 2.94 Brazil 8.88
Russia 4.06 Brazil 2.46 Russia 3.57
Argentina 3.82 Viet Nam 2.41 Mexico 3.47
India 3.38 Japan 2.21 OSAC*** 3.42
Mexico 2.83 Total 83.79 India 2.78
OSAC*** 2.52 Other Middle East 1.86
LDC Subsaharan Africa 2.36 Japan 1.85
Pakistan 2.18 Iran 1.74
Japan 1.87 Other Asia 1.63
Other Asia Developed 1.61 Indonesia 1.51
Canada 1.53 Argentina 1.40
Australia 1.37 Turkey 1.35
Colombia 1.29 Canada 1.32
Total 81.19 Total 80.20
*USA = United States of America; **EU = European Union; ***OSAC = Other South America and Caribbean; Source: Organisation for Economic Co-operation and Development/Food and Agriculture Organization of the United Nations (2011).
Table 3. World production (2009-2010).
Beef Pork Poultry
Country % Country % Country %
USA* 17.52 China 46.19 USA* 19.77
Brazil 13.92 EU** 20.76 China 16.73
EU** 12.19 USA* 9.44 Brazil 12.63
China 9.62 Brazil 2.97 EU** 12.21
Argentina 4.53 Viet Nam 2.38 Russia 2.82
India 4.39 Total 81.74 Mexico 2.80
Australia 3.62 India 2.79
Russia 2.66 OSAC*** 2.70
Mexico 2.62 Iran 1.68
Canada 2.46 Argentina 1.66
LDC Subsaharan Africa 2.28 Indonesia 1.49
Pakistan 2.17 Japan 1.43
OSAC*** 2.11 Turkey 1.36
Other Asia Developed 1.52 Total 80.07
Total 81,60
*USA = United States of America; **EU = European Union; ***OSAC = Other South America and Caribbean; Source: Organisation for Economic Co-operation and Development/Food and Agriculture Organization of the United Nations (2011).
dimensional output that is further analyzed via a unitary input DEA performance model. The final score of relative importance is the performance index generated in this latter model. Figure 1 summarizes this procedure. In all models the DMUs are the 56 countries and conglomerates used by the OECD-FAO Outlook (ORGANISATION..., 2007).
We notice that the use of DEA here is as a performance measure not as an efficiency generated by a production frontier. This model is equivalent to an additive multicriteria model where the alternatives assign weights to each criterion, here the output
Table 5. World imports (2009-2010).
Beef Pork Poultry
Country % Country % Country %
USA* 20.76 Japan 17.21 Other Middle East 11.58
Russia 10.89 Other Asia 14.89 Other Asia 11.49
Japan 8.59 Russia 14.30 EU** 7.66
Other Asia 5.85 USA* 9.57 OSAC*** 7.11
EU** 5.17 Mexico 7.99 Russia 6.92
OSAC*** 4.83 South Korea 6.00 China 6.66
Other Middle East 4.23 Australia 4.67 Mexico 6.04
Mexico 3.92 Other Eastern Europe 3.35 Saudi Arabia 5.93 South Korea 3.63 Canada 2.98 LDC Subsaharan Africa 4.55
Viet Nam 3.05 Total 80.97 Japan 3.54
Canada 2.72 Viet Nam 3.24
Egypt 2.48 Ukraine 2.84
Indonesia 2.46 South Africa 2.27
Iran 1.96 Other Eastern Europe 2.27
Total 80.54 Total 82.11
*USA = United States of America; **EU = European Union; ***OSAC = Other South America and Caribbean; Source: Organisation for Economic Co-operation and Development/Food and Agriculture Organization of the United Nations (2011).
Table 6. World exports (2009-2010).
Beef Pork Poultry
Country % Country % Country %
Brazil 21.32 USA* 28.79 Brazil 33.55
Australia 16.72 EU** 27.25 USA* 30.69
USA* 10.80 Canada 20.43 EU** 9.07
Canada 9.50 Brazil 8.71 Thailand 5.81
India 7.79 China 5.69 Other Asia 5.01
New Zealand 5.99 Total 90.87 China 4.44
Argentina 5.61 Total 88.56
Uruguay 4.92
Total 82.65
*USA = United States of America; **EU = European Union; Source: Organisation for Economic Co-operation and Development/Food and Agriculture Organization of the United Nations (2011).
is the association observed in Gomes, Souza and Gazzola (2009) between classifications derived from unitary input DEA models and principal components.
Lovell and Pastor (1999) proved that a CCR model with a single constant input (or with a single constant output) coincides with the corresponding BCC model. For details on CCR and BCC models see, for instance, Cooper, Seiford and Zhu (2011). Gomes et al. (2012) showed that the model presented in Caporaletti, Dulá and Womer (1999) is not the same shown in Lovell and Pastor (1999). As discussed in Gomes et al. (2012), the Caporaletti, Dulá and Womer (1999) envelopment model is not equivalent, but resembles the classic CCR envelopment model, and the variable returns to scale assumption does not make sense in this case.
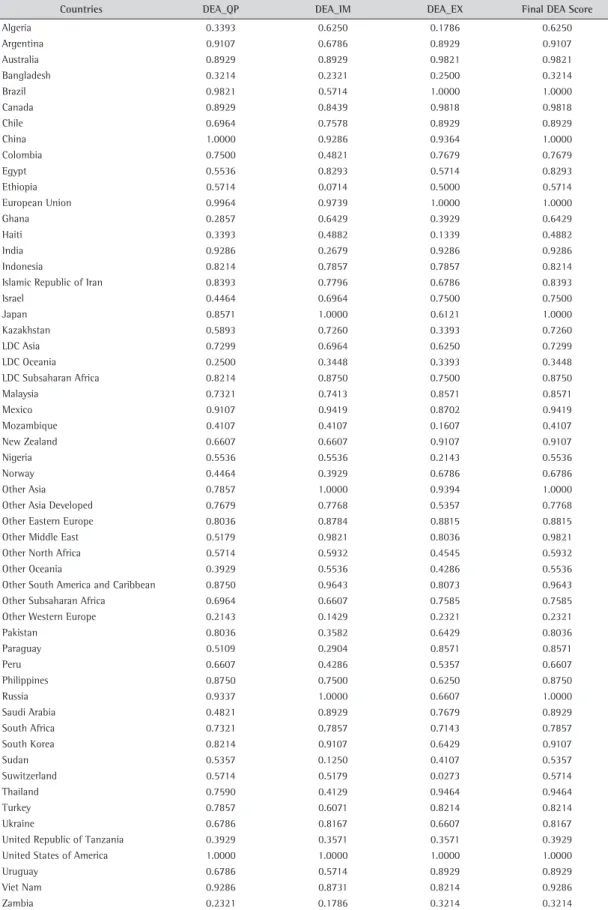
Following some of the above ideas, Gomes, Souza and Gazzola (2009) report the US, China, Japan, Denmark, Canada and Brazil as the most outstanding in market importance. In the dimension of imports, or of businesses opportunities for producers, the main group is formed by Japan, Mexico, South Korea, Italy, Germany and England. Their analysis was based on Tornqvist indexes and the variation observed in the period 1995-2003, with the base period being 1995. Our analysis for 2010 is reported in Table 7. The quartiles for the performance distributions are 0.6340 (Q1), 0.8254 (Median), and 0.9286 (Q3). The US, China, Japan, Denmark, Canada and Brazil are identified in the top quartile, but new actors are detected as Russia and Australia. The imports dimension includes in importance Russia, US, Saudi Arabia and Other South American and Caribbean countries. These classifications are important to identify clients (imports) and competitors (exports and production) of importance for the Brazilian meat agribusinesses.
4. A simultaneous equilibrium model for
beef, poultry and pork
We now turn our attention to provide a technical answer to some questions lately raised in the meat market regarding the price of corn and the exchange rate (BR$/US$). These variables potentially affect production through their influence in input prices and the exports flows of the three types of meat. Our focus here is the domestic behavior of the economic agents in the meat market. The previous discussions on market statistics and analysis of DEA performances are not directly translated in what follows. The partial equilibrium models we now consider jointly for beef, poultry and pork obey some variation of the following simple structure. The basic model is a system with nine equations in blocks of three equations, one for each type of meat. It is given by
(
)
(
)
(
)
= ν + e
= + e
= t + e
− + − ∆ =
1
2
3
0
c s
p in
p c
q f p , p ,rpc , pop ,ex ,
q g p , p ,r ,u
ex k p ,c ,
q q imp
where qc is the demand function, qp is the supply
function, ex denotes exports, p is own price, pS is a
price vector of substitutes, rpc is per capita income,
pop is population, ν, u and t are covariates that may
include dummies and lagged endogenous variables,
pin is a vector or index of input prices, r is the interest
rate (Brazilian - Selic), c is the exchange rate, imp
are imports, ∆ is stock variation and the ei are non
observable errors. All quantitative variables entering the regression are measured in natural logs. Not all variables show statistical significance. In these instances they are eliminated from the model specification when convenient. The actual models considered here refine G. S. Souza et al. (2008).
Relationships are assumed to be linear in natural logs so that the response functions belong to the Cobb-Douglas family. Prices of beef, poultry and pork are computed dividing the Organisation for Economic Co-operation and Development/Food and Agriculture Organization of the United Nations (2011) price (Atlantic price for beef and pork and US for poultry) by the US consumer price index. Prices are therefore measured in 2011 US dollars.
Table 8 describes the main variables used in our models. The source information on annual data is available in the OECD outlook data base. We used the period 1995-2011 in our analysis.
4.1.
Estimation
Table 9 shows three-stage least squares estimates (JOHNSTON; DINARDO, 1997) overall statistics for all markets. We see that regression R-square values are high, giving indication of a reasonable fit for all equations. The complete list of instruments is trend, price of corn, per capita income, exchange rate, interest rate, index of input prices, population, lag of exports for beef, poultry, and pork, lag of supplies for pork and poultry and lagged consumption of pork.
Table 7. DEA results. DEA_QP, DEA_IM and DEA_EX are the partial scores in the production, imports and exports categories, respectively.
Countries DEA_QP DEA_IM DEA_EX Final DEA Score
Algeria 0.3393 0.6250 0.1786 0.6250
Argentina 0.9107 0.6786 0.8929 0.9107
Australia 0.8929 0.8929 0.9821 0.9821
Bangladesh 0.3214 0.2321 0.2500 0.3214
Brazil 0.9821 0.5714 1.0000 1.0000
Canada 0.8929 0.8439 0.9818 0.9818
Chile 0.6964 0.7578 0.8929 0.8929
China 1.0000 0.9286 0.9364 1.0000
Colombia 0.7500 0.4821 0.7679 0.7679
Egypt 0.5536 0.8293 0.5714 0.8293
Ethiopia 0.5714 0.0714 0.5000 0.5714
European Union 0.9964 0.9739 1.0000 1.0000
Ghana 0.2857 0.6429 0.3929 0.6429
Haiti 0.3393 0.4882 0.1339 0.4882
India 0.9286 0.2679 0.9286 0.9286
Indonesia 0.8214 0.7857 0.7857 0.8214
Islamic Republic of Iran 0.8393 0.7796 0.6786 0.8393
Israel 0.4464 0.6964 0.7500 0.7500
Japan 0.8571 1.0000 0.6121 1.0000
Kazakhstan 0.5893 0.7260 0.3393 0.7260
LDC Asia 0.7299 0.6964 0.6250 0.7299
LDC Oceania 0.2500 0.3448 0.3393 0.3448
LDC Subsaharan Africa 0.8214 0.8750 0.7500 0.8750
Malaysia 0.7321 0.7413 0.8571 0.8571
Mexico 0.9107 0.9419 0.8702 0.9419
Mozambique 0.4107 0.4107 0.1607 0.4107
New Zealand 0.6607 0.6607 0.9107 0.9107
Nigeria 0.5536 0.5536 0.2143 0.5536
Norway 0.4464 0.3929 0.6786 0.6786
Other Asia 0.7857 1.0000 0.9394 1.0000
Other Asia Developed 0.7679 0.7768 0.5357 0.7768
Other Eastern Europe 0.8036 0.8784 0.8815 0.8815
Other Middle East 0.5179 0.9821 0.8036 0.9821
Other North Africa 0.5714 0.5932 0.4545 0.5932
Other Oceania 0.3929 0.5536 0.4286 0.5536
Other South America and Caribbean 0.8750 0.9643 0.8073 0.9643
Other Subsaharan Africa 0.6964 0.6607 0.7585 0.7585
Other Western Europe 0.2143 0.1429 0.2321 0.2321
Pakistan 0.8036 0.3582 0.6429 0.8036
Paraguay 0.5109 0.2904 0.8571 0.8571
Peru 0.6607 0.4286 0.5357 0.6607
Philippines 0.8750 0.7500 0.6250 0.8750
Russia 0.9337 1.0000 0.6607 1.0000
Saudi Arabia 0.4821 0.8929 0.7679 0.8929
South Africa 0.7321 0.7857 0.7143 0.7857
South Korea 0.8214 0.9107 0.6429 0.9107
Sudan 0.5357 0.1250 0.4107 0.5357
Suwitzerland 0.5714 0.5179 0.0273 0.5714
Thailand 0.7590 0.4129 0.9464 0.9464
Turkey 0.7857 0.6071 0.8214 0.8214
Ukraine 0.6786 0.8167 0.6607 0.8167
United Republic of Tanzania 0.3929 0.3571 0.3571 0.3929
United States of America 1.0000 1.0000 1.0000 1.0000
Uruguay 0.6786 0.5714 0.8929 0.8929
Viet Nam 0.9286 0.8731 0.8214 0.9286
Table 8. Variables.
Variable Description Unity
beef c
q Beef domestic consumption 1000 t
pbeef Beef price US$/t
beef p
q Beef production 1000 t
poulty c
q Poultry domestic consumption 1000 t
ppoultry Poultry price US$/t
poulty p
q Poultry production 1000t
pork c
q Pork domestic consumption 1000t
ppork Pork price US$/t
pork p
q Pork production 1000 t
pcorn Corn price US$/t
exbeef Beef exports 1000 t
expoultry Poultry exports 1000 t
expork Pork exports 1000 t
pop Population
-r Selic interest rate -rpc Per capita income (nominal) US$/inhab
c Exchange rate BRL$/US$
Table 9. Stata v.12.1 output. Overall statistics. Three-stage least-squares regression. For products qc is demand, qp is supply, and ex is export.
Equation Observations Parms RMSE R-square chi2 p-value
beef c
q 16 6 0.0264 0.9306 240.76 0.0000
beef p
q 16 3 0.0723 0.8336 98.40 0.0000
exbeef 16 2 0.2168 0.9183 192.56 0.0000
poulty c
q 16 2 0.0226 0.9934 2,682.95 0.0000
poulty p
q 16 3 0.0409 0.9876 1,454.99 0.0000
expoultry 16 3 0.1465 0.9606 467.44 0.0000
pork c
q 16 4 0.0394 0.9584 511.27 0.0000
pork p
q 16 4 0.0683 0.9262 261.33 0.0000
expork 16 2 0.2354 0.9355 304.90 0.0000
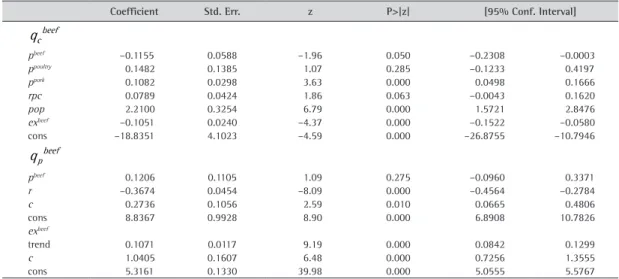
destroy the dependence on price. The two exogenous variables affect differently the supply. The interest rate has a negative effect and the exchange rate a positive effect. Exports in the beef market are also more sensitive to the exchange rate than to price, which we did not find significance.
Estimates for the poultry market are given in Table 11. The price demand elasticity for poultry has to be computed indirectly through the export
equation. It is given by –0.2736, with a standard error of 0.1021. It is significantly different from zero and has the proper sign. Beef and pork are not significant as substitutes. The price of corn affects negatively the supply equation. Prices and the exchange rate act in the same direction for exports. An increase in the exchange rate appears to be good for the market, ceteris paribus. It is interesting to notice in the poultry market the non significance of the income component. The same occurs with the pork demand function. A relative increase in income, ceteris paribus, will increase only the beef consumption.
Estimates for the pork market are given in Table 12. As in G. S. Souza et al. (2008), the dummy variable explains a significant shift in the demand curve beginning in 2000. Price was kept in the demand function to maintain consistency with our approach in the beef supply function. It has the proper sign. Its absence does not affect the statistical results. The demand price elasticity has to be computed indirectly through the exports equation. It is –0.0809, with a standard error of 0.0585, marginally significant. The supply function for pork is highly sensitive to price, to the interest rate and to the price of corn. The last two variables have a negative effect.
4.2.
A simulation exercise
Table 10. Stata v.12.1 output from three-stage least squares estimation – beef market. Coefficients are elasticities. Variables are in natural logs.
Coefficient Std. Err. z P>|z| [95% Conf. Interval]
beef c q
pbeef –0.1155 0.0588 –1.96 0.050 –0.2308 –0.0003
ppoultry 0.1482 0.1385 1.07 0.285 –0.1233 0.4197
ppork 0.1082 0.0298 3.63 0.000 0.0498 0.1666
rpc 0.0789 0.0424 1.86 0.063 –0.0043 0.1620
pop 2.2100 0.3254 6.79 0.000 1.5721 2.8476
exbeef –0.1051 0.0240 –4.37 0.000 –0.1522 –0.0580
cons –18.8351 4.1023 –4.59 0.000 –26.8755 –10.7946
beef p q
pbeef 0.1206 0.1105 1.09 0.275 –0.0960 0.3371
r –0.3674 0.0454 –8.09 0.000 –0.4564 –0.2784
c 0.2736 0.1056 2.59 0.010 0.0665 0.4806
cons 8.8367 0.9928 8.90 0.000 6.8908 10.7826
exbeef
trend 0.1071 0.0117 9.19 0.000 0.0842 0.1299
c 1.0405 0.1607 6.48 0.000 0.7256 1.3555
cons 5.3161 0.1330 39.98 0.000 5.0555 5.5767
Table 11. Stata v.12.1 output from three-stage least squares estimation – poultry market. Coefficients are elasticities. Variables are in natural logs. Variable pt2 is the lag of supply and pt3 is the lag of exports.
Coefficient Std. Err. z P>|z| [95% Conf. Interval]
poulty c q
ppoultry –0.1486 0.1022 –1.45 0.146 –0.3488 0.0516
pop 5.3349 0.1867 28.58 0.000 4.9690 5.7007
expoultry –0.0671 0.0152 –4.43 0.000 –0.0968 –0.0374
cons –54.1081 2.3233 –23.29 0.000 –58.6616 –49.5546
poulty p q
ppoultry 0.3077 0.1880 1.64 0.102 –0.0608 0.6761
pcorn –0.1189 0.0211 –5.65 0.000 –0.1602 –0.0777
pt2 1.0012 0.0267 37.53 0.000 0.9489 1.0535
cons –1.6525 1.3930 –1.19 0.236 –4.3828 1.0777
expoultry
ppoultry 1.8641 0.4895 3.81 0.000 0.9047 2.8236
c 0.3256 0.1109 2.94 0.003 0.1082 0.5429
pt3 0.8218 0.0491 16.72 0.000 0.7255 0.9182
cons –12.8115 3.6442 –3.52 0.000 –19.9540 –5.6690
Table 12. Stata v.12.1 output from three-stage least squares estimation – pork market. Coefficients are elasticities. Variables are in natural logs. Variable pk2 is the lag of supply and pk3 is the lag of exports.
Coefficient Std. Err. z P>|z| [95% Conf. Interval]
pork c q
ppork –0.0281 0.0392 –0.72 0.473 –0.1050 0.0487
expork –0.2055 0.0274 –7.51 0.000 –0.2592 –0.1519
trend 0.0351 0.0036 9.75 0.000 0.0281 0.0422
dummy 0.5115 0.0401 12.76 0.000 0.4329 0.5900
cons 8.3096 0.3399 24.45 0.000 7.6434 8.9758
pork p q
ppork 0.1740 0.0717 2.43 0.015 0.0335 0.3145
r –0.2566 0.0711 –3.61 0.000 –0.3960 –0.1172
pcorn –0.1885 0.0542 –3.48 0.000 –0.2947 –0.0824
pk2 0.4069 0.1080 3.77 0.000 0.1952 0.6187
trend 0.0167 0.0085 1.96 0.050 0.0000 0.0334
cons 4.8860 1.0365 4.71 0.000 2.8545 6.9176
expork
ppork 0.2570 0.2274 1.13 0.258 –0.1887 0.7026
pk3 0.9055 0.0538 16.82 0.000 0.8000 1.0110
relative to the US dollar, and the potential use of corn in the production of ethanol, notably by the US, which would imply an increase in corn price, given the importance of this country for the market. We solved the model for market values of 2011 to access this effect, and exogenously added the modifications in the exchange rate and in the corn price, and recomputed the equilibrium values for the endogenous variables.
Table 13 shows the results of our exercise. Separate exogenous variation in the price of corn will not affect the market variables that remain close to their actual values. Separate change in the exchange rate will affect negatively beef production, poultry exports and beef exports. The joint effect is more worrisome. It will affect negatively production in general, and beef and poultry exports.
5. Summary and conclusions
We studied the meat market in Brazil from a domestic and from an international perspective. We see that the agribusiness in Brazil is responsible for a sizable part of total Brazilian exports. Roughly, 38% in 2011. Approximately 18% of the agribusiness total exports come from meat, which is about 8% of total Brazilian exports. From the point of view of its insertion in the world meat market, Brazil is the leading country in the export of beef and poultry, and the fourth in pork.
By the means of a two-step DEA computation we defined an index of market importance for world countries taking into consideration total production, total imports and total exports of beef, pork, and poultry. In the first stage, three unitary input DEA
models (production, imports and exports) were computed using as output a vector of ranks of dimension three (beef, poultry, pork). The performance scores were used in a second stage as outputs in a final unitary input DEA model under the CCR assumption. Empirically we observed similarities with principal components analysis without the drawback of potential of negative weights of the later.
According to the DEA approach here proposed, the US, China, Japan, Denmark Canada and Brazil are identified in the top quartile of the importance score and new actors are detected, relative to previous studies, as Russia and Australia. The imports dimension includes in importance Russia, US, Saudi Arabia and Other South American and Caribbean countries. The last two are new actors not listed in previous studies using DEA and the Tornqvist index. These classifications are important to identify clients (imports) and competitors (exports) of importance for the Brazilian meat agribusinesses. The main competitors in the market (90% quantile) are the European Union, the US, Australia, Canada and Thailand. Important countries in the first quartile include China, New Zeland, Argentina, Chile and Uruguay.
In order to assess the domestic meat markets, we fit jointly equations of demand, supply and export for the markets of beef, poultry and pork using simultaneous equilibrium models and three-stage least squares. The response functions belong to the Cobb-Douglas family. The high values of R-squares indicate agreement with actual data. The parameter estimates are used for simulation purposes to evaluate the effects of marginal changes in the exogenous variables on the endogenous variables. They all
Table 13. SAS v.9.2 output on equilibrium solutions resulting from actual 2011 values, separate and joint changes in corn price – corn (+10%) and exchange rate – c (–10%). Columns v1-v3 are proportional changes of values in the original scale.
Var Actual(log) p
corn
(log)
c (log)
Joint (log)
v1 (pcorn)%
v2 (c)%
v3 (both)%
beef c
q 8.9455 8.9455 8.9571 8.9571 100.000 100.000 101.159
beef p
q 9.1085 9.1085 9.0797 9.0797 100.000 100.000 97.159
exbeef 7.6969 7.6969 7.5873 7.5873 100.000 100.000 89.616
poulty c
q 9.1522 9.1522 9.1545 9.1545 100.000 100.000 100.230
poulty p
q 9.4492 9.4378 9.4492 9.4378 100.000 98.873 100.000
expoultry 8.2009 8.2009 8.1666 8.1666 100.000 100.000 96.628
pork c
q 7.8799 7.8799 7.8799 7.8799 100.000 100.000 100.000
pork p
q 8.0576 8.0397 8.0576 8.0397 100.000 98.219 100.000
expork 6.4532 6.4532 6.4532 6.4532 100.000 100.000 100.000
pbeef 8.9455 8.9455 8.9571 8.9571 100.000 100.000 101.159
ppork 9.1085 9.1085 9.0797 9.0797 100.000 100.000 97.159
show the correct signs. The price of corn was added as a production variable in the supply functions for pork and poultry. In this context simulations were performed to investigate the separate and the joint effects of unwanted changes in the corn price, and in the exchange rate. We conclude that a change in the corn price will not affect equilibrium by much. A separate change in the exchange rate will affect exports for beef and poultry and beef production. This effect is enhanced in the joint simulation, where the pork market is also affected. Overall the effect is negative.
We see that an increase in the exchange rate (Brazilian real devaluation relative to the US dollar) may not be good for Brazilian producers, since it may affect negatively the market variables.
References
BRASIL. Ministério da Agricultura, Pecuária e Abastecimento. Brasil Projeções do Agronegócio 2010/2011 a 2020/2021. Brasília: Assessoria de Gestão Estratégica, 2011. BRASIL. Ministério da Agricultura, Pecuária e Abastecimento.
Estatísticas de Comércio Exterior - AgroStat Brasil. 2011. Disponível em: <http://www.agricultura.gov.br/ internacional/indicadores-e-estatisticas>. Acesso em: 01 set. 2011.
CAPORALETTI, L. E.; DULÁ, J. H.; WOMER, N. K. Performance evaluation based on multiple attributes with nonparametric frontiers. Omega, v. 27, p. 637-645, 1999. http://dx.doi.org/10.1016/S0305-0483(99)00022-5 COELLI, T. J. et al. An Introduction to Efficiency and
Productivity Analysis. 2nd ed. New York: Springer, 2005. CONTINI, E. et al. Projeções do agronegócio no Brasil e no
mundo. Revista de Política Agrícola, v. 14, p. 45-56, 2006. COOPER, W. W.; SEIFORD, L. M.; ZHU, J. Handbook on Data
Envelopment Analysis. 2nd ed. New York: Springer, 2011. http://dx.doi.org/10.1007/978-1-4419-6151-8
DE KOEIJER, T. J. et al. Measuring agricultural sustainability in terms of efficiency: the case of Dutch sugar beet growers. Journal of Environmental Management, v. 66, p. 9-17, 2002. PMid:12395583. http://dx.doi.org/10.1006/ jema.2002.0578
GAZZOLA, R. et al. Mercado de carnes: aspectos descritivos e experiências com o uso de modelos de equilíbrio parcial e de espaço de estados. Revista de Política Agrícola, v. 14, p. 84-101, 2006.
GOMES, E. G. et al. Unitary input DEA model to identify beef cattle production systems typologies. Pesquisa Operacional, v. 32, p. 389-406, 2012. http://dx.doi. org/10.1590/S0101-74382012005000015
GOMES, E. G.; SOUZA, G. S.; GAZZOLA, R. Uma análise do comércio internacional de carnes. Revista de Política Agrícola, v. 18, p. 8-24, 2009.
GOMES. E. G.; SOUZA, G. S.; VIVALDI, L. J. Experimental design using DEA: an application to intercropping and evidence from randomization theory. Pesquisa Operacional, v. 28, p. 339-354, 2008. http://dx.doi.org/10.1590/S0101-74382008000200010
HEISEY, P.; WANG, S. L.; FUGLIE, K. Public agricultural research spending and future US agricultural productivity growth: scenarios for 2010-205. Economic Brief, n. 17, 2011. Disponível em: http://www.ers.usda.gov/media/118663/ eb17.pdf. Acesso em: 31 out. 2012.
JOHNSTON, J.; DINARDO, J. Econometric Methods. 4th ed. Boston: McGraw-Hill, 1997.
LOPES, M. R. et al. Estradas rurais ou urbano-industriais: processo de escolha em regime de competição por fundos públicos. Revista de Política Agrícola, v. 4, p. 47-64, 2008.
LOVELL, C. A. K.; PASTOR, J. T. Radial DEA models without inputs or without outputs. European Journal of Operational Research, v. 118, n. 1, p. 46-51, 1999. http:// dx.doi.org/10.1016/S0377-2217(98)00338-5
ORGANISATION FOR ECONOMIC CO-OPERATION AND DEVELOPMENT - OECD; FOOD AND AGRICULTURE ORGANIZATION OF THE UNITED NATIONS - FAO. Documentation of the Aglink-Cosimo Model. Paris: OECD Publishing, 2007.
ORGANISATION FOR ECONOMIC CO-OPERATION AND DEVELOPMENT - OECD; FOOD AND AGRICULTURE ORGANIZATION OF THE UNITED NATIONS - FAO. Agricultural Outlook 2011-2020. Paris: OECD Publishing, 2011.
SOARES DE MELLO, J. C. C. B.; ANGULO-MEZA, L.; BRANCO DA SILVA, B. P. A ranking for the Olympic Games with unitary input DEA models. IMA Journal Management Mathematics, v. 20, p. 201-211, 2009. http://dx.doi. org/10.1093/imaman/dpn025
SOARES DE MELLO, J. C. C. B. et al. Cross evaluation using weight restrictions in unitary input DEA models: Theoretical aspects and application to Olympic Games ranking. WSEAS Transactions on Systems, v. 7, p. 31-39, 2008.
SOUZA, G. S. et al. The meat market in Brazil: a partial equilibrium model. Revista de Economia e Sociologia Rural, v. 46, p. 1189-1208, 2008.
SOUZA, G. S.; SALUSTIANO, S. F. M.; MOREIRA, T. B. S. Technical Efficiency of Brazilian Exporters of Animal Protein. International Journal of Economics and Research, v. 3, p. 173-177, 2012.
SOUZA, W. F. S.; SOUZA, G. S. Infra-estrutura portuária nacional de apoio ao comércio exterior: hierarquização das unidades portuárias. Engevista, v. 9, p. 4-13, 2007. THOMPSON, R. G. et al. Comparative evaluation for locating