© 2013 IBRACON
Lattice slabs are usual in Brazil. They are formed by precast joists with latticed bars on a base of concrete, and a cover of concrete placed at the
jobsite. The assembly of the joists and the illing elements is simple and do not require manpower with great skill, presenting low cost-beneit ratio. However, it is precisely in assembling phase that arise questions related to the scaffold support distance. A mistake in the proper positioning can
lead to two undesirable situations. In one of them, a small space between the support lines increases the cost of scaffold, and in other an
exces-sive space can generate exaggerated displacements, and even the collapse of the slab in the stage of concreting. The objective of this work is to analyze the bearing capacity of lattice joists in assembling phase, looking for information that is useful in deining the scaffold support distance. Several joists were tested to deine the failure modes and their load bearing capacities. The results allowed to determine equations for calculating
the appropriate distance between the support lines of the joists.
Keywords: lattice slabs; lattice joists; self-portance; support lines; buckling.
Lajes treliçadas são usuais no Brasil. Elas são formadas por vigotas pré-moldadas, com armadura treliçada sobre uma base de concreto, e por uma capa de concreto moldada na obra. A montagem das vigotas e dos elementos de enchimento é simples e não exige mão de obra com
grande habilidade, apresentando baixa relação custo-benefício. Entretanto, é justamente na fase de montagem que surgem questões relativas à distância entre as linhas de escora. Um erro no posicionamento adequado pode levar a duas situações indesejáveis. Em uma delas, um espaço pequeno entre as linhas de escora aumenta o custo do cimbramento, e na outra, um espaço excessivo pode gerar deslocamentos exagerados, e
até mesmo o colapso da laje, na fase de concretagem. O objetivo deste trabalho é analisar a capacidade portante de vigotas treliçadas, na fase
de montagem, procurando informações que sejam úteis na deinição da distância entre as linhas de escora. Foram ensaiadas várias vigotas para deinir os modos de ruína e suas capacidades de carga. Os resultados permitiram determinar expressões para o cálculo da distância adequada
entre as linhas de escora das vigotas.
Palavras-chave: lajes treliçadas; vigotas treliçadas; autoportância; linhas de escora; lambagem.
Analysis of the assembling phase of lattice slabs
Análise da fase de montagem de lajes treliçadas
A. L. SArtorti a [email protected]
A. C. FonteS a [email protected]
L. M. Pinheiro b [email protected]
a Centro Universitário Adventista de São Paulo, Engenheiro Coelho, SP, Brasil 13165-000
b Escola de Engenharia de São Carlos, Universidade de São Paulo, São Carlos-SP, Brasil 13566-590
Received: 07 Sep 2012 • Accepted: 03 Jan 2013 • Available Online: 12 Aug 2013
Abstract
1. introduction
Since ancient times, the art of building has been improved in or-der to ensure economy, safety, and comfort. Therefore, it was
necessary to develop techniques that could help to transpose
the great engineering challenges, such as: support large loads,
implement elevated loors, and win large spans. In this context,
there was the need to create new systems for slabs in order to conciliate the desired structural characteristics with the parame-ters of economy and speed of construction. In this way, the slabs formed by lattice joists, also called lattice joist slabs or simply
lattice slabs, acquired space and became one of the most used
systems in the Brazilian civil construction currently.
A common lattice slab is composed by lattice joists, or trussed joists (TR), with a base of precast concrete and lattice rein-forcement partially embedded. Among the lattice joists are
placed illing elements that reduce the self-weight and com
-plete the lower part of the slab. Over this part is placed a lay-er of concrete called covlay-er which concludes the ribbed slab.
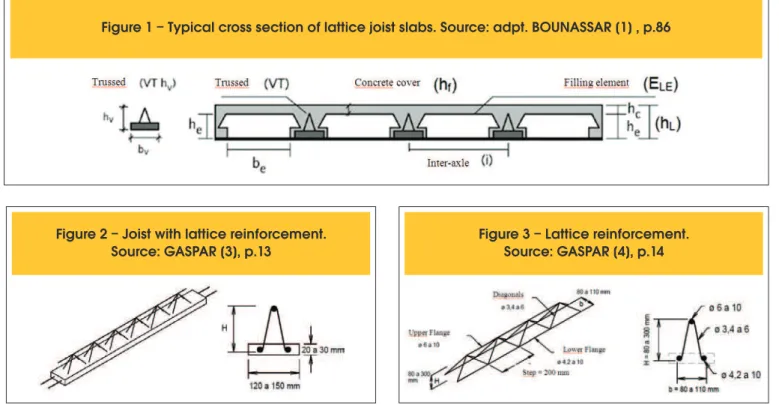
Figure 1 illustrates the parts that compose an ordinary lat
-tice slab. Besides the arrangement shown in this igure, are still found joists with langes of concrete in bottom and top
(I section), and massive ribs.
However, a problem that persists in all conigurations of lattice joist slabs is the question of distance of the scaffold lines, which
support the slab during the transitional phase of assembly and concreting.
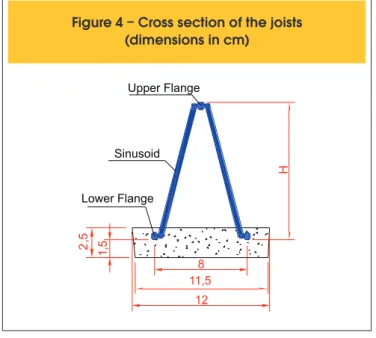
The load bearing capacity of a lattice joist slab in the assembling phase is directly connected with the resistant capacity of the parts that compose the truss reinforcement, weld of the bars, and lattice joist itself. The characteristics of the lattice joist are illustrated in
Figure 2. The bars of the joist are speciied by the Brazilian Code
ABNT NBR 7480 (1996) [2]. In Figure 3, the dimensions of the
joists are illustrated according to the ABNT NBR 14862 (2002) [3].
Joists are indicated by a code TR, followed by ive digits: the irst two represent the height of the joist, in centimeters, and
the last three represent the diameters, in millimeters, of the upper bar, the sinusoid (diagonals), and the lower bars re-spectively, without consideration of decimal places. Ex.: TR08 634 – trussed joist composed by steel with charac-teristic yielding strength of 600 MPa, 8 cm of height, up-per bar with 6 mm, sinusoid with 3.4 mm, and lower bars with 4.2 mm.
Both GASPAR [4] and DROPPA JR. [5] show that the diagonals in joist reinforcement provide rigidity to the set and good conditions of shipping and handling, in addition to resist the shear stresses and ensure that the system is monolithic after placing the con-crete cover. The bottom bars serve to combat the tensile stresses resulting from bending. When necessary, should be placed ad-ditional reinforcement to resist the tensile stresses.
Is still asserted by GASPAR [4] that the top bar is the main re-sponsible for the stiffness in transportation and also by the maxi-mum scaffold support distance.
ABNT NBR 14860-1 (2002) [6] in section 5.2 states that “the spacing between scaffold support lines should be determined in the project, considering the type of slab and the loads in the phase of assembly and concreting”.
Although there is a recommendation that the design of the spac-ing between support lines be done in order to guarantee safety to the slab failure at the time of concreting, only some studies are found in the technical literature which effectively consider the subject, and not much give a practical orientation about the cal-culation of the scaffold support distance.
GASPAR [4] studied the transitory phase of assembly for joists
Figure 1 – Typical cross section of lattice joist slabs. Source: adpt. BOUNASSAR [1] , p.86
Figure 2 – Joist with lattice reinforcement.
625 IBRACON Structures and Materials Journal • 2013 • vol. 6 • nº 4
2. experimental analysis
In this item will be considered the characterizations of materials and the tests.
2.1 Characterization of the materials
Will be characterized the lattices and the concrete bases.
2.1.1 Joists
The characteristics of the used lattice joists are indicate in the Ta-ble 1. The trussed joist TR06 is also considered, which was tested in spite of not being present in the current standard of lattice re-inforcement (NBR 14862 (2002) [10]), because it was already in-cluded in the revision of the standard mentioned.
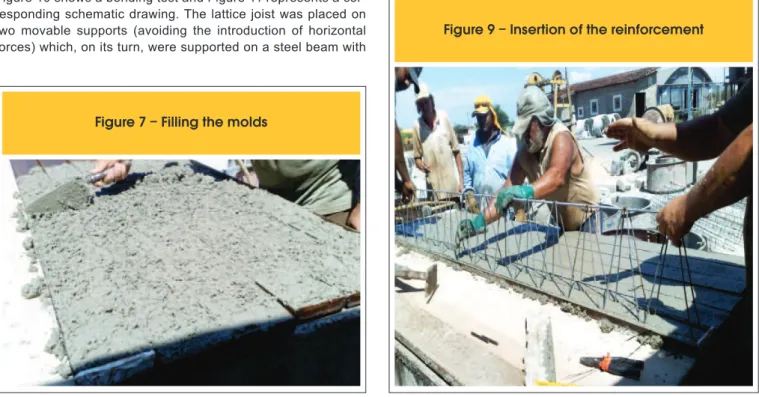
The cross and longitudinal sections of the lattice joists are illustrated in
the Figures 4 and 5. The cover of 1.5 cm showed in the Figure 4 was guaranteed by spacers. The upper bar is also denominated upper lange, the lower ones, lower lange, and the sinusoids are also called diagonals.
2.1.2 Concrete bases
The concrete bases of the joists were molded in two stages due to the amount of available molds.
The irst molding with mix-design in mass 1 : 2.9 : 2.84 : 0.65 was
made in March 2nd, 2012 and included the joists TR16745, TR20745, TR25756, TR30856. It was made the slump test with result of 55 mm. The compression characteristic strength predicted for 28 days was
25 MPa. For its determination were molded six cylindrical speci
-mens of 10 cm x 20 cm.
The second molding of concrete bases with mix-design in mass 1 : 2.9 : 2.84 : 0.5 was in March 15th, 2012 completing the rest of the joists: TR6634, TR08644 and TR12644. The change in the amount of water was due to the weather variation between molding days. The slump test
gave a result of 50 mm. As in the irst molding, the compression charac
-teristic strength predict for 28 days was 25 MPa. Also in this stage, six specimens were molded to determine the concrete strength.
The procedure for molding the concrete bases consisted in four
steps: (1) wetting the molds with demoulding oil (Figure 6); (2) ill
-ing of the molds with a fresh concrete layer (Figure 7); (3) vibration of the concrete with the aid of a rubber hammer (Figures 8); (4) insertion of the reinforcement (Figure 9).
2.2 Characterization of tests
The tests were made on April 19th and April 20th, 2012, respec-tively bending and shear tests.
with 8 cm and 12 cm of height requested by a positive bending
moment. TERNI et al. [7] carried out a inite element modeling us -ing as a base some tests made by EL DEBS and DROPPA JR. (2000)1, apud TERNI et al. [7].
CARVALHO et al. [8] performed an extensive literature review about the state of the art of precast slabs with lattice joists. In this study the researches of GASPAR [4], EL DEBS e DROPPA JÚNIOR (1999)2, and FORTE et al. (2000)3 are indicated.
Thus, in this work, an experimental study was developed, which
made possible to get results that can be used in the calculation of scaffold support distance of lattice joist slabs.
The paper is about tests of positive bending moment and shear, performed in the Laboratory of Materials and Structures of the
Adventist University Center of Sao Paulo (Centro Universitário
Adventista de São Paulo), as described in the following items. These tests led to the collapse and allowed the analysis of the displacements and the failure modes for lattice joists, answering the aim of the study which is to describe the failure mechanisms and generate recommendations that can be used in the calcula-tion of the scaffold support distance.
Table 1 – Height of the lattice joists
and diameter of the bars
Joist
Upper
Sinusoid
Lower
Diameter of the bars (mm)
Height
(H) (mm)
TR06 644
TR08 644
TR12 645
TR16 745
TR20 745
TR25 756
TR30 856
60
80
120
160
200
250
300
6.00
6.00
6.00
7.00
7.00
7.00
8.00
3.40
4.20
4.20
4.20
4.20
5.00
5.00
3.40
4.20
4.20
4.20
4.20
5.00
5.00
Figure 4 – Cross section of the joists
(dimensions in cm)
11,5 12
2,
5
1,
5
H
8
Upper Flange
Lower Flange Sinusoid
Figure 5 – Longitudinal section of the joist
300cm
1 EL DEBS, M. K.; DROPPA JÚNIOR, A. Um estudo teórico-experimental do comportamento estrutural de vigotas e painéis com armação treliçada na fase de construção. In: Congresso Brasileiro do Concreto, 42. Fortaleza – CE.
Anais Eletrônicos. 2000.
2 EL DEBS, M. K., DROPPA JÚNIOR, A. (1999). Critérios para dimensionamento de vigotas com armação treliçada nas fases de construção. Relatório Técnico. EESC-USP, São Carlos, SP.
3 FORTE F. C.; FANGEL L.; ARADO F. B. G.; CARVALHO, R. C.; FURLAN JUNIOR, S.; FIGUEIREDO FILHO, J. R. Estudo experimental do espaçamento de escoras em lajes pré-moldadas com nervuras do tipo treliça. Congresso
cross section in form of I, which served as a base for performing the test.
The mobile supports were placed 20 cm from the extremities of the joist, generating a theoretical span of 260 cm. The adopted dimensions were chosen according to the capacity of the
labo-ratory and test equipments. If larger spans were used, it would
be impracticable the assembly of the tests. Very small spans 2.2.1 equipments used in the tests
The equipments used in the tests were:
n Universal testing machine servo hydraulic, capacity 1000 kN,
mark Contenco;
n Two dial gauges to measure displacements, capacity 50 mm, precision 0,01 mm;
n Two magnetic supports for the dial gauges; n Steel beam for support;
n Wood devices for load application; n Neoprene plates for testing of models.
2.2.2 Bending tests
Figure 10 shows a bending test and Figure 11 represents a cor
-responding schematic drawing. The lattice joist was placed on two movable supports (avoiding the introduction of horizontal forces) which, on its turn, were supported on a steel beam with
Figure 6 – Wetting the molds with oil
Figure 7 – Filling the molds
Figure 8 – Vibration of the concrete
627 IBRACON Structures and Materials Journal • 2013 • vol. 6 • nº 4
would present problems for the measuring of vertical
displace-ment. Therefore, it is noted that the obtained delection for the
span in study is perfectly measurable, justifying the adopted
span. In the middle of this span two delection indicators were
placed (R1 and R2) in order to measure the vertical displace-ments at this position.
The loading speed was 3 mm/min in the piston4 of the jack, and
it was applied through a hydraulic cylinder ixed in the steel
beam, in a way that the wood dispositive distributed the total
force F in two application points distant 86.66 cm from the sup
-ports (in addition to this load it was considered the self-weight of the piece). Two specimens were tested for each lattice joist height, totalizing 14 tests.
An important observation is that the concentrated load in the mid-dle thirds generates a stretch of positive bending moment “almost” constant. The “almost” is due to the presence of the distributed self-weight. Another aspect is that in the central portion can occur
buckling of the upper bar.
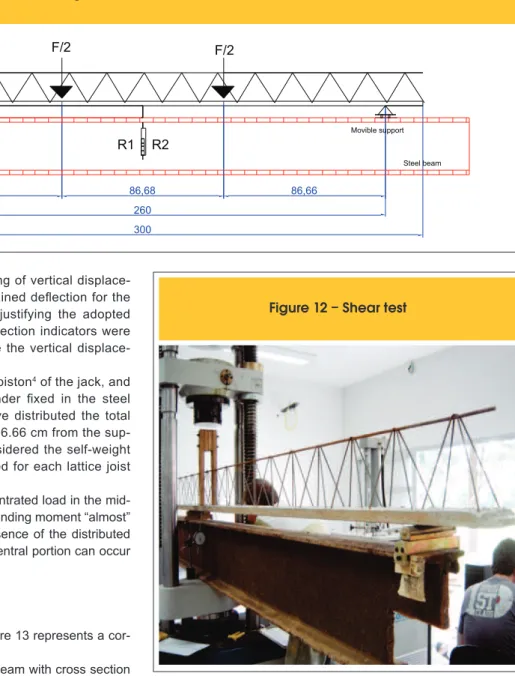
2.2.3 Shear tests
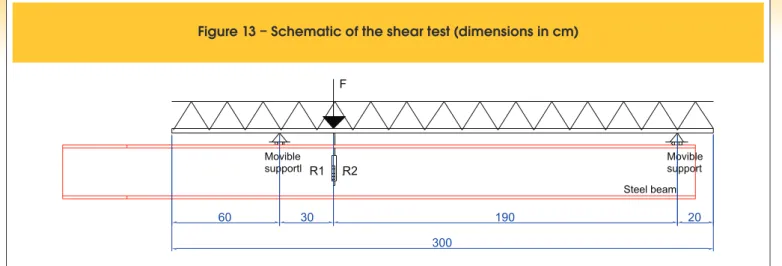
Figure 12 illustrates a shear test, and Figure 13 represents a cor
-responding schematic drawing.
It was used a base composed by a steel beam with cross section
in form of I, which served as movable supports that sustain the lat-tice joist. The left movable support was placed at 60 cm from the extremity of the joist while the right movable support was placed at 20 cm from the opposite extremity.
The loading was applied through a hydraulic cylinder on the
metal-lic beam and the ixed wood support which transferred the force
to the position at 30 cm from the left support. If the loading was applied closer to the left support, the transference to the concrete base of the joist could be through the alternative mechanisms of shear strength of concrete.
Two delection indicators were used (R1 e R2) in the application
point of the loading to measure the vertical displacements. The load speed was 3 mm/min in the piston of the press, and two joists of each height were submitted to this test, totalizing 14 tests.
Figure 10 – Bending test
Figure
11 – Schematic of the bending test (dimensions in cm) – base composed by a I beam
300 260
86,68 86,66
86,66
F/2 F/2
R1 R2
Movible support Movible support
Steel beam
Figure 12 – Shear test
4 The equivalent static load varies with the stiffness of the piece. Those with a larger stiffness have a larger equivalent static load. It was also observed that the loading curve is nonlinear, but as a reference it can be adopted a medium
3. test results
Will be present the test results of the specimens and the bending and shear tests.
3.1 Concrete specimens
Six pairs of cylindrical specimens of 10 cm x 20 cm molded with the base of the concrete joists were tested on April 25th, 2012 and pre-sented the results summarized in Table 2. Analyzing this table it is noted that the medium strength to compression of the specimens molded on March 2nd, 2012 is fcm= 36.2 MPa, and on March 15th, 2012 is fcm= 38 MPa.
When a standard deviation of 5.5 MPa is considered (FUSCO [9]),
the characteristic strengths to compression are 27.15 MPa e 28.95 MPa respectively. Utilizing these characteristic values the concrete
modulus of elasticity was estimated by the equations 1 and 2, ac
-cording to Brazilian Code ABNT NBR 6118 (2007) [10].
Figure 13 – Schematic of the shear test (dimensions in cm)
R1 R2
Movible
supportl Movible support
Steel beam
300
60 30 190 20
F
Table 2 – Strength of specimens to compression
Specimen
Compression
strength of the
mixture of March
2nd, 2012 (in MPa)
Compression
strength of the
mixture of March
15th, 2012 (in MPa)
1
2
3
4
5
6
35.42
31.78
45.95
35.56
32.47
35.81
33.80
37.68
39.91
38.02
41.23
37.68
Figure 14 – Graphic of applied force versus vertical displacement of the joist VT 20 F2 (lattice
joist with height of 20 cm; second sample tested to flexion). Carga means load, and 1 kgf = 10 N
VT 20 F2
y = -0,0284x3 - 3,7034x 2 + 70,356x + 8,2835 R2 = 0,9918
0,00 50,00 100,00 150,00 200,00 250,00 300,00 350,00
0 2 4 6 8 10 12 14
Carga (kgf) Polinômio
Ca
rg
a
(k
gf
)
629 IBRACON Structures and Materials Journal • 2013 • vol. 6 • nº 4
(1)
ckci
f
E
=
5600
.
(2)
cics
E
E
=
0
,
85
.
Eci is the initial tangent elasticity modulus of the concrete, Ecs is the concrete secant modulus of elasticity, and fck is the characteristic strength of concrete to compression (all in MPa).
3.2 Bending tests results
Each test generated a graphic for applied force versus vertical
displace-ment as illustrated in Figure 14 from which was obtained the maximum force resisted by the joist and the corresponding force to limit delection. The obtained results in the lexion tests with positive bending moment are synthesized in Table 3. Figures 15 to 17 illustrate buckling of the upper bar, rupture of a welded node, and buckling of the diagonals respectively.
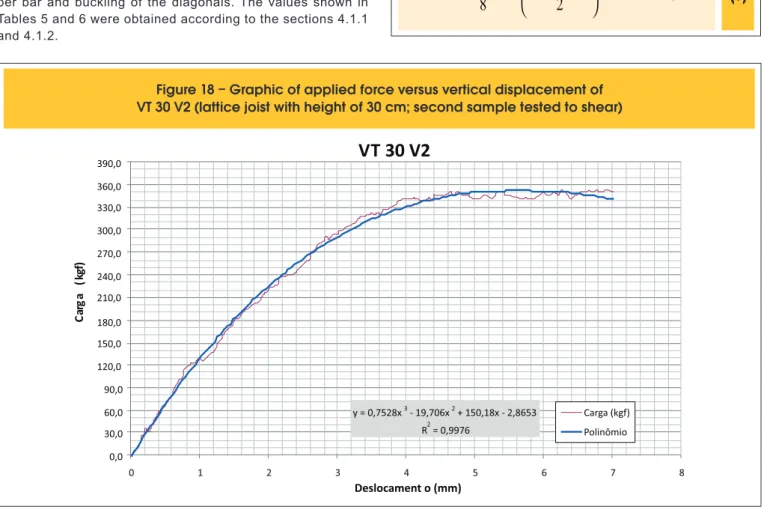
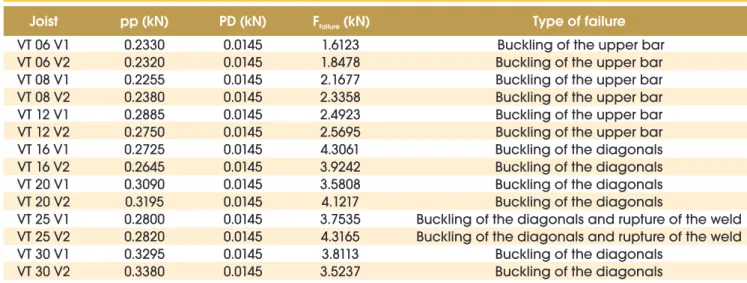
3.3 Shear test results
As well as for bending test, each shear test generated a graphic
of applied force versus vertical displacement, as illustrated in Fig
-ure 18, indicating the maximum force resisted by the joist. The
obtained results are summarized in Table 4, and Figures 15 to 17
illustrate the indicated types of failure.
4. Analysis of the results
5For bending and shear tests, will be considered the results and its
applications.
4.1 Bending tests
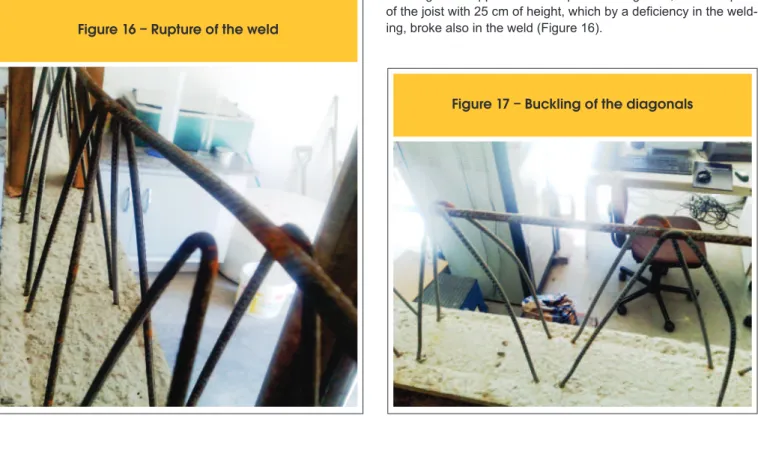
In the positive bending tests, most of the joists reached failure by
buckling of the upper bar or compressed diagonals, with exception
of the joist with 25 cm of height, which by a deiciency in the weld
-ing, broke also in the weld (Figure 16).
Figure 15 – Buckling of upper bar
Figure 1
6 – Rupture of the weld
Figure 17 – Buckling of the diagonals
5 In this section several equations are presented. They were obtained by summation of bending moments, shear forces, and homogenization of cross section. The equation of Euler’s critical loading is also used, and in section 4.3 this
Another objective of the analysis of the results is determine
effective lengths of buckling for parts of the lattice, since
the consideration of the articulated nodes (Classic Me-chanics) is not real in these structures. The actual length
of buckling allows the determination of a limit loading for
the structure.
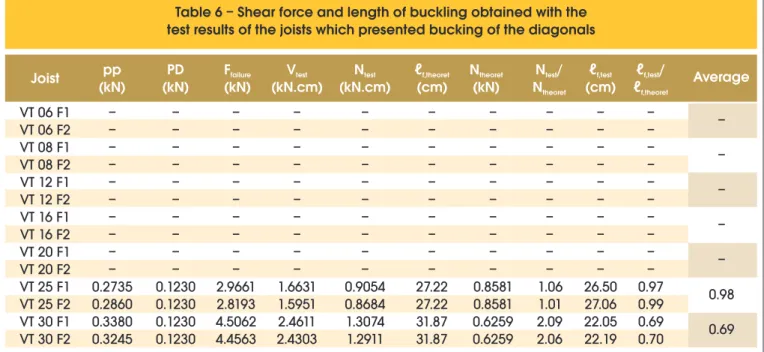
Tables 5 and 6 present the values of the resisting moment
and the lengths of buckling, calculated based on test results,
according to the following procedure for buckling of the up
-per bar and buckling of the diagonals. The values shown in
Tables 5 and 6 were obtained according to the sections 4.1.1 and 4.1.2.
4.1.1 Bending test with failure by buckling of the upper bar
The resisting moment and the length of buckling will be considered
in this subsection. a) Resisting moment
The test resisting moment is calculated by Equation 3.
(3)
h
P
F
PD
pp
M
ensaio ruina86
,
67
CRensaio.
2
8
260
,
=
´
÷
ø
ö
ç
è
æ
+
+
´
=
Table 3 – Bending tests results
Joist
pp (kN)
PD (kN)
F (kN)
limitF
failure(kN)
Type of failure
VT 06 F1
VT 06 F2
VT 08 F1
VT 08 F2
VT 12 F1
VT 12 F2
VT 16 F1
VT 16 F2
VT 20 F1
VT 20 F2
VT 25 F1
VT 25 F2
VT 30 F1
VT 30 F2
0.2355
0.2310
0.2275
0.2325
0.2850
0.2865
0.2605
0.2675
0.3100
0.3200
0.2735
0.2860
0.3380
0.3245
0.1230
0.1230
0.1230
0.1230
0.1230
0.1230
0.1230
0.1230
0.1230
0.1230
0.1230
0.1230
0.1230
0.1230
Buckling of the upper bar
Buckling of the upper bar
Buckling of the upper bar
Buckling of the upper bar
Buckling of the upper bar
Buckling of the upper bar
Buckling of the upper bar
Buckling of the upper bar
Buckling of the upper bar
Buckling of the upper bar
Buckling of the upper bar and rupture of the weld
Buckling of the diagonals and rupture of the weld
Buckling of the diagonals
Buckling of the diagonals
0.4100
0.3815
0.6650
0.6500
1.0635
1.0060
2.2168
1.9935
2.5176
2.7000
2.3877
2.0075
3.0411
2.7421
0.8608
0.7667
1.1292
1.1344
1.3897
1.2456
2.6331
2.4128
3.0637
3.2138
2.9661
2.8193
4.5062
4.4563
pp - self-weight; PD - weight of the test device; F = corresponding force to deflection of 5.2 mm (L/500); Flimit failure = force that produces the buckling of some component of the joist or the rupture of a welded node.
Figure 18 – Graphic of applied force versus vertical displacement of
VT 30 V2 (lattice joist with height of 30 cm; second sample tested to shear)
VT 30 V2
y = 0,7528x3 - 19,706x2 + 150,18x - 2,8653 R2 = 0,9976
0,0 30,0 60,0 90,0 120,0 150,0 180,0 210,0 240,0 270,0 300,0 330,0 360,0 390,0
0 1 2 3 4 5 6 7 8
Carga (kgf) Polinômio
Ca
rg
a
(k
gf
)
631 IBRACON Structures and Materials Journal • 2013 • vol. 6 • nº 4
The value 260 cm is the theoretical span of the test; 86.67 cm is the length of the middle third of the span, relative to the application of the load; PD is the weight of the test device; PCR,test is the critical
loading that caused the buckling; and h is the height of the joist. b) Length of buckling
Equations from 4 to 6 were used to calculate the length of buckling when failure was by buckling of upper bar.
(4)
2 , 2 ,.
.
ensaio f BS s ensaioCR
E
I
P
p
=
(5)
h
I
E
M
ensaio f BS sensaio 2
.
.
.
, 2
p
=
(6)
h
M
I
E
ensaio BS s ensaiof
.
.
.
2
,
p
=
PCR,test is the critical load that causes buckling; IBS is the moment of inertia of the cross section of upper bar; Es is the modulus of
elasticity of the steel, assumed with value 21000 kN/cm²; ℓf,test is
effective length of buckling; Mtest is the bending moment relative to the test; and h is the height of the joist.
4.1.2 Bending test with failure by buckling of the diagonals In this subsection will be considered the shear force, the normal
force in a diagonal, and its respective length of buckling.
a)Shear force
Shear force of the test (Vtest) is calculated by Equation 7.
(7)
130
5
,
0
)
(
+
´
+
´
=
PD
F
pp
V
ensaio ruinaPD is the weight of the test device; Ffailure is the maximum force of the test; and pp is the self-weight of the joist.
Axial force in a diagonal
The axial force of the test in a diagonal (Ntest) is determined by
Equation 86.
(8)
h
V
N
ensaio fteóricoensaio
.
2
.
,=
testV
is the shear force of the test;h
is the height of the joist; and
f,theoret is the theoretical length of buckling of the diagonal(Equation 9).
(9)
2 2 2 teórico,f
h
abertura
da
treliça
2
8
cm
passo
do
nó
2
20cm
÷
ø
ö
ç
è
æ
=
+
÷
ø
ö
ç
è
æ
=
+
=
c) Length of buckling
The length of buckling (
f,test) is obtained by Equations 10 e 11.(10)
ensaio ensaio f D s ensaioCR
E
I
N
P
=
2=
, 2 ,
.
.
p
(11)
ensaio D s ensaiof
N
.
E
.
I
2 ,
p
=
sE
is the modulus of elasticity of the steel, assumed as 21000kN/cm²;
I
D is the moment of inertia of the cross section of thediagonal bar; and
N
test is the axial force in a diagonal.In Table 5 can be noted that, for the joists with height less than or
equal 20 cm, the effective length of buckling for the upper bar is
smaller than the distance between the nodes (20 cm). This is
ex-Table 4 – Shear test results
Joist
pp (kN)
PD (kN)
F
failure(kN)
Type of failure
VT 06 V1
VT 06 V2
VT 08 V1
VT 08 V2
VT 12 V1
VT 12 V2
VT 16 V1
VT 16 V2
VT 20 V1
VT 20 V2
VT 25 V1
VT 25 V2
VT 30 V1
VT 30 V2
0.2330
0.2320
0.2255
0.2380
0.2885
0.2750
0.2725
0.2645
0.3090
0.3195
0.2800
0.2820
0.3295
0.3380
0.0145
0.0145
0.0145
0.0145
0.0145
0.0145
0.0145
0.0145
0.0145
0.0145
0.0145
0.0145
0.0145
0.0145
Buckling of the upper bar
Buckling of the upper bar
Buckling of the upper bar
Buckling of the upper bar
Buckling of the upper bar
Buckling of the upper bar
Buckling of the diagonals
Buckling of the diagonals
Buckling of the diagonals
Buckling of the diagonals
Buckling of the diagonals and rupture of the weld
Buckling of the diagonals and rupture of the weld
Buckling of the diagonals
Buckling of the diagonals
1.6123
1.8478
2.1677
2.3358
2.4923
2.5695
4.3061
3.9242
3.5808
4.1217
3.7535
4.3165
3.8113
3.5237
pp = self-weight; PD = weight of the test device; Ffailure = force that produces the buckling of some component of the joist or the rupture of a welded node.
plained by the stiffness that the welded node provides to this upper bar. In theoretical predictions, this node is considered as a perfect articulation. However, when the length of the diagonals increases (joist with 25 cm of height) the stiffness given by the welded node
is small, increasing the length of buckling.
Looking at Table 6, it is noted that the concrete base provides an
additional stiffness to the diagonals, decreasing the length of buck
-ling obtained with the test. The length of buck-ling of the diagonal of
Table 5 – Resisting moment and length of buckling obtained with
test results of the joists which presented bucking of the upper bar
Joist
pp (kN) PD (kN) F (kN)
ruinM (kN.cm)
testM
theoretical(kN.cm)
M /M
test theoretℓ
f,test(cm)
ℓ
f,test/20
Average
VT 06 F1
VT 06 F2
VT 08 F1
VT 08 F2
VT 12 F1
VT 12 F2
VT 16 F1
VT 16 F2
VT 20 F1
VT 20 F2
VT 25 F1
VT 25 F2
VT 30 F1
VT 30 F2
0.2355
0.2310
0.2275
0.2325
0.2850
0.2865
0.2605
0.2675
0.3100
0.3200
0.2735
0.2860
–
–
0.1230
0.1230
0.1230
0.1230
0.1230
0.1230
0.1230
0.1230
0.1230
0.1230
0.1230
0.1230
–
–
0.8608
0.7667
1.1292
1.1344
1.3897
1.2456
2.6331
2.4128
3.0637
3.2138
2.9661
2.8193
–
–
50.2867
46.0626
61.6578
62.0457
74.8154
68.6195
127.9018
118.5826
148.1706
155.0002
142.7549
136.7996
–
–
19.7781
19.7781
26.3708
26.3708
39.5563
39.5563
97.7105
97.7105
122.1381
122.1381
152.6726
152.6726
–
–
2.54
2.33
2.34
2.35
1.89
1.73
1.31
1.21
1.21
1.27
0.94
0.90
–
–
12.54
13.11
13.08
13.04
14.54
15.18
17.48
18.15
18.16
17.75
20.68
21.13
–
–
0.63
0.66
0.65
0.65
0.73
0.76
0.87
0.91
0.91
0.89
1.03
1.06
–
–
pp - self-weight; PD - weight of the test device; F - force that causes buckling of some component of the joist or the rupture of a welded node; ruin
M – moment obtained in the test; Mtest theoret – resistant moment; ℓf,test – effective length of buckling; 20 – length between welded nodes of the upper flange, in centimeters; Average – medium value of ℓf,test/20 for joists of same height.
0.64
0.65
0.74
0.89
0.90
1.05
–
Table 6 – Shear force and length of buckling obtained with the
test results of the joists which presented bucking of the diagonals
Joist
(kN)
pp
(kN)
PD
F
failure(kN)
(kN.cm)
V
test(kN.cm)
N
testN
(kN)
theoretN
N /
theorettestℓ
f,test(cm)
ℓ
ℓ
f,theoretf,test/
ℓ
f,theoret(cm)
Average
VT 06 F1
VT 06 F2
VT 08 F1
VT 08 F2
VT 12 F1
VT 12 F2
VT 16 F1
VT 16 F2
VT 20 F1
VT 20 F2
VT 25 F1
VT 25 F2
VT 30 F1
VT 30 F2
–
–
–
–
–
–
–
–
–
–
0.2735
0.2860
0.3380
0.3245
–
–
–
–
–
–
–
–
–
–
0.1230
0.1230
0.1230
0.1230
–
–
–
–
–
–
–
–
–
–
2.9661
2.8193
4.5062
4.4563
–
–
–
–
–
–
–
–
–
–
1.6631
1.5951
2.4611
2.4303
–
–
–
–
–
–
–
–
–
–
0.9054
0.8684
1.3074
1.2911
–
–
–
–
–
–
–
–
–
–
27.22
27.22
31.87
31.87
–
–
–
–
–
–
–
–
–
–
0.8581
0.8581
0.6259
0.6259
–
–
–
–
–
–
–
–
–
–
1.06
1.01
2.09
2.06
–
–
–
–
–
–
–
–
–
–
26.50
27.06
22.05
22.19
–
–
–
–
–
–
–
–
–
–
0.97
0.99
0.69
0.70
pp - self-weight; PD - weight of the test device; Ffailure - force that causes buckling of some component of the joist or the rupture of a welded node; V – shear force obtained in the test; N – normal force in a diagonal; test test
ℓf,theoret - theoretical length of buckling; Ntheoret - resistant normal force; ℓf,test – effective length of buckling; Average – medium value of ℓf,test/ℓf,theoret for joists of same height.
633 IBRACON Structures and Materials Journal • 2013 • vol. 6 • nº 4
the joist 25 cm height is relatively larger than that of the joist with 30 cm. The possible explanation for this fact is that the failure of
the joist of 25 cm was characterized simultaneously by buckling of upper bar, buckling of the diagonals, and eventually by rupture
of the weld. These combined effects reduced in a drastic way the stiffness of the diagonals, approximating the effective length of
buckling of their respective theoretical value. Possibly these value
would be different if the weld execution was better.
4.1.3 Analysis of the maximum displacement (delection)
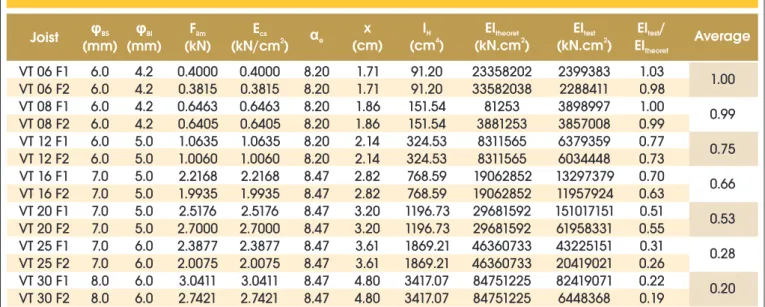
On the Table 7 are presented the values of lexural rigidity (EI),
calculated based on the results of the tests, according to the pro-cedure described in this subsection.
a) Limit delection
The limit delection is calculated using the Equations 12 and 13.
(12)
cm
EI
F
a
ensaio iteite
23
.
1296
.
.
(
)
1
500
500
260
,0
52
3 lim
lim
ú
=
=
=
û
ù
ê
ë
é
=
(13)
ite iteensaio
F
a
EI
lim 3
lim
.
1
1296
.
.
23
)
(
ú
û
ù
ê
ë
é
=
limF
is the force corresponding to the delection of 5.2 mm;a
limis the limit delection obtained by the division of the span
by 500,Table 7 – Determination of the product of stiffness relating to the test
Joist
(cm)
x
I
H4
(cm )
EI
theoret 2(kN.cm )
EI
test 2(kN.cm )
EI /
testEI
theoretφ
BS(mm)
(mm)
φ
BI(kN)
F
lim(kN/cm )
E
cs 2α
eAverage
VT 06 F1
VT 06 F2
VT 08 F1
VT 08 F2
VT 12 F1
VT 12 F2
VT 16 F1
VT 16 F2
VT 20 F1
VT 20 F2
VT 25 F1
VT 25 F2
VT 30 F1
VT 30 F2
6.0
6.0
6.0
6.0
6.0
6.0
7.0
7.0
7.0
7.0
7.0
7.0
8.0
8.0
4.2
4.2
4.2
4.2
5.0
5.0
5.0
5.0
5.0
5.0
6.0
6.0
6.0
6.0
0.4000
0.3815
0.6463
0.6405
1.0635
1.0060
2.2168
1.9935
2.5176
2.7000
2.3877
2.0075
3.0411
2.7421
0.4000
0.3815
0.6463
0.6405
1.0635
1.0060
2.2168
1.9935
2.5176
2.7000
2.3877
2.0075
3.0411
2.7421
8.20
8.20
8.20
8.20
8.20
8.20
8.47
8.47
8.47
8.47
8.47
8.47
8.47
8.47
1.71
1.71
1.86
1.86
2.14
2.14
2.82
2.82
3.20
3.20
3.61
3.61
4.80
4.80
91.20
91.20
151.54
151.54
324.53
324.53
768.59
768.59
1196.73
1196.73
1869.21
1869.21
3417.07
3417.07
23358202
33582038
81253
3881253
8311565
8311565
19062852
19062852
29681592
29681592
46360733
46360733
84751225
84751225
2399383
2288411
3898997
3857008
6379359
6034448
13297379
11957924
151017151
61958331
43225151
20419021
82419071
6448368
1.03
0.98
1.00
0.99
0.77
0.73
0.70
0.63
0.51
0.55
0.31
0.26
0.22
0.19
φBS - bar diameter of the upper flange; φBI - diameter of the bars of the lower flange; F = corresponding force to deflection of 5.2 mm (lim ℓ/500);
E - concrete secant modulus of elasticity; cs αe - modular coefficient E /E ; s cs
x (cm) - center of gravity position of the homogenized section; IH - moment of inertia of the homogenized section; EItheoret - theoretical stiffness
product; EI - stiffness product relating to the test; Average - average value of EI /EItest test theoret for the joists of same height.
1.00
0.99
0.75
0.66
0.53
0.28
0.20
equal to 5.2 mm in this case;
is the span between the supports(260 cm); and
(
E
I
)
test is the product of stufiness relating to the test. b)Theoretical value of (EI)The (EI)theoretical value was calculated to allow determination of the ratio (EI)test/(EI)theoretical . It was determined by homogenization of the
section in stage I (non-cracked concrete), and considering the se
-cant elasticity modulus of the concrete given by Equation 2. The modular ratio is determined by Equation 14. The position of the
gravity center of the homogenized section and its moment of
iner-tia are obtained by Equations 15 and 16.
(14)
cs s e
=
E
E
a
(15)
s s e BI BS s s e nom BI BI nom BS BSb
h
b
h
c
c
h
x
.
.
.
2
4
2
.
.
.
2
.
2
2
.
4
2 2 2 2 2+
÷÷ø
ö
ççè
æ
+
+
ú
û
ù
ê
ë
é
÷
ø
ö
ç
è
æ +
+
÷
ø
ö
ç
è
æ
-
+
=
a
p
f
f
a
p
f
f
f
f
(16)
2 3 2 2 2 2 4 42
.
.
12
.
..
2
.
2
2
.
4
32
.
64
.
÷
ø
ö
ç
è
æ
-+
+
+
ú
ú
û
ù
ê
ê
ë
é
÷
ø
ö
ç
è
æ
-
-+
÷
ø
ö
ç
è
æ
+
-
-+
+
=
s s s s s e nom BI BI BS nom BS BI BS Hh
x
b
h
b
h
c
x
x
c
h
The variables indicated in Equations 15 and 16 are illustrated in
Figure 19:
x
is the position of the gravity center of thehomog-enized section with reference in the base;
I
H is the moment of inertia of the homogenized section;φ
BS is the diameter of the upper bar;φ
BI is the diameter of the lower lange bars;h
is the height of the lattice;c
nom is the concrete cover of the lower bars alwaysequal to 1.5 cm in the tests;
b
s is the lower width of the concretebase always equal to 11 cm in the tests;
h
s is the height of theconcrete base always equal to 2,5 cm in the tests.
Figure 19 – Cross section of the lattice joist
hs
Ø
BSØ
BIØ
BI bsh
C
no
m
X
y
The theoretical stiffness product (EI)theoretical is given by Equation 17.
(17)
Hcs teórico
E
I
EI
)
.
(
=
In Table 7 it is observed that the concrete strength inluences more
the effective product of stiffness of lower joists (less than 12 cm of height) than the value for higher joists.
4.2 Shear test
The shear test results are shown in Tables 8 and 9. Looking at these results it is clear that the upper bar buckling occurred in the lowest joists (heights of 6 cm to 12 cm). For higher heights (16 cm a 30 cm) took place buckling of the diagonals. This is due to the fact of the bucking length of the diagonals be reduced by the
embedding in the concrete base, lower height of the joists, and stiffness of the welded node.
Table 8 refers to shear tests in which the failure occurred by buck
-ling of the upper bar. It presents values of resistant moment and
buckling length calculated in accordance with procedure indicated
in section 4.2.1.
Table 9 regarding to buckling of the diagonals, in addition to buck
-ing lengths, indicated values of shear force and axial force on the diagonals, obtained with information presented in section 4.2.2.
4.2.1 Shear force test with failure by buckling of the upper bar a) Resistant moment
Table 8 – Moments and lengths of buckling of the shear tests
in which the joists presented buckling of upper bar
Joist
(kN)
pp
(kN)
PD
F
failure(kN)
M
test(kN.cm)
M
theoret(kN.cm)
M /
testM
theoretL
f,testL /20
f,testAverage
VT 06 V1
VT 06 V2
VT 08 V1
VT 08 V2
VT 12 V1
VT 12 V2
VT 16 V1
VT 16 V2
VT 20 V1
VT 20 V2
VT 25 V1
VT 25 V2
VT 30 V1
VT 30 V2
0.2330
0.2320
0.2255
0.2380
0.2885
0.2750
–
–
–
–
–
–
–
–
0.0145
0.0145
0.0145
0.0145
0.0145
0.0145
–
–
–
–
–
–
–
–
1.6123
1.8478
2.1677
2.3358
2.4923
2.5695
–
–
–
–
–
–
–
–
43.1339
49.2312
57.4921
61.9002
66.1685
68.1116
–
–
–
–
–
–
–
–
19.7781
19.7781
26.3708
26.3708
39.5563
39.5563
–
–
–
–
–
–
–
–
2.18
2.49
2.18
2.35
1.67
1.72
–
–
–
–
–
–
–
–
13.54
12.68
13.55
13.05
15.46
15.24
–
–
–
–
–
–
–
–
0.68
0.63
0.68
0.65
0.77
0.76
–
–
–
–
–
–
–
–
pp - self-weight; PD - weight of the test device; Ffailure - force that produces buckling of some component of the joist or rupture of a welded node;
M - maximum moment of the test; Mtest theoret - theoretical resistant moment; ℓf,test - effective length of buckling; 20 (cm) - length between the welded
nodes of the upper bar; Average - average value of the ratio ℓf,test/20 for joists of the same height.
0.66
0.66
0.77
–
–
–
635 IBRACON Structures and Materials Journal • 2013 • vol. 6 • nº 4
The resistant moment of the test (
M
test) was determined by Equa -tion 18.(18)
h
P
pp
F
PD
M
ensaio(
ruina)
570
22
22
93
=
CR,ensaio.
´
+
´
+
=
PD
is the weight of the test device;F
failureis the force that causes failure;pp
is the self-weight;P
CR,test is the critical loading thatcauses buckling; and
h
is the height of the joist.b) Length of buckling
The effective length of buckling concerning the test (
f,test) wascalculated using the Equations 19 to 21.
(19)
2 , 2 ,.
.
ensaio f BS s ensaioCR
E
I
P
p
=
(20)
h
I
E
M
ensaio f BS sensaio 2
.
.
.
, 2
p
=
(21)
h
M
I
E
ensaio BS s ensaiof
.
.
.
2
,
p
=
Table 9 – Shear and axial forces on the diagonals, and buckling lengths
of the shear tests in which the joists presented buckling of the diagonals
Joist
(kN)
pp
(kN)
PD
F
failure(kN)
V
test(kN)
N
test(kN)
N
theoret(kN)
N /
testNtheoret
L
f,test(cm)
L /
f,testLf,theoret
L
f,theoret(cm)
tAverage
VT 06 V1
VT 06 V2
VT 08 V1
VT 08 V2
VT 12 V1
VT 12 V2
VT 16 V1
VT 16 V2
VT 20 V1
VT 20 V2
VT 25 V1
VT 25 V2
VT 30 V1
VT 30 V2
–
–
–
–
–
–
0,2725
0,2645
0,3090
0,3195
0,2800
0,2820
0,3295
0,3380
–
–
–
–
–
–
0,0145
0,0145
0,0145
0,0145
0,0145
0,0145
0,0145
0,0145
–
–
–
–
–
–
4,3061
3,9242
3,5808
4,1217
3,7535
4,3165
3,8113
3,5237
–
–
–
–
–
–
3,8380
3,5050
3,2258
3,6971
3,3636
3,8506
3,4329
3,1878
–
–
–
–
–
–
2,3132
2,1126
1,8319
2,0995
1,8313
2,0964
1,8237
1,6935
–
–
–
–
–
–
19,29
19,29
22,72
22,72
27,22
27,22
31,87
31,87
–
–
–
–
–
–
0,8510
0,8510
0,6135
0,6135
0,8581
0,8581
0,6259
0,6259
–
–
–
–
–
–
2,72
2,48
2,99
3,42
2,13
2,44
2,91
2,71
–
–
–
–
–
–
11,70
12,24
13,15
12,28
18,63
17,42
18,67
19,38
–
–
–
–
–
–
0,61
0,63
0,58
0,54
0,68
0,64
0,59
0,61
pp - self-weight; PD - weight of the test device; Ffailure - force that produces buckling of some bar of the joist or the rupture of a welded node; V - shear force of test; N - axial force on a diagonal; test test ℓf,theoret - theoretical length of buckling; N theoret - theoretical axial force; ℓf,test - effective length of buckling; Average - average value of the ratio ℓf,ensaio/ℓf,teórico for joists of the same height.
–
–
–
0,62
0,56
0,66
0,60
P
CR,test is the critical load that causes buckling;E
s is the modulusof elasticity of steel, with assumed the value of 21000 kN/cm²;
I
Bs is the moment of inertia of the cross section of the upper bar;test
M
is the maximum moment relative to the test; andh
is the height of the joist.4.2.2 Shear test with failure by buckling of diagonals
a) Shear force
The shear force of the test (
V
test) is given by Equation 22.(22)
110
43
22
19
)
(
+
´
+
´
=
PD
F
pp
V
ensaio ruinaPD
is the weight of the test device;F
failure is the maximum ap-plied force;pp
is the self-weight.b) Axial force on a diagonal
To calculate the axial force of test on a diagonal (
N
test) Equation 237 was used.(23)
h
V
N
ensaio f teóricoensaio
.
2
.
,=
testV
is the shear force of the test;
f,theoret is the bucklingtheoretical length of the diagonal (Equation 9);
h
is the heightof the joist.
c) Length of buckling
The effective length of buckling (
f,test) is given by Equations24 and 25.
(24)
ensaio ensaio
f D s ensaio
CR
E
I
N
P
=
2=
, 2
,
.
.
p
(25)
ensaio D s ensaio
f
N
.
E
.
I
2
,
=
p
D
I
is the moment of inertia of the cross section of the diagonal bars;E
s is the modulus of elasticity of steel, with the assumedvalue of 21000 kN/cm²;
N
test is the axial force of test on adiagonal.
It is observed in Table 8 that the effective length of buckling
obtained in the test for the upper bar is smaller than the dis-tance of 20 cm between the nodes. This is explained by the stiffness that the welded nodes provide to the upper bar. In a theoretical calculation these nodes are considered as perfect articulations.
In Table 9 it is noted that the concrete base provides additional
stiffness to diagonals, decreasing the effective length of buckling
obtained through the test. Again it is noted that the welded node
with a inishing deiciency in the joist of 25 cm of height generated a relative length of buckling larger than in the joist of 30 cm.
Figure 20 – Static scheme and effort diagrams of a joist with the supports
L1 L2 L3 L4
g+q
BENDING MOMENT
SHEAR
4.3 Application of the results
As mentioned in item 1, in the assembly of slabs with lattice joists there is a space between the scaffold support lines. As indicated,
the main objective of this work is to provide information for calculat
-ing the maximum spac-ing that can be used.
The position of the support lines deines a static scheme of the
joist, where each line can be simulated as a simple support, as
illustrated in Figure 20. With this static scheme are obtained bend
-ing moments and shear forces due to self-weight of the joist, weight
of fresh concrete, illing of the slab, workers and equipments used
in the phases of assembly and concreting. These efforts must be resisted by the joists, as it was already commented.
The resistant efforts of the lattice joist are function of the buck
-ling lengths of the bars which compose the lattice. These buck-ling
lengths were determined in the tests. Therefore, the application of
the test results consists in inding the resistant moment and the
resistant shear force of each joist.
The failure modes observed in the tests were: buckling of the up
-per bar under effect of positive bending moment; buckling of the
diagonals due to shear; and failure of the weld in a node, also by
effect of shear. In the sequence, are determined equations for ob
-tain resistant moments and shear forces related to buckling of the
diagonals and rupture of the weld.
4.3.1 Buckling of the upper bar due to bending moment
Figure 21 shows the internal forces scheme of a joist solicited by a
positive bending moment.
637 IBRACON Structures and Materials Journal • 2013 • vol. 6 • nº 4
Figure 21 – Internal force scheme of a joist solicited by positive bending moment
buckling (
f,test) are calculated using Equations 26 to 29:(26)
h
P
M
d,res=
CR.
(27)
2, 2
.
.
ensaio f
BS s
CR
E
I
P
p
=
(28)
h
I
E
M
ensaio f
BS s res
d 2
.
.
.
, 2 ,
p
=
(29)
Média
Média
teórico f ensaio
f,
=
,.
=
20
.
P
CR is the critical load of buckling of the upper bar;h
is the height of the lattice;E
s is the modulus of elasticity of steel, with theas-sumed value of 21000 kN/cm²;
I
BS is the moment of inertia of thecross section of the upper bar; and
Average
is the value indicate in the last column of Table 8.Safety is guaranteed when respected the condition:
(30)
Sd res
d
M
M
,³
M
Sd is the design bending moment.4.3.2 Buckling of the diagonals due to shear
Figure 22 illustrates the scheme of internal forces of a joist sub
-jected to shear.
The value of axial force (
N
) which compresses a diagonal isgiven by Equation 31.
(31)
h
V
N
Sd f teóricoD.
2
.
, ,=
V
Sd is the shear force of design;
f,theoretical,D is the theoreticallength of buckling of the diagonal, given by Equation 9; and
h
isthe height of the joist.
Critical axial force (
P
CR,D) that causes buckling of a diagonal is given by Equations 32 and 33.(32)
2 , 2
,
.
.
ensaio f
D s D
CR
E
I
P
p
=
Figure 22 – Scheme of internal forces of a joist subjected to shear
V
SdN
L
f,theoretical,BS= 20cm
h
L
f,the oreti(33)
Média
D teórico f ensaio
f,
, ,.
=
s
E
is the modulus of elasticity of steel, with the assumed valueof 21000 kN/cm²;
I
D is the moment of inertia of the cross sectionof each diagonal bar;
f,test is the effective length of buckling; Dl theoretica f, ,
is the theoretical length of buckling; andAverage
is the value indicate in the last column of Table 9. Safety is guaranteed when respected the condition:
(34)
N
P
CR,D³
4.3.3 Failure of the weld
The shear force (V) relating to the weld strength of the top node of
the lattice must satisfy to Equation 35, adapted from NBR 14862
(2002) [3].
(35)
nóBS
h
V
.
4
.
.
.
15
p
f
2=
φ
BSis the diameter of the bar which composes the superior langeof the lattice;
h
is the height of the lattice;
node is the lengthbe-tween the nodes of the lattice, ixed in 20 cm.
Being
V
Sd the shear force of design in the transitory phase; safety is guaranteed when is respected the condition:(36)
V
V
Sd£
4.3.4 Calculation of displacement
In the transitory phase is recommendable that the maximum dis-placement of the joist is smaller than the value of the span divided by 500 (
/
500
). The values of the product of stiffness (EI) shallbe calculated as shown in Equation 37, using Equations 3, 15,
and 16.
(37)
Média
I
E
Média
EI
EI
)
(
)
teórico.
cs.
H.
(
=
=
E
CS is the concrete secant modulus of elasticity, calculated with the characteristic strengthf
ck;I
H is the moment of inertia of the homogenized section; andAverage
is the value indicated in the last column of Table 7.4.3.5 example of application
This example considers the equations presented in items 4.3.1
to 4.3.4. The goal is to find the maximum span (
) between two supports for the joist TR 16 745.a) Data of the example
Figure 23 illustrates the static scheme of the joist. A concrete
cover of 5 cm was adopted, with main inter-axis of 49 cm, and transversal inter-axis of 129 cm. The width of the rib is 9 cm
and the filling is in expanded polystyrene (EPS) as Figure 24
illustrates. The concrete base of the joist was admitted with
f
ck= 35 MPa
.p
is the total load uniformly distributed;g
is the permanent load (includes self-weight of the joist; filling, and fresh concrete placed on the slab);q
is the variable load (includes workersand equipments for concreting).
b) Loading
With the indicated characteristics a permanent load of 2.23 kN/ m² acts in the slab. A variable load of 1.50 kN/m² is adopted.
The loading for the verifications of ultimate limit state (ULS) is considered with the coefficients of increasing for combination
of construction actions indicated in ABNT NBR 6118 [9] (Equa
-tion 38).
Figure 23 – Static scheme of the joist
p = g + q
Figure 24 – Cross section of the main rib
EPS EPS
Fresh concrete
Trussed
5
cm
1
6cm