*e-mail: a[email protected], b[email protected]
On the Nature of Sandwiched Chromium Complexes in
Exchanged
α
α
α
α
α
-Zirconium Phosphate
Claudia Maria de Oliveira Rapôsoa, Jean Guillaume Eonb
Instituto de Química, Universidade Federal do Rio de Janeiro, Ilha do Fundão 21945-970 Rio de Janeiro - RJ, Brazil
Received: April 16, 2001; Revised: July 14, 2002
Layered α-zirconium hydrogenphosphate monohydrate was prepared by direct precipitation, exchanged with n-propylamine and then by chromium aquacomplexes. The solids were character-ized by X-ray diffraction, mass spectrometry, infrared and UV-Visible spectroscopy. The results suggest that monomer complexes form extended, hydrogen bonded, sandwiched monolayers in the interlayer space.
Keywords: layered zirconium phosphate, intercalation, chromium aquacomplexes
1. Introduction
Layered phosphates such as Zr(HPO4)2.H2O, or α-ZrP, have important applications as ion-exchangers, heteroge-neous catalysts and ionic conductors1,2. These materials
read-ily undergo cationic exchange after interlayer separation by alkylamines. In particular, the perspective of increasing the layer separation by oxide intercalation, and ultimately pro-duce stable, porous materials after thermal processing has stimulated a variety of studies in the field3,4.
Exchange of α-ZrP with small cations such as Li+, Na+,
Ag+, Tl+, Cu+ and Ca2+ is a fast process. Direct proton
sub-stitution by larger, highly hydrated cations such as Cr3+
re-quires a higher activation energy to expand the interlayer region and occurs more slowly at ambient temperature5. In
these cases, intercalation has proven more effective by start-ing from sodium or n-alkylamines exchanged materials3.
Different phases were thus obtained upon varying the load-ing, and using Cr3+ aqua, amine or ethylenediamine
com-plexes. In all cases, however, the interlayer distance fell in the range below 11 Å6-8.
Only intercalation of amine exfoliated α-ZrP using Cr3+
or mixed Fe/Cr3+, Ga/Cr3+ and Al/Cr3+ polyhydroxy acetates
was reported to increase the interlayer space between 13.0 and 39.0 Å, as a function of metal loading and resulted in porous materials with high specific area after calcination9-13.
The presence of octahedral Cr3+ within the layers, and
some-times Cr6+, was indicated by UV-Visible spectroscopy. These
materials are finding applications as catalysts for oxidation
reactions of small alkanes, alkenes, aromatics or alcools10,13.
The exchange reaction is topotactic in nature, and it is currently assumed that the topology of the layers remains identical to that of the original α-ZrP precursor. However, highly disordered crystals are produced after ion insertion, with probably an irregular stacking sequence of the layers, and X-ray diffraction data cannot be used to provide struc-tural information3,14,15. Through XAS data, it was however
reported that flat dimers (12 Å phase) closed trimers (17 Å phase) or open tetramers (34 Å phase), depending upon the chromium loading, stabilize the interlayer space in the pre-cursor when Cr polyhydroxy acetates are used for interca-lation16.
In the present work, we have applied UV-Visible spectroscopy to analyze the structure of solids intercalated with chromium aquacomplexes. Oligomer-containing so-lutions were prepared by dissolving the freshly precipitated hydroxide in dilute nitric acid or adding triethylamine to aqueous solutions of the salt. A structural model is proposed which justifies the failure of expansion of the interlayer space.
2. Experimental
pre-pared with 5.5 g of salt dissolved in 80 ml; 4 ml hydrofluoric acid and 46 ml of H3PO4 were added with stirring17. α-ZrP
(1.000 g) was exfoliated using an 0.1 M n-propylamine (Merck) solution (70 ml), corresponding to 7 meq of n-propylamine/g α-ZrP; the suspension was stirred mag-netically for 24 h, filtered and the solid was washed with water and dried at 50 °C for 16 h14. Two methods were used
for exchange by chromium aquacomplexes. In the first method, the hydroxide was precipitated from aqueous so-lutions of the chloride 0.1 M by addition of sodium hydrox-ide 0.3 M, separated and dissolved in aqueous nitric acid solution using the amount corresponding to the theoretical hydrolysis degree, Z = [OH-]/[Cr3+] = 2. In the second
method, triethylamine was added to aqueous solution of the chloride with a cation:triethylamine ratio of 1:1. In both cases, the chromium concentration in solution was 0.1 M. N-propylamine exchanged ZrP was added to the solution with 10 meq Cr3+/g α-ZrP; the suspension was stirred for
24 h, filtered and the resulting solid was washed with water and dried at 50 °C for 16 h. The solids were further calcinated for 2 h at 300 °C under air.
Four solids were obtained and named ZrP(x, T) where x = h when the precursor was the hydroxide or x = t when triethylamine was used. T indicates the temperature of the thermal treatment (T = 50 °C or T = 300 °C).
Thermal decomposition of dried sample was followed by mass spectrometry in the range 25-300 °C using a Balzers OMNISTAR mass spectrometer. The sample was heated at a rate of 10 °C/min and Ar was used as a carrier gas. Fourier-transform infrared spectra were performed in the region 4000-400 cm-1 with a Nicolet, MAGNA 760 apparatus; KBr
pressed discs were used. X-Ray diffraction patterns were recorded in the region 2° ≤ 2θ≤ 60°, step size 0.02° with a PHILIPS PW 1820 automatic powder diffractometer using CuKα radiation, current 40 mA, tension 40 kV and graph-ite monochromator. UV-Visible spectra were recorded in the region 200-900 nm using a Varian, CARY 5 spectrometer equipped with a Harrick diffuse reflectance accessory with Praying Mantis geometry. Barium sulfate was used as a ref-erence. Atomic absorption spectrometry was realized on a Perkin Elmer 1100B and elemental CHN analysis was per-formed using a Perkin Elmer 2400 apparatus.
3. Results and Discussion
X-ray diffraction patterns of precipitated α-ZrP, Fig. 1a, indicated that a well crystallized material was obtained, in agreement with published data. Chemical analysis confirmed the stoichiometry of the phase, with 38.19 wt.% ZrO2, 51.46 wt.% P2O5 and 10.22 wt. H2O (theoretical values: 40.19 wt.%, 47.12 wt. and 11.97 wt.% respectively). The FTIR spectrum is shown in Fig. 2a, and the attribution of the bands is given in Table 1 according to the literature18-20.
In particular the splitting of crystallization water band νas (OH) at 3592 cm-1 and 3509 cm-1 is clear in the spectrum.
According to the literature, these bands are modified after exchange reactions.
The X-ray diffraction pattern in Fig. 1b shows that, af-ter inaf-tercalation by n-propylamine, maaf-terials with lower cristallinity were obtained with interlayer distance of 17.26 and 16.36 Å. These values agree with literature reports and
Table 1. Bands attributions in FTIR spectra of alpha-zirconium phosphate and zirconium phosphate exfoliated with n-propylamine dried at 50 °C.
Assignment α-ZrP α-ZrP/n-propylamine (cm-1) (cm-1)
νas(OH) 3592 ———
νas(OH) 3509 ———
νs(NH-OH) ——— 3416
ν(POH) 3353 ———
νs(OH) 3139 ———
2δ(N-H) ——— 2968-2937
νs(C-H) ——— 2881
ν(POH) 2300 ———
ν(POH) 2100 ———
δas(OH) 1611 1636
δ((CNH)in-NH2) ——— 1557-1395
vin(POH) 1252 ———
δ(CNH) ——— 1209
νs(PO4) 1130-964 1132-976
δout(POH) 600 610
δ(PO4) 530 542
indicate effective insertion of the amine into the interlayer space21. The corresponding FTIR spectrum reported in
Fig. 2b, and attributed in Table 1, shows clearly the charac-teristic vibration bands from the amine and the phosphate group. The bands at 610 and 542 cm-1 attributed to
defor-mation modes of PO4, however, are slightly shifted in rela-tion to those of the precursor, probably due to the presence of n-propylamine2,22. The results obtained by chemical
analy-sis (viz. 15.55 wt.% C, 4.16 wt.% H and 6.12 wt.% N),
indicate that the exchange corresponded to 90% of the total exchange capacity of α-ZrP.
Figure 3 shows the mass spectra corresponding to the removal of water and n-propylamine intercalated in α-ZrP between 25 and 300 °C. Water alone is first eliminated up to 120 °C, probably adsorved water as suggested earlier23,
then n-propylamine and water evolve simultaneously in four steps between 170 and 260 °C. The reaction appears to be complete at 300 °C, which led to choose this temperature for sample calcination.
Chemical analysis after exchange indicated Cr and wa-ter contents of 13.5 wt.0% and 26 wt.% respectively, corre-sponding to a ratio Cr/Zr ≅ 0.84 for material prepared from the hydroxide precursor.
Figure 4 compares the FTIR spectra of α-ZrP exchanged with Cr(III) for both preparation methods, after drying and calcination. Only weak bands from residual n-propylamine are observed in the exchanged solid, but no new band from triethylamine. Moreover, the spectra of exchanged materi-als show a broad band near 3420 cm-1 which is
characteris-tic of intercalated solids18. The same features were observed
in the case of materials prepared from hydroxides. These results confirm the efficiency of both intercalation meth-ods. In particular, the absence of intercalation of triethyl-amine was expected from steric hindrance.
X-ray diffraction patterns of α-ZrP intercalated with Cr(III) are shown in Fig. 5. Dried materials display broad patterns which are characteristic of transition metal ions-intercalated compounds with low cristallinity, but a few sharp lines are also observed in superposition; these could be attributed to residual amine-intercalated phases, in agree-Figure 2. a) Infrared spectra of α-ZrP; b) α-ZrP/n-propylamine;
dried at 50 °C.
Figure 3. a) Decomposition mass spectra of α-ZrP/n-propylamine dried at 50 °C water; b) n-propylamine.
ment with FTIR spectra. Only broad bands are observed after calcination for 2 h at 300 °C, which were attributed to chromium intercalated compounds. The corresponding interplanar distances obtained from X-ray diffraction pat-terns of these solids are listed in Table 2. A comparison between dried solids shows interlayer distances of 9.8 Å, equal for materials prepared by both methods, and in agree-ment with values cited in the literature24. The increment of
2.24 Å in relation to the interlayer separation in the hydrate Zr(HPO4)2.H2O together with chemical analysis and FTIR results confirms chromium insertion within the interlayer space but suggests that not more than one cationic layer was intercalated. After calcination, the interlayer distances decreased to values of 9 Å for both samples.
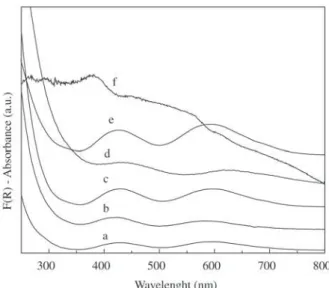
Figure 6 shows UV-visible spectra of α-ZrP intercalated with Cr(III) in comparison with the spectrum of chromium hydroxide dried at 50 °C and the spectrum of chromium solution obtained after hydrolysis of the hydroxide. The spectra obtained from dried intercalated solids using both preparation methods are similar, only a lower intensity was obtained for the sample exchanged using triethylamine, suggesting that lower chromium content was attained by this method. With exception of ZrP(h, 300), all compounds present two bands in the ranges of 400-450 and 550-600 nm which can be assigned respectively to 4T
1g←4A2g and 4T
2g ← 4A2g d-d transitions of octahedral chromium
aquacomplexes25. The bands observed at 423 and 586 nm
for chromium in aqueous solution are characteristic of oli-gomeric species, probably the trimer, tetramer or hexamer complexes, as expected from the hydrolysis degree26. It is
interesting to note, however, that equilibrium was reached as soon as chromium hydroxide was hydrolyzed, as opposed to solutions prepared by addition of base to the monomer. The bands corresponding to chromium hydroxide are seen at 427 and 593 nm. Dried intercalated solids show two bands near 429 and 594 nm. It is currently admitted that d-d tran-sition bands shift towards the lower energy region in pro-portion as chromium species form an extended structure; the position of the bands of the pentaquahydroxy complex [Cr(OH)(OH2)5]2+, which are seen at 430 and 590 nm
fol-lowing26,27, and of chromium hydroxide indicate that the
correlation is not straightforward, since the latter compound is built from hydrogen bonded monomeric [Cr(OH)3(H2O)3] complexes28. The experimental data rather suggest that the
partial charge on the chromium atom should be considered to be responsible for the shift.
The intensity ratios (ε1/ε2) between the two bands are listed in Table 3. Some authors have suggested that higher values were to be assigned to condensed chromium com-Table 2. Interplanar distances of alpha-zirconium phosphate in-tercalated with Cr(III), dried at 50 °C and calcined at 300 °C/2 h. ZrPCr(h, 50) ZrPCr(h, 300) ZrPCr(t, 50) ZrPCr(t, 300)
d(Å) d(Å) d(Å) d(Å)
9.71 9.28 12.77 8.99
4.87 4.50 9.80 4.53
4.35 4.25 4.82 3.45
2.65 2.64 3.10 2.63
2.00 2.00 2.64 —
Figure 6. a) UV-Visible spectra of chromium solution; b), ZrP(t, 50); c), ZrP(h, 50); d), ZrP(t, 300); e) chromium hydroxide; f) ZrP(h, 300).
Table 3. Band features in electronic spectra of Cr(III) intercalated solids dried at 50 °C and reference samples.
Sample Absorption (nm) IntensityRatio (ε1) (ε2) (ε1/ε2) ZrPCr(h, 50) 432 600 1.03 ZrPCr(t, 50) 432 602 1.07 Chromium Hydroxide 427 594 0.81 Original Solution 423 585 1.48
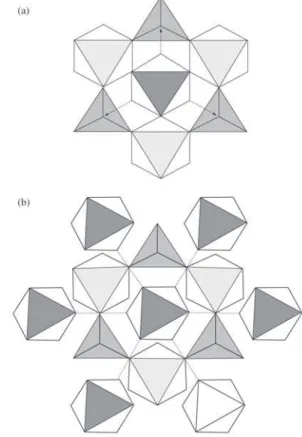
Figure 7. Polyhedral representation of alpha-zirconium phosphate intercalated with chromium (III). The monomers may be linked by hydrogen bonds to the six phosphate groups (a) or within them-selves (b) (see text).
plexes. Indeed, absorption ratios of 1.17-1.18 characterize the monomer and dimer, 1.95 the tetramer, and 1.5-1.6 the pentamer and hexamer26. In comparison, a small value was
obtained in this work for chromium hydroxide whereas the value of 1.75 was given by the literature for the pentaquahydroxy complex. Accordingly, the intensity ratio alone does not provide a satisfactory criterion to character-ize polymerization degrees of chromium complexes.
The comparison of the position of the bands suggest therefore that chromium within the interlayer space of α-ZrP forms an extended structure, based on monomer complexes, comparable to chromium hydroxide. This interpretation is in agreement with the interlayer distance obtained from X-ray diffraction patterns. Chemical analysis results, on the other hand, suggest the exchange of the two protons of α -ZrP by one chromium ion. This leads us to propose that chromium enters the interlayer space as the monomer [Cr(OH)(OH2)5]2+ and forms an extended, hydrogen bonded
structure.
The electronic spectrum of the solid exchanged from hydroxide after calcination is less definite and presents stronger absorption in the high energy region, suggesting that temperature induces some polymerization to chromium oxide. A strong band at 250 nm suggests also the presence of some Cr(VI) ion. This was not observed in the case of the solid α-ZrP(t, 300), probably because of the lower chro-mium content.
The crystal cell of α-Zr(HPO4)2.H2O (α-ZrP) is pseudo-hexagonal with a = 9.076 Å, b = 5.298 Å, c = 15.414 Å and β = 101.71o and belongs to space group P21/c 29. Zirconium
atoms in octahedral coordination lie in the ab plane, bridged
by phosphate groups so that the phosphorus atoms occupy the centers of alternate triangles distributed above and be-low the zirconium planes, forming the layers. POH groups are oriented perpendicular to the layer. The interlayer dis-tance is 7.56 Å with a layer thickness of 6.30 Å 13.
Succes-sive layers are shifted by 1/3 in the a direction and 2/3 in the b direction, so that six POH groups, three from each side of
two consecutive layers, form a cavity with local D3d symme-try. This cavity is closed with two zirconium atoms located on the C3 axis, respectively below and above the basal faces of the triangular antiprism. One such cavity is present per
unit formula of α-ZrP and is occupied by the water mol-ecule, linked by hydrogen bonds to POH groups3,15,30.
Based on the previous results, we suggest that [Cr(OH)(OH2)5]2+ complexes occupy and expand normally
to the layer the zeolitic type cavities in the interlayer space of α-ZrP, while forming as extended structure comparable with that of chromium hydroxide. An hexagonal layer struc-ture was proposed for the latter compound with lattice pa-rameter a = 5.28 Å 31 equal to the pseudo-hexagonal
them-selves as in model (7b) and in a similar fashion to chro-mium hydroxide.
4. Conclusion
Layered α-zirconium hydrogenphosphate monohydrate was intercalated with chromium aquacomplexes. Two meth-ods were compared for cation exchange; chromium hydrox-ide was hydrolyzed with dilute acid or triethylamine was added to an aqueous solution of a chromium salt before addition of the n-propylamine exchanged ZrP. Both proc-esses led to the intercalation of the same species. Electronic spectra suggested that the monomer complex [Cr(OH)(OH2)5]2+, forms an extended, hydrogen bonded
sandwiched monolayer, comparable to chromium hydrox-ide, in preference to oligomer insertion, which prevents a larger expansion of the interlayer space. The chromium content was higher when the hydroxide was used as a pre-cursor. The materials kept their interlayer distances after calcination at 300 °C; however, chromium excess led to some polymerization of chromium oxide. The question arises of whether this polymerization occurs within the interlayer space or not.
Acknowledgments
We thank FINEP, CAPES, and CNPq for financial sup-port during the work. We acknowledge NUCAT (COPPE/ UFRJ) for UV-visible spectra and CBPF for X-ray diffrac-tion patterns.
References
1. Clearfield, A.; Stynes, J.A. Journal Inorganic Nuclei Chemistry, v. 26, p. 117-129, 1964.
2. Goñi, A.; Rius, J.; Insausti, M.; Lezama, L.M.; Pizarro, J.L.; Arriortua, M.I.; Rojo, T. Chemistry of Materials, v.
8: (5), p. 1052-1060, 1996.
3. Alberti, G.; Casciola, M.; Costantino, U.; Vivani, R. Ad-vanced Materials, v. 8, n. 4., p. 291-303, 1996.
4. Oliveira-Pastor, P.; Maireles-Torres, P.; Rodríguez-Castellón, E.; Jiménez-López, A.; Cassangneau, T.; Jones, D. J.; Roziére, J. Chemistry of Materials, v. 8, 1758-1769,
1996.
5. Loukah, M.; Condurier, G.; Vedrine, J.C.; Ziyad, M.
Microporous Materials, v. 4, p. 345-358, 1995.
6. Alberti, A.; Bernasconi, G.; Costantino, U.; Gill, J.S. Jour-nal of Chromatography, v. 132, p. 477-484, 1977.
7. Alberti, G.; Costantino, U.; Gill, J.S. Journal of Inor-ganic and Nuclear Chemistry, v. 38, p. 1733-1739, 1976.
8. Rosenthal, G.L.; Caruso, J. Journal of Solid State Chem-istry, v. 93, p. 123-133, 1991.
9. Maireles-Torres, P.; Olivera-Pastor, P.; Rodriguez-Castellón, E.; Jimenez-López, A.; Tomlinson, A.A.G.
Journal of Materials Chemistry, v. 1(5), p. 739-746, 1991.
10. Xiao, J.; Xu, J.; Gao, Z. Catalysis Letters, v. 57, p.
37-42, 1999.
11. Perez-Reina, F.J.; Olivera-Pastor, P.; Rodriguez-Castellón, E.; Jimenez-López, A.; Fierro, J.L.G. Jour-nal of Solid State Chemistry, v. 122, p. 231-238, 1996.
12. Ramos-Barrado, J.R.; Martín, F.; Rodriguez-Castellón, E.; Jimenez-López, A.; Oliveira-Pastor, P.; Pérez-Reina, F. Solid State Ionics, v. 97, p. 187-194, 1997.
13. Solsona, B.; López-Nieto, J.M.; Alcántara-Rodríguez, M.; Rodríguez-Castellón, E.; Jimenez-López, A. Jour-nal of Molecular Catalysis A: Chemical, v. 153, p.
199-207, 2000.
14. Alberti, G.; Casciola, M.; Costantino, U. Journal of Colloid and Interface Science, v. 107, n.1, p. 256-263,
1985.
15. Clearfield, A.; Costantino, U. Comprehensive Supramolecular Chemistry, v. 7, p. 107-149, 1996.
16. Jones, D.J.; Roziére, J.; Maireles-Torres, P.; Jiménez-López, A.; Oliveira-Pastor, P.; Rodriguez-Castellón, E.; Tomlison, A.A.G. Inorganic Chemistry, v. 34,
p.4611-4617, 1995.
17. Alberti, G.; Torraca, E. Journal of Inorganic and Nu-clear Chemistry, v. 30, p.317-318, 1968.
18. Horsley, S.E.; Nowell, D.V.; Stewart, D.T.
Spectrochimica Acta, v. 30A, p. 535-542, 1974.
19. Busca, G.; Lorenzelli, V.; Galli, P.; La Ginestra, A.; Patrono, P. Journal of Chemiscal Society Faraday Transictions I, v. 83, p. 853-864, 1987.
20. Slade, R.C.T.; Knowels, J.A.; Jones, D.J.; Roziére, J.
Solid State Ionics, v. 96, p. 9-19, 1997.
21. MacLachlan, D.J.; Morgan, K.R. Journal Physical Chemistry, v. 96, p. 3458-3464, 1992.
22. Colthup, N.B.; Daly, L.H.; Wiberley, S.E. Introduction To Infrared And Raman Spectroscopy, United States of
America: Academic Press Limited, 1990, 339p. 23. Peeters, K.; Carleer, R.; Mullens, J.; Vansant, E.F.
Microporous Materials, v. 4, p. 475-487, 1995.
24. Allulli, S.; La Ginestra, A.; Massucci, M.A.; Pelliccioni, M.; Tomassini, N. Inorganic Nuclei of Chemistry Let-ters, v. 10, n. 4, p. 337-341, 1974.
25. Lever, A.B.P. Inorganic Electron Spectroscopy, Elsevier
Publishing Company, Amsterdam, 1968.
26. Stünzi, H.; Marty, W. Inorganic Chemistry, v.22, n.3,
p.2145-2150, 1983.
27. Emerson, K.; Marty, W. Journal of Inorganic Nuclear Chemistry, v. 11, p. 309-313, 1983.
28. Giovanoli, R.; Stadelmann, W.; Feitknecht, W. Helvetica Chimica Acta, v.56 (3), n. 81, p.839-847, 1973.
29. Clearfield, A.; Smith, G.D. Inorganic Chemistry, v. 8, n.
3, p. 431-436, 1969.
30. Costantino, U.; Szirtes, L.; Kuzmann, E.; Megyeri, J.; Lázár, K. Solid State Ionics, v. 141-142, p. 359-364, 2001.