ISSN 1517-7076 artigo e11799, 2017
Autor Responsável: Renato Adriano Damiani Data de envio: 10/05/2016 Data de aceite: 14/12/2016
10.1590/S1517-707620170001.0131
Influência da temperatura de molde associada com
o uso de fibra de vidro nas propriedades
mecânicas e térmicas do nanocompósito
(PA6/FV/MMT)
Influence of Mold Temperature Associated
with Glass Fiber on the Mechanical and
Thermal Properties of a (PA6/GF/MMT)
Nanocomposite
Renato Adriano Damiani 1, Glaucea Warmeling Duarte 2, Luciano Luiz Silva3, Josiane Maria Muneron de Mello3, Eduardo Roberto Batiston4,
Humberto Gracher Riella2, Márcio Antônio Fiori3
1
Post-Graduate Program in Science and Materials Engineering, Universidade do Extremo Sul Catarinense (UNESC), Criciúma, 88806-000, SC, Brazil
e-mail: [email protected] 2
Post-Graduate Program in Chemical Engineering, Universidade Federal de Santa Catarina (UFSC), Florianópolis, 88040-900, SC, Brazil
e-mail: [email protected]; [email protected] 3
Post-Graduate Program in Environmental Science and Post-Graduate Program in Technology and Management of the Innovation, Universidade Comunitária da Região de Chapecó (UNOCHAPECÓ), Chapecó, 89809-000, SC, Brazil e-mail: [email protected]; [email protected]; [email protected].
4
Civil Engineering Departamet, Universidade Comunitária da Região de Chapecó (UNOCHAPECÓ), Chapecó, 89809-000, SC, Brazil
e-mail: [email protected]
ABSTRACT
This work describes the second of a series of studies of the effects of injection molding conditions on the mechanical and thermal properties of Polyamide 6/Glass Fiber/Montmorillonite (PA6/GF/MMT) composites and was motivated by the lack of information about how the processing variables influence on the properties of three-phase composites containing fiber glass. By this time, the effects of the injection molding tempera-ture associated with the fiber glass percentage on the mechanical and thermal properties of the composite are investigated. Some samples were processed, following a statistical experimental factorial planning, varying the mold temperature and the fiber glass percentage and maintaining 5 wt % of the MMT. The samples were submitted to tensile and flexural tests, XRD, SEM and DSC. The studies showed that an increase in the mold temperature and the fiber percentage improves the maximum tensile and flexural stresses. The increased mold temperature slows the cooling rate, which, over time, decreases the degree of crystallinity. However, there is an increase in the intercalation of the polymeric chains and the nanoclay lamellae, and the structure forms with fewer defects.
Keywords: Polymer-matrix composites (PMCs); Glass Fiber; Injection Molding.
1. INTRODUCTION
Amongst the polymeric nanocomposites, those based on clay and layered silicates are widely inves-tigated due to their availability, the capacity for intercalation of the clay lamellae and the exceptional en-hancement of their mechanical properties. This multifunctionality, combined with low filler content makes these nanocomposites suitable materials for special industrial applications such as engineering polymers [8,
9]. Because of the nanometer-sized particles, these nanocomposites exhibit improved mechanical, thermal, optical and physicochemical properties when compared with a pure polymer or composites containing mi-croparticles [10,11].
The montmorillonite is the most used layered silicate and belongs to the structural family known as the 2:1 phyllosilicates. To make these hydrophilic phyllosilicates more compatible with the organic polymers, the hydrated cations of the interlayer are exchanged with cationic surfactants such as alkylammonium and alkyl phosphonium (onium) [1]. These processes increase the basal spacing and improve the compatibiliza-tion between the filler and the polymer matrix of the composites, and can enhance the intercalacompatibiliza-tion of the polymeric matrix in the basal spacing of the nanoclays. The intercalation of the polymers can be achieved if an affinity exists between the lamellae of the nanoclays and the polymer chains of the composite matrices. If the intercalation is effective, then the total exfoliation of the lamellae in the nanofiller occurs, yielding the best mechanical properties in the nanocomposite [2,4].
The layered silicate-based nanocomposites are a promising new class of materials. The improved thermo-mechanical properties are attained with a very low filler content (5 wt% or less), with easy manufac-turing processes of extrusion and injection, and with easy intercalations of the fillers during these fusion pro-cesses [1]. Many research studies have shown that the twin-screw extruder processes, with controlled param-eters, produce nanocomposites with exfoliated nanoclay and many types of thermoplastic matrices [4,12-14]. Another reinforcement used in thermoplastic composites is fiberglass [15,16]. These materials are used for engineering applications and offer improved physical properties over the unfilled materials [17]. These composites are processed by conventional methods such as injection molding.
Adding short reinforcing fibers to a polymeric matrix generally increases the viscosity of the poly-mer melt during its manufacture for injection molding. Higher fiber volume fractions promote higher viscosi-ty. Therefore, there is a practical limit to the fiber volume fraction of approximately 40 wt%, which limits its application as a structural component in composites [17].
Although two-phase polymer composites and nanocomposites have been extensively studied for many types of polymers, the details of the processing variables and their effects on the characteristics of three-phase composites containing particles or fiber glass have rarely been reported [18-21]. Recent studies by DAMIANI et al. [22] have demonstrated significant improvements in the mechanical properties of poly-amide 6 (PA6) polymers containing glass fibers (GF) and montmorillonite (MMT) by adjusting the mass temperature in the injection molding process. The results obtained by DAMIANI et al. [22] demonstrated that composites processed at lower mass temperatures exhibited higher tensile and flexural strengths. Higher strengths result from different mass temperatures that lead to PA6 matrices with different degrees of crystal-linity. In addition, changes in the mass temperature affect the fiber–matrix adhesion of the composite and the intercalation between the matrix and the various components in the nanocomposite [22].
This work is the second in a series motivated by a lack of detailed information on the effects of the injection molding process variables on the mechanical properties of PA6/GF/MMT composites. According to the first published work of DAMIANI et al. [22], the injection molding process parameters can have a signif-icant effect on the mechanical and thermal properties of the PA6/GF/MMT nanocomposites. The objective of the study was to evaluate the effect of the mold temperature and the GF percentage in the injection molding process on the mechanical and thermal properties of the PA6/GF/MMT nanocomposites.
2. MATERIAIS E MÉTODOS
2.1 Materials
2.2 Preparation of nanocomposites
In this study, three different compositions were used as standards: PA 6, PA 6 with 5.0 wt% of MMT and PA 6 with 25.0 wt% of fiberglass. Statistical experimental factorial planning was used to evaluate the effects of the mold temperature and the weight percentage of the fiberglass on the mechanical properties of the compo-sites maintaining 5 wt % of the MMT, as shown in Table 1. The mold temperatures used were 13.0 ºC, 42.5 ºC and 72.0 ºC as minimum, medium and maximum values, respectively. The weight percentages of fiber-glass used were 5.0 wt % as a minimum value, 17.5 wt % as a medium value and 30.0 wt % as a maximum value. The GF and MMT were incorporated into the PA 6 matrix using a co-rotating twin screw extruder with a screw diameter of 20 mm (Model SJ20 – manufactured by Zhangjiagang Yuanfeng Plastic Machinery Co., Ltd.). The extruder processing parameters were a screw speed of 170 rpm and the following heating temperatures: zone 1 = 210.0 °C, zone 2 = 215.0 °C, zone 3 = 220.0 °C, zone 4 = 225.0 °C, zone 5 = 230.0 °C, zone 6 = 235.0 °C, and zone 7 = 240.0 °C. After processing, the composite was obtained in the form of a pellet and dried again in the oven for over 24 h at 80.0 ºC. The pellets were injected into molds to produce samples for tensile and flexural analysis.
Table 1: Statiscal Experimental Factorial Planning for the compositions with constant value of the MMT (5 wt %).
Experiments Mold Tem-perature (ºC)
Fiber Glass Percentage
1 13.0 5.0
2 72.0 5.0
3 13.0 30.0
4 72.0 30.0
5 42.5 17.5
The injection molding was performed by a HIMACO LHS 150-80 injection molding machine. The mass temperature was controlled during the injection molding process by heating the plasticizing cylinder to the following temperatures: 208.0 °C, 215.0 °C, 225.0 °C, 235.0 °C and 242.0 °C. The mold temperature was controlled by a water cooling and heating system consisting of a thermocouple to measure the water tempera-ture at the outlet of the mold, a temperatempera-ture controller and an electric resistance heater.
2.3 Characterization of nanocomposite
The samples obtained according to the statistical planning were subjected to tensile and flexural tests to eval-uate the effects of the mold temperature and the GF percentage on the mechanical properties of the compo-sites. The mechanical analysis was performed using an EMIC DL model 10000 universal testing machine. The tensile test was performed according to ASTM D638, using a test speed of 10.0 mm.min-1 and the flex-ural test was performed according to ASTM D790, using a speed of 5.0 mm.min-1, a deformation of 5.0 % and a maximum deflection of 10.2 mm. This study evaluated the maximum strain for the tensile test and the maximum flexural strength for the flexural test. To assess the effect of the melt temperature and the mold temperature, six test specimens were produced for each test.
The presence of intercalated and exfoliated structures was investigated by X-ray diffractometry using an SHIMADZU XRD-6000 diffractometry system with Cu Kα radiation (0.154 nm) and a 2θ range of 2-60°.
The SEM images were obtained from a JEOL JSM-6390LV microscope using a conventional scan-ning microscope with a tungsten filament, an accelerating voltage of 0.5 to 30 kV, a magnification of 25 to 300,000 times, a high voltage resolution of 3 nm and a low voltage resolution of 4 nm. The instrument was also equipped with a low vacuum mode to evaluate the interface between the polymer, the clay and the fiber-glass.
3. RESULTS AND DISCUSSION
composite for the same deformation, whereas the value for PA6 composite with 25 wt% of fiberglass was higher than that of PA6 containing 5 wt% of MMT. These results agree with the literature, which shows that the presence of fiberglass normally improves the flexural strength and the modulus of elasticity, as well as properties related to the flexural strength, tensile strength and thermal barrier effects [9, 10].
The results mentioned above explain the results obtained by statistical planning, with the variables be-ing the mold temperature and fiber percentage, and the responses bebe-ing maximum tensile stress and maxi-mum flexural stress. These variables are important for injecting PA6/GF/MMT composites.
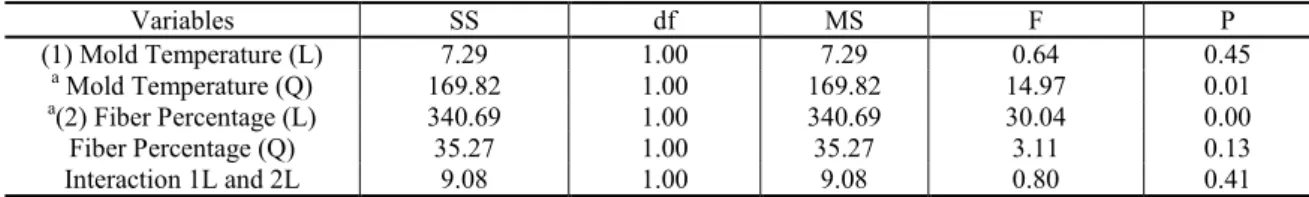
Table 2 and Table 3 show the analyses of variance for maximum tensile stress values and maximum flexural stress values, respectively, determined for different values of mold temperature and fiber percentage. By statistical analysis, it is possible to conclude with 99.8% certainty that the molding temperature and the fiber percentage have a positive effect on the maximum tensile stress properties. We can also conclude with 94.6% certainty that there is a positive interaction between the mold temperature and the fiber percentage variables.
With respect to flexural stress properties, it is possible to conclude with 99.8% of certainty that the fi-ber percentage and mold temperature variables also have a positive effect on the maximum flexural stress properties.
The statistical analysis demonstrated that both process variables are a significant factor in defining the mechanical properties. Therefore, the process conditions affect the mechanical characteristics of the PA6/GF/MMT composites.
Table 2: ANOVA analysis for maximum tensile stress for different molding temperatures and different fiber percentages.
Variables SS df MS F P
a
(1) Mold Temperature (L) 342.03 1.00 342.03 51.33 0.00
a
Mold Temperature (Q) 101.28 1.00 101.28 15.20 0.00
a
(2) Fiber Percentage (L) 213.26 1.00 213.26 32.01 0.00
Fiber Percentage (Q) 4.40 1.00 4.40 0.66 0.42
a
Interaction 1L and 2L 26.08 1.00 26.08 3.91 0.05
a Statistically significant variables.
SS, total sum of squares; DF, degrees of freedom; MS, mean square; F, coefficient of the test-F; P, coefficient of the test-P. (L), linear factor and (Q) quadratic factor.
Table 3: ANOVA analysis for maximum flexural stress for different molding temperatures and different fiber percenages.
Variables SS df MS F P
(1) Mold Temperature (L) 7.29 1.00 7.29 0.64 0.45
a
Mold Temperature (Q) 169.82 1.00 169.82 14.97 0.01
a
(2) Fiber Percentage (L) 340.69 1.00 340.69 30.04 0.00
Fiber Percentage (Q) 35.27 1.00 35.27 3.11 0.13
Interaction 1L and 2L 9.08 1.00 9.08 0.80 0.41
a Statistically significant variables.
SS, total sum of squares; DF, degrees of freedom; MS, mean square; F, coefficient of the test-F; P, coefficient of the test-P. (L), linear factor and (Q) quadratic factor.
3.1 Evaluation of the mold temperature effect
Table 3 shows the mold temperature is a statistically significant variable and has a positive effect on the max-imum tensile stress. Increasing the mold temperature from 13.0 ºC to 72.0 ºC increases the maxmax-imum tensile stress.
Mol d T em p (1 3 °C ) Mol d T em p (7 2 °C ) PA 6 PA 6 + 5 %
MM T PA
6 + 25 %
GF
0 10 20 30 40 50 60 70 80
56.58 MPa 67.22 MPa
66.04 MPa
75.39 MPa Maximum Tensile Strees (MPa)
C o mp o si ti o n 67.26 MPa
Figure 1: Values of maximum tensile stress for different mold temperatures compared with standard values obtained in the scientific literature [22]. Composition for PA 6: GF 17.5 wt%, MMT 5 wt %.
The increase in the mold temperature from 13.0 ºC to 72.0 ºC promotes the increase of the maximum tensile stress values by approximately 12.1%. Comparing these results with the maximum tensile stress val-ues of the standard samples, the samples produced with lower mold temperatures have maximum tensile stresses gets closer PA6 + 25 wt% FG samples (67.26 MPa). For higher mold temperatures the maximum tensile stresses are higher, with a medium value of 75.39 MPa.
Table 3 shows the mold temperature is statistically significant and has a positive effect on the maxi-mum flexural stress. Figure 2 presents the maximaxi-mum flexural stresses for both processing conditions, compar-ing the change in the mold temperature from 13.0 ºC to 72.0 ºC. The increase in the mold temperature pro-motes an increase in the maximum flexural stress values by approximately 5.7%. Comparing these results with the results obtained from the standard samples, the samples produced with lower mold temperatures have maximum flexural stress values higher than the standard samples with higher reference values, and pre-sent a medium value of 96.64 MPa. For higher mold temperatures, the maximum flexural stresses are higher still, with a medium value of 102.11 MPa.
Mol d T em p (1 3 °C ) Mol d T em p (7 2 °C ) PA 6 PA 6 + 5 %
MM T PA
6 + 25 %
GF
0 10 20 30 40 50 60 70 80 90 100 110
86.53 MPa
78.48 MPa
55.39 MPa
102.11 MPa Maximum Flexural Strees (MPa)
C o mp o si ti o n s 96.64 MPa
Given that the processing conditions for mass temperature, screw rotation, injection pressure and in-jection velocity are constant for all the samples produced, the effects on the mechanical properties due to the increase of the mold temperature can be related to the phenomena occurring inside the mold and in the injec-tion channels.
For the lower mold temperature and the fixed mass temperature, the cooling rate of the injected com-posite is higher. Lu et al. analyzed the crystallization behavior of a polymeric nanocomcom-posite cooled at dif-ferent rates and observed that, for the nanocomposite containing PA6 and MMT, the higher cooling rates promoted higher degrees of crystallinity.
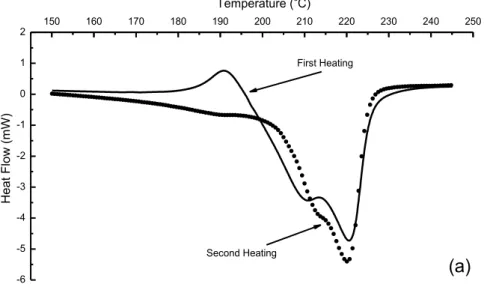
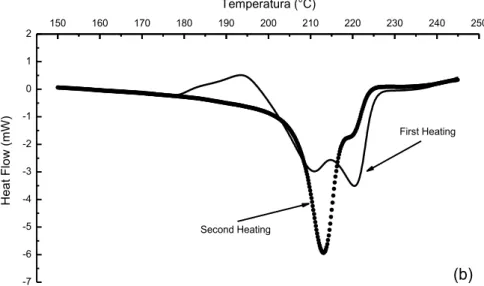
Figure 3 compares the DSC thermograms for the PA6/GF/MMT composites processed with different mold temperatures and with the same composition utilized in the mechanical studies (PA 6 containing GF 17.5 wt% and MMT 5 wt %. The thermograms are presented in detail in the region corresponding to the fu-sion of the crystalline structure of the polymeric matrix and correspond to the first and second thermal scans.
The thermograms show the influence of the injection mold temperatures on the structural characteris-tics of the polymeric matrix with significant differences between the first and second thermal scans. There are significant differences between the first scans, with processing history and the effects of the processing injections, and the second scans, without processing history.
The DSC thermograms obtained with the first and second heating showed a significant difference be-tween the melt temperatures values for the composite. The melt transitions for the composite starts at 190 oC for the first heating and at 200 oC for the second heating. This difference is expected and is associated with the higher orientation induced by the injection molding processing for the polymeric matrix (PA 6). The ad-ditional orientation of the composite is eliminated after its first heating and the orientation observed in the second heating in the DSC thermogram is associated with the cristallization of the PA 6 matrix without the processing effect. These differences were observed in Figure 3(a) and Figure 3(b).
The thermograms show significant differences in the energy associated with the fusion of the crystal-line structure generated during the processing of the PA6/GF/MMT nanocomposites, as a function of the mold temperatures used. For the composites processed with the lower mold temperatures, the enthalpy ener-gy is ∆H13 °C = -570.70 mJ. For the composites processed with the higher mold temperatures, the enthalpy energy is ∆H72 °C = -378.58 mJ. Therefore, the nanocomposites processed with lower mold temperatures present higher degrees of crystallinity for the polymeric matrices. The increase of the mold temperature from 13.0 oC to 72.0 oC promotes the decrease of the crystallinity degree in 65.2 % for the composite. This modifi-cation is significant and may be responsable by the modifimodifi-cation of the mechanical performance of the com-posite.
-6 -5 -4 -3 -2 -1 0 1
2 150 160 170 180 190 200 210 220 230 240 250
Temperature (oC)
Second Heating
H
e
a
t
Flow
(
mW)
First Heating
-7 -6 -5 -4 -3 -2 -1 0 1
2 150 160 170 180 190 200 210 220 230 240 250
Temperatura (°C)
H
e
a
t
F
lo
w
(mW
)
(b)
Second HeatingFirst Heating
Figure 3: DSC thermograms for the samples processed with mold temperatures. (a) 13.0 °C and (b) 72.0 °C. Composi-tion for PA 6: GF 17.5 wt%, MMT 5 wt %.
The higher degrees of crystallinity for the samples processed with lower mold temperatures likely oc-cur because of the high cooling rates. Due to the low temperatures in the mold cavities and in the injection channels, the polymeric matrix rapidly solidifies and its viscosity increases. The material flows with higher shear rates until the final shaping of the nanocomposite sample. Under these conditions, the fiberglass and polymeric molecules of the composite matrix orient to the flow direction, and the degree of crystallinity in-creases.
Higher shear rates favor the increased exfoliation rates of the nanoparticles of clay in the composites. Figure 4 shows the XRD diffractograms for the samples processed with low and high mold temperatures. The peak in the low angle (2θ = 5°) is not displaced and is less intense in the processing conditions with a mold temperature of 13.0 ºC, indicating a higher degree of exfoliation. Studies indicate that the nanoclays with higher exfoliation rates favor nucleation mechanisms that are manifested as nucleation agent, with the for-mation of large amounts of small crystallites. Lu et al. observed that the addition of MMT accelerates the crystallization, but has little effect on the initial temperature of crystallization. Therefore, concluded that the nanoclay acts as a nucleation agent to accelerate the crystallization process during the cooling of the material and that including this material influences the nucleation and growth mechanisms of the polyamide crystals [23].
0 2 4 6 8 10 12 14 16 18 20 22 24 26 28 30 32 34 36 38 40
0,0 0,2 0,4 0,6 0,8 1,0
Mold Temperature 72.0 oC
Norm
a
li
z
e
d
In
te
ns
ity
(2
Th
e
ta
=
2
1
.4
o )
2Theta Degree
Mold Temperature = 13,0 °C Mold Temperature = 72,0 °C
Mold Temperature 13.0 o
C
The thermogram of the first thermal scan of the sample processed at 13.0 ºC shows the presence of two endothermic peaks with fusion temperatures of 211.0 ºC and 221.0 ºC. The thermogram of the second thermal scan shows the presence of endothermic peaks with fusion temperatures of 213.0 ºC and 220.0 ºC. This difference is significant and reflects the effect of the processing over the crystalline structure of the nanocomposite. For the composite processed at a mold temperature of 72.0 ºC, the thermograms present three endothermic peaks, with fusion temperatures of 178.0 ºC, 211.0 ºC and 220.0 ºC. Only two endothermic peaks are present in the second scan, with fusion temperatures of 213.0 ºC and 220.0 ºC.
The characteristics observed are strong indications that different cooling rates, resulting from different injection mold temperatures, change the orientation of the PA6 molecules, MMT particles and glass fibers, inducing significant deformation in the nanoclay particles that propitiate the appearance of organized struc-tures that are sensitive to the processing conditions.
Analysis of the diffractogram in Figure 4 shows that, for the composite processed at a mold tempera-ture of 72.0 ºC, the low angle peak represents a misplacement that can be considered the result of the interca-lation of PA6 chains in the lamellae of the nanoclay.
The intercalation process is favored by the increase in the solidification time of the composite inside the mold. With higher temperatures in the mold cavities and in the injection channels, the molten mass of the composite solidifies more slowly. While the composite remains in a molten state inside the mold under injec-tion pressure, the process of intercalainjec-tion of the polyamide molecules in the clay nanoparticles is enhanced.
The processing of the composite by injection with a low mold temperature provides higher cooling rates and higher shear rates because of increased viscosity during the conformation process. This increase in the shear rate causes an increase in the degree of exfoliation of the clay nanoparticles that act as nucleation agents. These agents form a significant amount of crystallites within a limited distance because of the low mobility of the molecules.
Despite the fact that nanocomposites processed at lower mold temperatures have higher degrees of crystallinity, the maximum tensile stress and maximum flexural stress values are lower than for nanocompo-sites processed at higher mold temperatures. This effect is attributed to the induction of failures in the con-tours of the crystallites. Because there are many small crystallites, the interface region is very large and in-duces bulk defects in the nanocomposite matrix, resulting in the loss of mechanical properties.
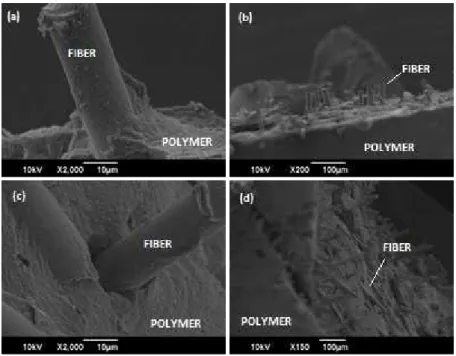
Figure 5 presents SEM images of composites processed with different mold temperatures. For samples processed at lower mold temperatures, Figures 14(a) and 14(b), show more defects in the nanocomposite matrix. Increased defects reduce the mechanical properties, despite adequate interfacial adhesion. For the samples processed at higher mold temperatures, Figures 14(c) and 14(d) show poor interfacial adhesion be-tween the fibers and the matrix, and a lower number of defects in the matrix. Although the degree of crystal-linity is smaller, the crystallites extend farther and the number of interfaces is smaller. As a consequence, the mechanical properties are improved.
Figure 5: SEM images for the composites processed with different mold temperatures. (a) and (b) 13.0 ºC, (c) and (d) 72.0 ºC.
3.2 Evaluation of the fiber percentage effect
Table 2 shows that the fiber percentage is statistically significant and has a positive effect on the maximum tensile stress. Figure 6 shows that the maximum tensile stress values for the samples containing 5 wt% and 30 wt% of fiber, set the lower and upper limits for this factor. The other processing variables were set as con-stants and the mold temperature used in this evaluation was 42.5 ºC, corresponding to the central planning point. The results are compared to the maximum tensile stresses of PA6 + 5 wt% MMT, PA6 + 25 wt% FG and pure PA6.
Fibe r (5 %) Fibe r (3 0 % ) PA 6 PA 6 + 5 %
MM T PA
6 + 25 %
GF
0 10 20 30 40 50 60 70
67.22 MPa
66.04 MPa
56.,58 MPa
71.48 MPa Maximum Tensile Strees (MPa)
C o mp o si ti o n s 63.76 MPa
Figure 6: Values of maximum tensile stress for the samples processed with different fiber percentages compared with standard values obtained in scientific literatures [22]. Composition of PA 6: GF 17.5 wt%, MMT 5 wt %.
Increasing the fiber percentage from 5 wt% to 30 wt% increased the maximum tensile stress by ap-proximately 12.1%. Comparing the standard samples to the samples processed with the lower fiber percent-ages, the maximum tensile stress values (63.76 MPa) are lower than those of the samples processed with 5 wt% of MMT and 25 wt% of FG, and higher than those of the samples processed with pure PA6. The sample processed with the higher fiber percentage produced a medium value of 71.48 MPa for the maximum tensile stress.
Table 3 shows that the fiber percentage is statistically significant and has a positive effect on the max-imum flexural stress. Figure 7 presents the maxmax-imum flexural stress values for the samples processed with 5 wt% and 30 wt% fiberglass content. The other variables were set as constants, as for the analysis of the max-imum tensile stress.
Fibe r (5 %) Fibe r (3 0 % ) PA 6 PA 6 +
5 %
MM
T PA
6 +
25 %
GF
0 10 20 30 40 50 60 70 80 90 100
86.53 MPa
78.45 MPa
55.39 MPa
99.54 MPa Maximum Flexural Strees (MPa)
C o mp o si ti o n s 86.02 MPa
.
Increasing the fiber percentage from 5 wt% to 30 wt% increases the maximum flexural stress by ap-proximately 15.7%. Comparing the standard samples to the samples with the lower fiber percentage, the me-dium value of the maximum flexural stress (86.02 MPa) is approximately equal to the meme-dium value for the sample processed with 25 wt% glass fiber content, and higher than the other standard samples. For the sam-ple processed with the higher percentage of fiberglass, the medium value of the maximum flexural stress (99.54 MPa) is the highest of all the compositions evaluated.
The increases in the maximum tensile stress and the maximum flexural stress resulting from the in-creases in the fiber percentages are related to the increased interactions between the reinforcing filler and the polymeric matrix. In this case, the fiberglass is acting as a reinforcing filler because it is increasing the max-imum tensile and flexural stresses.
Increasing the fiber percentage in the composite increases the maximum tensile and flexural stresses because the increased amount of fiber dispersed in the polymeric matrix increases the amount of work that can be transferred by the matrix to the fibers. Figure 8 shows the SEM images of the composite samples with different fiber percentages.
Figure 8: SEM images for the samples processed with different fiber percentages. (a) and (b) 10 wt%, (c) and (d) 25 wt%.
The images show that there is adequate interaction between the fiberglass and polymeric matrix of the nanocomposite. This interaction supports the action of the fiber as a reinforcement filler, which promotes the increase in maximum tensile and flexural stresses. The fibers align with the direction of the injection flow; an effect that is associated with the high shear rate induced by the injection process.
4. CONCLUSIONS
From this study on the effects of specific injection molding parameters on the mechanical and thermal prop-erties of the PA6/GF/MMT nanocomposites, we can conclude that these parameters have significant effects on the properties of the composites.
The studies show that increasing the mold temperature and the fiber percentage improves the maxi-mum tensile and flexural stresses. Increasing the mold temperature slows the cooling rate and, over time, decreases the degree of crystallinity. However, the higher temperature increases the intercalation of the pol-ymeric chains and the nanoclay lamellae that form a structure with fewer defects.
5. BIBLIOGRAPHY
[1] ALEXANDRE, M., DUBOIS, P., “Polymer-layered silicate nanocomposites: preparation, properties and uses of a new class of materials”,Materials Science and Engineering, v. 28, pp. 1-63, 2000.
[2] CLIFFORD, M. J., WAN, T., “Fibre reinforced nanocomposites: Mechanical properties of PA6/clay and glass fibre/PA6/clay nanocomposites”,Polymer, v. 51, pp. 535-539, 2010.
[3] DIAS, M., et al., “Highly filled clay polypropylene nanocomposites prepared by in situ polymerization with clay-supported magnesium/titanium catalysts”,Applied Catalysis A: General, v. 403, pp. 48-57, 2011. [4] HWANG, S., et al., “Effect of organoclay and preparation methods on the mechanical/thermal properties of microcellular injection molded polyamide 6-clay nanocomposites”,International Communications in Heat
and Mass Transfer, v. 38, pp. 1219–1225, 2011.
[5] ISITMAN, N. A., GUNDUZ, H. O., KAYNAK, C., “Nanoclay synergy in flame retarded/glass fibre rein-forced polyamide 6”,Polymer Degradation and Stability, v. 94, pp. 2241–2250, 2009.
[6] MALUCELLI, G., BONGIOVANNI, R., SANGERMANO, M., et al., “Preparation and characterization of UV-cured epoxy nanocomposites based on o-montmorillonite modified with maleinized liquid polybutadi-enes”,Polymer, v. 48, pp. 7000-7007 2007.
[7] NASCIMENTO, G.C., CECHINEL, D.M., PILETTI, R., et al., “Effect of Different Concentrations and Sizes of Particles of Rice Husk Ash - RHS in the Mechanical Properties of Polypropylene”, Materials
Sci-ence Forum, v. 660, pp. 23-28, 2010.
[8] RODRÍGUEZ, A.Y., LLORET, P.A., Rodríguez-Navarro, A. B. et al., “Thermo-XRD and differential scanning calorimetry to trace epitaxial crystallization in PA6/montmorillonite nanocomposites”, Materials
Letters, v. 63, pp. 1159-1161, 2009.
[9] DAUD, W., BERSEE, H. E.N., PICKEN, S. J., et al., “Layered silicates nanocomposite matrix for i m-proved fiber reinforced composites properties”, Composites Science and Technology, v. 69, pp. 2285-2292, 2009.
[10] MOUHMID, B., IMAD, A., BENSEDDIQ, N., et al., “A study of the mechanical behaviour of a glass fibre reinforced polyamide 6,6: Experimental investigation”,Polymer Testing, v. 25, pp. 544-552, 2006. [11] SHEN, S.Z., BATEMAN, S., MCMAHON, P., et al., “The effects of Clay on fire performance and thermal mechanical properties of woven glass fibre reinforced polyamide 6 nanocomposites”,Composites
Science and Technology, v. 70, pp. 2063-2067, 2010.
[12] LERTWIMOLNUN, W., VERGNES, B., “Influence of compatibilizer and processing conditions on the dispersion of nanoclay in a polypropylene matrix”, Polymer, v. 46, n. 10, pp. 3462–3471, Apr. 2005
[13] BABAEI, I., MADANIPOUR, M., FARSI, F., et al., “Physical and mechanical properties of foamed HDPE/wheat straw flour/nanoclay hybrid composite”, Composites Part B: Engineering. v. 56, pp. 163–170, Jan. 2014.
[14] CAMPBELL, K., CRAIG, D.Q.M., MCNALLY, T., “Poly(ethylene glycol) layered silicate nanocompo-sites for retarded drug release prepared by hot-melt extrusion”,International Journal of Pharmaceutics, v. 363, pp. 126–131, Nov. 2008.
[15] LEACH, D.C., MOORE, D.R., “Failure and fracture of short glass fibre-reinforced nylon composites”,
Composites, v. 16, pp. 113, 1985.
[16] AKAY, M., O'REGAN, D.F., “Fracture Behaviour of Glass Fibre Polyamide Mouldings”, Polymer Test-ing, v. 14, pp. 149, 1995.
[17] CLIFFORD, M.J., WAN, T., “Fibre reinforced nanocomposites: Mechanical properties of PA6/clay and glass fibre/PA6/clay nanocomposites”,Polymer, v. 51, pp. 535, 2010.
[18] DUARTE, G. W., FIORI, J. JR., PETERSON, M., ET al., “Effect of Mass Flow and Mold Temperature in the Mechanical Properties of Polypropylene-rice Rusk Ash”, Advances in Materials Science and
Applica-tions, v. 2, pp. 101-109, 2013.
[19] COMIM, L. M., GAZOLLA, P.S., SANTIAGO, T.V.S, et al., “Effect of the Extrusion Process on the Bactericidal Performance of Biocidal Polypropylene Catheters”,Polymer-Plastics Technology and Engineer-ing, v. 51, pp. 283-289, 2012.
[20] DUARTE, G. W., TACHINSKI, C.G., NASPOLINI, A.M, et al., “Study of the Processing Conditions Used to Incorporate an Antimicrobial Additive in Thermoplastic Polymer”,Materials Science Forum
[21] FIORI, M. A., et al., “Extrusion Effects with Bactericidal Additives in Polymer Wood Composites”,
International Polymer Processing, v. 24, pp. 414-420, 2009.

![Figure 1: Values of maximum tensile stress for different mold temperatures compared with standard values obtained in the scientific literature [22]](https://thumb-eu.123doks.com/thumbv2/123dok_br/18875079.421149/5.892.172.719.117.430/figure-different-temperatures-compared-standard-obtained-scientific-literature.webp)

![Figure 6: Values of maximum tensile stress for the samples processed with different fiber percentages compared with standard values obtained in scientific literatures [22]](https://thumb-eu.123doks.com/thumbv2/123dok_br/18875079.421149/9.892.172.729.247.536/processed-different-percentages-compared-standard-obtained-scientific-literatures.webp)