shear capacity of interconnected concrete
block walls
Análise experimental e numérica da resistência ao
cisalhamento de paredes de blocos de concreto
interconectadas
Luciane Marcela Filizola de Oliveira
Márcio Roberto Silva Corrêa
Abstract
redicting the behavior of interconnected masonry walls is a challenging issue, given the influence of a wide range of factors, such as the mechanical properties of the materials (blocks and mortar) and the way the walls are connected to each other. In this paper, experimental results in H-shaped walls subjected to shear at the vertical interface are introduced with a numerical representation. Concrete blocks and two types of connections (running bond and U-steel anchors) were considered in the tests. Computational modelling was carried out using the Diana® FEM software to complete the study and
understand the structural behavior of the masonry panels. The influence of the bonding pattern on the experimental and numerical response was studied and good agreement between the results was found. Moreover, the numerical analysis showed that the computer models of the interconnected walls adequately represented the behavior of the physical models regarding load capacity and cracking patterns.
Keywords: Structural masonry. Concrete block. Shear tests. Experimental analysis.
Numerical modelling.
Resumo
Prever o comportamento de paredes de alvenaria interligadas é um problema difícil, dada a influência de diversos fatores, tais como as propriedades mecânicas dos materiais (blocos e argamassa) e a forma como as paredes são ligadas uma à outra. Neste artigo os resultados experimentais de paredes em formato H submetidas ao cisalhamento na interface vertical são introduzidos com uma interpretação numérica. Blocos de concreto e dois tipos de amarrações (direta e indireta com grampos) foram considerados nos ensaios. A modelagem
computacional foi realizada usando-se o software Diana® para completar o
estudo e compreender o comportamento estrutural dos painéis de alvenaria. A influência do padrão de amarração sobre a resposta numérica foi investigada e verificou-se boa concordância com os resultados experimentais. Além disso, a análise numérica mostrou que os modelos computacionais das paredes interconectadas representaram adequadamente o comportamento dos modelos físicos em relação à capacidade de carga e padrões de fissuração.
Palavras-chave: Alvenaria estrutural. Bloco de concreto. Ensaios de cisalhamento. Análise experimental. Modelagem numérica.
P
Luciane Marcela Filizola de Oliveira
University of São Paulo São Carlos – SP – Brazil
Márcio Roberto Silva Corrêa
University of São Paulo São Carlos – SP - Brazil
Introduction
A common problem faced when designing buildings in masonry is determining the shear stress in the vertical interfaces of the walls. When masonry blockwork walls are connected and subjected to differential effects of vertical loading, earthquakes or wind action, shear stresses arise along the interface between the walls (CORRÊA; RAMALHO, 2004; DRYSDALE; EL-DAKHAKHNI; KOLODZIEJSKI, 2008). The interface shear capacity only happens if the efficiency of wall connections is ensured.
The shear strength of the vertical interfaces should be ensured because the shear stress transference at this region ensures the uniformization of interconnected blockwork wall vertical normal stresses, which is very beneficial to the masonry building design.
The type of connection may influence the way that transference occurs and also the shear capacity. However, the lack of/or limited knowledge available about shear capacity and wall connections behavior can lead to very conservative predictions or unsafe designs.
The predictions for wall connections may differ depending on the design code. American standards
(AMERICAN…, 2002) state that the wall intersections or the connection of intersecting walls must be accomplished by running bond, metal connectors (with U or Z shape) or bond beams. According to European (EUROPEAN…,
2005) and Canadian standards (CANADIAN…, 2004), the vertical shear stress should be resisted by bonded masonry where the vertical shear stress induced by bending is resisted by masonry units bridging the interface between the two elements of the section or by connectors or reinforcement crossing the interface. The Brazilian code (ABNT, 2010) only mentions the use of the running bond. In other conditions, the connection efficiency should be proved experimentally. Australian
standards (AUSTRALIAN…, 2002) establish that where monolithic structural action is required across a vertical joint between two masonry members or between two components of a member, the interface shall be intersected by masonry header units that provide engagement or connectors which tie the two members or components together across the interface. Most of the codes show a consensus about the bonded masonry efficiency, whereas code design rules vary considerably with regards to connectors of flanged walls and to shear strength capacity at the
is required and provisions must be introduced in the codes to allow for the effects of bonding patterns on the shear resistance of masonry. Experimental studies in this area were developed by Lissel, Shrive and Page (2000), Capuzzo Neto, Corrêa and Ramalho (2008), Drysdale, El-Dakhakhni and Kolodziejski (2008), and Bosiljkov
et al. (2010). According to the authors, the
web-flange bonding pattern affects the interface shear strength of interconnected masonry walls and the type of connection influences their behavior. Numerical analysis using the finite element method (FEM) has been widely used to describe the structural behavior. The FEM is accurate analytical, since it represents the actual collapse mechanism and facilitates the study of complex structures with some degree of nonlinearity, such as masonry elements. There is a limited number of available research focusing on the numerical analysis of the flanged walls, some studies were found in the literature review such as Berto et al.
(2004) and Haach, Ramalho and Corrêa (2013). It is practically impossible to carry out experiments on all types of wall connections with different materials; therefore, numerical modelling techniques are required to understand it properly. Finally, this paper aims to evaluate the behavior and the shear strength of vertical interfaces of interconnected walls by means of experimental analysis with a parallel numerical interpretation.
Experimental investigation
Materials
The specimens were built with hollow concrete blocks with 45% of holes and external dimensions of 140 x 390 x 190 mm (width x length x height). The properties of the materials were established for hollow concrete blocks, masonry-like composite material (prisms and wallets), mortar, grout and steel bars. More details about the experimental procedures can be found in Oliveira (2014). Table 1 contains the main results obtained.
Specimens
The specimens were built with a gap between the floor and web, simply supporting the flanges, to create conditions where almost the pure shear condition could be achieved at the flange-web intersection. The flanges were constructed on a mortar layer placed at the top of reinforced concrete slabs.
The first series was constructed with running bond walls and the second series was constructed using
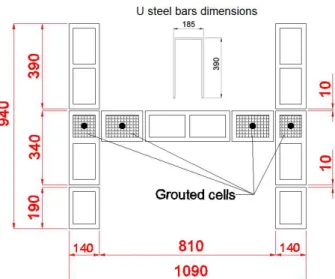
two U-steel anchors of 10 mm diameter per flange, placing one every two courses, embedded at grouted cells and extended across the shear plane. There was a continuous head joint in the interface of walls. Figure 1 and Figure 2 summarize the types of bonding which were investigated and all the features of the tested specimens.
Table 1 - Summary of the material tests
Specimen Number
of tests Test Average
C.O.V. (%)
Block
6 Compression 10.21 MPa 4.78 6 Young’s Modulus 9.92 GPa 7.69 12 Splitting tensile GA = 0.57 MPa NA = 0.96 MPa 17.91 18.40
Bed Joint
8 Bond Wrench 0.16 MPa 28.07
9 Shear
c = 0.23 MPa tan 0 = 0.50
kt = 21.97 MPa/mm
- - 23.92 Head Joint 9 Shear c = 0.17 MPa tan
0 = 0.57 -
Prisms 12 12 Compression Young’s Modulus 5.16 MPa 8.17 GPa 13.75 8.11
Wallets 6 6 Compression Young’s Modulus 4.88 MPa 8.50 GPa 10.23 7.90
Mortar 6 6 Compression Young’s Modulus 3.52 MPa 6.80 GPa 21.97 6.69
Grout
6 Compression 39.52 MPa 0.64 6 Young’s Modulus 35.81 GPa 6.62 6 Diametrical tensile 3.45 MPa 8.54 Steel 3 3 Yield Stress Young’s Modulus 572.43 MPa 197.99 GPa 2.47 4.32
Note:
GA – Gross area; and NA – Net area.
Figure 2 - Geometric specification of the specimens – U-steel anchor connection
Loading and test setup
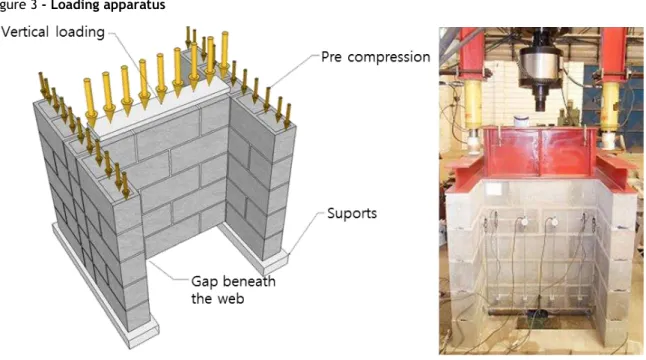
Firstly, a pre-compressive stress of 0.6 MPa was applied to lateral flanges to stabilize the specimen and prevent bending. This value was obtained from previous numerical simulations (OLIVEIRA, 2014). According to Bosiljkov et al.(2010), the
level of pre-compression on the flanges up to approximately 0.5 MPa influences the shear strength, for higher values, the results stabilize. Afterwards, a shear load was applied monotonically to the top web of the sections under displacement control to produce shear in the flange-web interface. The load was applied by a hydraulic actuator at a rate of 0.001 mm/s. Figure 3 illustrates the loading apparatus.
The relative vertical displacements between web and flanges (due to shear deformations along the flange-web interface) were measured using LVDTs, as shown in Figure 4. In the second series, one strain gage was glued on each U-steel anchor to measure the steel strains (see Figure 5).
Numerical modelling
A numerical modelling was performed afterwards the experimental tests, adopting a simplified micro-modelling approach, that comprehended all major failure criteria that represent the brickwork behavior. The experimental results were used to calibrate and verify the model. In the micro-modelling approach, the mortar thickness and the block–mortar interfaces are lumped into a
zero-thickness interface while the dimensions of the units are expanded to keep the geometry of the masonry structure unchanged. Some researchers have adopted micro-modelling approaches to study the masonry, since it represents very well its complex behavior (LOTFI; SHING, 1994; LOURENÇO; ROTS, 1994).
Tridimensional finite element
model
The connected walls tested in experimental program were simulated by a three-dimensional finite element model. The Diana® (2015) software
was used to concept the model geometry and to solve the system of equations of the finite element model, adopting a Quasi-Newton iteration method (Secant) and a displacement convergence norm.
Loading and boundary conditions
The boundary conditions adopted for the numerical model were the restrictions of the displacements in the z direction at the base of the flanges and the symmetry conditions at the center of the web (restrictions of the displacements in the x axis). The boundary conditions were similar in the experimental tests.
Figure 3 - Loading apparatus
Figure 4 - Instrumentation of the specimens
Finite element mesh
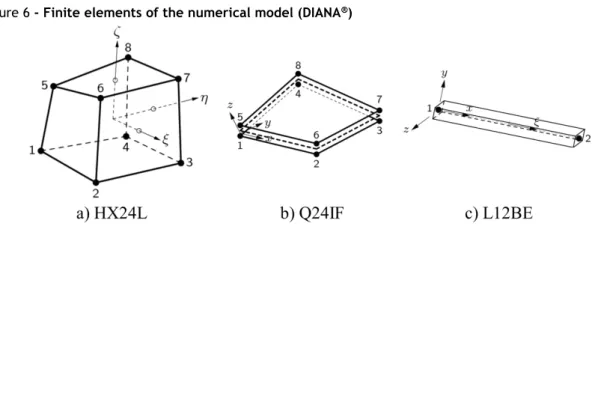
The finite element mesh was constructed using solid continuum elements to represent the units, and interface and beam elements to represent respectively the joints and the U-steel anchors. Units and grout were represented by an eight-node isoparametric solid brick element based on linear interpolation and Gauss integration (HX24L –
DIANA®), see Figure 6a. An interface element
between two planes in a three-dimensional configuration (HX24L – DIANA®) was adopted
for bed and head joints (Figure 6b). A three-dimensional beam element with two-nodes represented the U-steel anchors (L12BE –
DIANA®) (see Figure 6c).
A schematic representation of the geometric, symmetrical boundary and loading conditions used in the analysis are illustrated in Figure 7.
Both numerical models (series 1 and series 2) differ in some aspects. In the first series, there are units, vertical and horizontal joints, whereas in the second series, there are two additional components: grout and U-steel anchor, placed at the interface region in the cells.
Constitutive models and material
properties
The constitutive model used for masonry units and grout obeys the brittle or quasi-brittle materials law. Total Strain crack model, available in DIANA software, was used to characterize the crack distribution and the nonlinear behavior of both
units and grout (DIANA, 2015). DIANA’s total
strain based constitutive model defines the tensile and compressive behavior of a material by a stress-strain relationship. The tensile and compression behavior of the units and the concrete was assumed to be exponential and parabolic model, respectively, see Figure 8.
To describe how the shear behavior changes when the material is cracked, a constant shear retention was used, applied to the Total Strain Fixed crack model.
The H-shape specimens studied here feature a three-dimensional configuration; hence joints in masonry were represented by a three-dimensional interface model. The interface elements obey the nonlinear behavior described by the combined cracking-shearing model, see Figure 9. Diana®
software provides a three-dimensional interface model which enables the description of delamination (tension cut-off) and relative shear-slipping of two planes (Coulomb friction) (VAN ZIJL, 2000). U-steel anchors were modelled assuming a perfect bond and an elastic-hardening-plastic material model.
To apply the micro-modelling approach, many material parameters are needed. It makes the numerical modelling extremely complex, as it is very difficult to obtain all of them experimentally. For the sake of simplicity, the units were represented by solid elements. Taking this into account, the cross area parameters were applied in blocks, considering the net area, except for those with grouted cells, see Table 2.
Figure 7 - (a) Symmetry representation; (b) Pre-compression stress; (c) displacement imposed; and (d) Boundary and symmetrical conditions
Figure 8 - Constitutive model for masonry units and grout (DIANA®)
Figure 9 - Constitutive model for masonry interfaces: three-dimensional interface yield function (DIANA®)
Table 2 - Material parameters for units and grout elements
Parameter Symbol Units
(gross area) Units (net area) Grout
Elastic modulus E 8.17 GPa 14.86 GPa 35.81 GPa
Poisson 0.20 0.20 0.20
Tensile strength ft 0.57 MPa 0.96 MPa 3.45 MPa
Fracture energy for Mode I GfI 0.12 MPa·mm 0.50 MPa·mm 1.00 MPa·mm
Compressive strength fc 5.16 MPa 9.38 MPa 39.52 MPa
Certain mechanical properties of units, mortar, concrete and steel bars adopted in the numerical model were determined during the characterization tests. Due to the impossibility of experimentally obtaining all the interface parameters, some of them were based on previous work, where concrete blocks with similar raw material compositions and the set of material parameters for the same type of mortar were experimentally evaluated or defined by fitting the numerical to experimental results. Table 3 summarizes the material properties adopted for the interface elements.
Results and discussion
In the first series, the failure occurred in a brittle mode due to the accumulated stress on interlocking blocks, leading to a shear failure at the flange-web interface. Figure 10 shows the experimental and numerical results of the Series 1 (Load versus
vertical displacement).
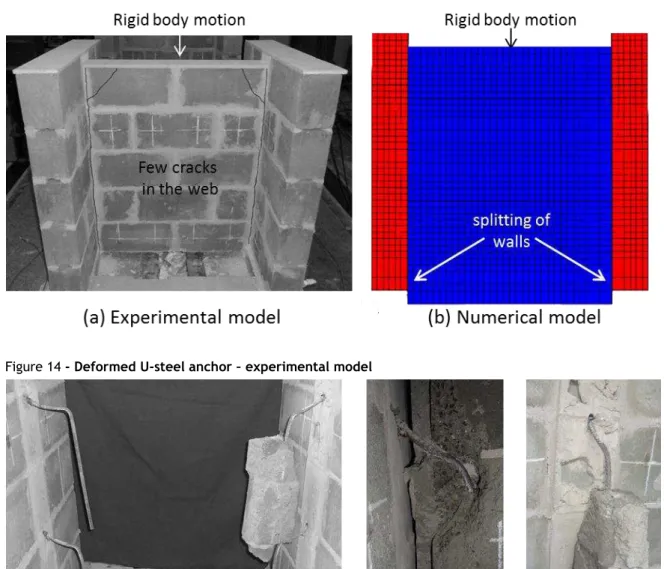
It can be seen that the numerical model adequately predicts the shear response for running bond specimens. The initial path of the load-displacement graph appeared to be linear, up to 75% of the ultimate load in almost all specimens and the cracks on the web started at approximately 50% of the ultimate load. The discrepancies in the experimental curves after the end of the linear path can be partly attributed to the non-simultaneously failure of the opposite interfaces of the specimens. The web showed many cracks before failure and the load capacity increased after initial cracking. The numerical model was suitable to reproduce the
splitting of walls at the interface. Figure 11 presents the failure patterns of the experimental and numerical models.
All the H-shape walls of the second series failed under shearing. The curve load versus
displacement for each U-steel anchored specimen is given in Figure 12.
The specimens of this series presented a ductile behavior with an extensive plastic deformation before failure, as expected. The initial path of the load-displacement graph appeared to be linear, up to 50% of the ultimate load and after that, there was a significant increase of shear force along a nonlinear path. As can be seen in Figure 11, the linear and post-peak behaviors were well predicted by the numerical model.
In a previous analysis, the numerical model of the second series showed a local failure under the U-steel anchors, leading to the crushing of units and grout. Probably, in the physical model there was a confinement condition in the region where the numerical model was not able to represent it. It is well known that the confined concrete achieves a significant increase in strength and ductility (PAULTRE; LÉGERON, 2008). Taking this into account, the confinement of the grout in the aforementioned area may have improved the absorption and dissipation of energy. Thus, in the numerical model, the elements immediately below the U-steel anchors had their fracture energy under tension and compression increased tenfold.
Table 3 - Material parameters for Interface Elements
Parameter Symbol Bad joint Head joint
Normal stiffness kn 5.00 MPa/mm 5.00 MPa/mm
Tangential stiffness kt 21.97 MPa/mm 5.00 MPa/mm
Cohesion c 0.23 MPa 0.17 MPa
Friction coefficient tan0 0.50 0.57
Dilatancy coefficient tan 0.82 0.00 Residual friction coefficient tanr 0.40 0.00
Confining normal stress u -1.37 MPa 0.00
Exponential degradation coefficient 4.33 0.00 Tensile strength ft 0.16 MPa 0.20 MPa
Fracture energy for Mode I GfI 0.05 MPa·mm 0.05 MPa·mm
Fracture energy for Mode II GfII 0.22 MPa.mm 0.22 MPa.mm
Cap critical compressive strength fc 5.16 MPa 5.16 MPa
Shear traction control factor Cs 4.00 4.00
Compressive fracture energy Gfc 11.64 MPa.mm 11.64 MPa.mm
Figure 10 - Load versus displacement curve of running bond specimens
Figure 11 - Failure mode of Series 1
Figure 12 - Load versus displacement curve of U-steel anchored specimen
0.0 0.5 1.0 1.5 2.0 2.5 3.0 3.5 4.0 4.5 5.0
0 20 40 60 80 100 120 140 160 180 200 220 240 260
Experimental FEM Model
Load (k
N
)
The tests showed very short strain of the web and almost no cracking before failure. The vertical head joint at the flange-web intersection failed, while the flanges and the web showed almost no cracks, resulting in a rigid body movement of the web. Figure 13 presents the failure mode of the second series obtained by experimental and numerical models. The results showed that the numerical model characterizes the performance of the connection reasonably.
The dowel effect of the U-steel anchor combined with the shear friction at interface resulted on the resisting mechanism of connection. Even later on a large slip of web, the load continued increasing up to failure.
Large deformations of the U-steel anchors were observed, see Figure 14. The strains of some anchors could not be measured during the entire test, due to the crushing of the interface that caused a loss in the strain gauge accuracy. However, most of the connectors were close to reaching the steel yielding stress.
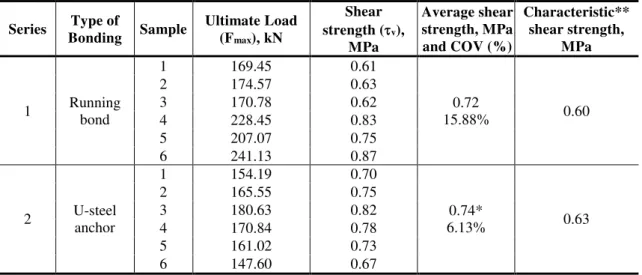
The ultimate load, the average and characteristic shear strength of the specimens obtained from the tests are shown in Table 4. The shear strength was calculated by Equation 1.
��=������ℎ Eq. 1
Where Fmax is the ultimate load and Ash is the
cross-sectional area of the vertical interface (useful height of specimen web thickness).
Figure 13 - Failure mode of Series 2
Table 4 - Test Results of H-shaped specimens
Series Type of
Bonding Sample
Ultimate Load (Fmax), kN
Shear strength (v),
MPa
Average shear strength, MPa and COV (%)
Characteristic** shear strength,
MPa
1 Running bond
1 169.45 0.61
0.72
15.88% 0.60
2 174.57 0.63
3 170.78 0.62
4 228.45 0.83
5 207.07 0.75
6 241.13 0.87
2 U-steel anchor
1 154.19 0.70
0.74*
6.13% 0.63
2 165.55 0.75
3 180.63 0.82
4 170.84 0.78
5 161.02 0.73
6 147.60 0.67
Note:
*referred to the vertical area corresponding to four courses; and **5% lower bound assuming normal distribution.
There is no a significant difference between the shear strength values of two series. This behavior is in agreement with the findings of Drysdale, El-Dakhakhni and Kolodziejski (2008). However, Bosiljkov et al. (2010) and Capuzzo Neto, Corrêa
and Ramalho (2008) report a loss of shear strength of interface when the walls are linked by steel connectors instead of running bonded. There is no specific explanation for this; it can be related to materials applied or to connection configuration. These results indicate the need for an in-depth study about the behavior of flanged walls, involving different materials and connections, in order to clarify the mechanism governing the various types of connected walls.
The comparison between the experimental and numerical values of the shear strength is shown in Table 5. The overall structural behavior was captured well by the FEM numerical analyses. These results confirm the opportunity of using an FEM approach to analyze flanged wall structures. Based on these results, a prediction of the interface capacity of U-steel anchor specimens could be developed. According to CEB-FIB 43 (FIB…,
2008), dowel action of partly embedded steel bars is a basic mechanism in the transfer of shear force. The shear strength of a steel bar loaded in pure shear can be estimated by adopting the yield criterion by von Mises, which can be obtained from Equation 2, where fy is the yield stress
(572.43 MPa). y vR f f 3 1
Eq. 2
Therefore, the total shear strength may be estimated assigning an initial portion to pre-cracking shear strength under zero compression of head joint (cohesion, c = 0.17 MPa) and a post-cracking portion to shear strength of steel (fVr = 330.5 MPa). Thus, the shear capacity of the U-steel anchor specimens can be obtained from Equation 3.
U vR vR sides c H t Uanchors f A
F 2 ( )4
Eq. 3 where AU = cross-sectional area of the U-steel
anchor (78.54 mm2), H is the specimen height
(990 mm) and t is the web thickness (140 mm).
The shear capacity estimated is FvR = 152.4 kN.
This value is 7% lesser than the value obtained experimentally (163.30 kN) and 1% larger than the value obtained numerically (150.82 kN). As there is a lack of information, this estimate appears to be a good approach to be used in designs.
Conclusions
Table 5 - Experimental and Numerical results - comparison
Series Experimental result, kN Numerical result, kN Experimental/numerical ratio
1 198.58 186.85 1.06
2 163.30 150.82 1.08
Based on the results, the following conclusions are:
(a) the type of bonding in web-flange connections has a significant influence on their behavior. Although specimens of different bonding types showed nearly the same shear strength, the running bond connection showed a brittle failure while the U-steel anchor connection showed a ductile failure. The post-cracking ductility may have a significant impact on shear wall performance; (b) the numerical model presented good
agreement with tests, denoting that it is appropriate for use in parametric analysis; and
(c) in addition, a simplified equation is proposed to provide an approximate value of the interface shear capacity by considering the mechanisms that govern the structural behavior of interconnected concrete block walls with U-steel anchors.
The results indicated the need to continue the study of flanged wall behavior, involving different materials and connections, in order to clarify the mechanism that governs the various types of connected walls and to be able to improve design models.
References
AMERICAN CONCRETE INSTITUTE.
ACI 530-02: building code requirements for
masonry structures. Farmington Hills, 2002. ASSOCIAÇÃO BRASILEIRA DE NORMAS TÉCNICAS. NBR 15961-1: structural masonry:
concrete blocks: part 1: design. Rio de Janeiro, 2010.
AUSTRALIAN STANDARD. AS 3700: masonry
structures, Australia, 2002.
BERTO, L. et al. Shear Behavior of Masonry
Panel: parametric FE analyses, International Journal of Solids and Structures, v. 41, p. 4383–
4405, 2004.
BOSILJKOV, V. et al. Shear Capacity of the
Flange-Web Intersections of Brick Masonry Nonrectangular Sections, Journal of Structural Engineering, v. 136, n. 5, p. 574-585, 2010.
CANADIAN STANDARDS ASSOCIATION.
CAPUZZO NETO, V.; CORREA, M. R. S.; RAMALHO, M. A. Proposal of a Test Specimen to Evaluate the Shear Strength of Vertical Interfaces of Running Bond Masonry Walls,
Canadian Journal of Civil Engineering, v. 35,
p. 567–573, 2008.
CORRÊA, M. R. S.; RAMALHO, M. A. A Simple Finite Element Based Model for Evaluating the Interaction of Load Bearing Walls Subjected to Vertical Loading. Construction and Building Materials, v. 18, p. 77–89, 2004.
DIANA Finite Element Analysis. TNO DIANA.
User’s manual release 9.6. Material library. Delft,
Netherland, 2015.
DRYSDALE, R. G.; EL-DAKHAKHNI, W. W.; KOLODZIEJSKI, E. A. Shear Capacity for Flange-Web Intersection of Concrete Block Shear Walls. Journal of Structural Engineering,
v. 134, n. 6, p. 947–960, 2008. EUROPEAN COMMITTEE FOR
STANDARDIZATION. EN 1996-1-1 - Eurocode 6: design of masonry structures. Belgium, 2005.
FIB BULLETIN 43. Structural Connections for Precast Concrete Buildings. International
Federation for Structural Concrete, 2008. HAACH, V. G.; RAMALHO, M. A.; CORRÊA, M. R. S. Parametrical Study of Unreinforced Flanged Masonry Walls Subjected to Horizontal Loading Through Numerical Modeling,
Engineering Structures, v. 56, p. 207–217, 2013.
LISSEL, S. L.; SHRIVE, N. G.; PAGE, A. W. Shear in Plain, Bed Joint Reinforced, and Post-Tensioned Masonry. Canadian Journal of Civil Engineering, v. 27, n. 5, p. 1021–1030, 2000.
LOTFI, H. R.; SHING, P. B. Interface Model Applied to Fracture of Masonry Structures.
Journal of Structural Engineering, v. 120,
n. 1, p. 63–80, 1994.
LOURENÇO, P. B.; ROTS, J. G. Implementation of an Interface Cap Model for the Analysis of Masonry Structures. Computational Modelling of Concrete Structures, Pineridge, v. 1, p. 123–134,
OLIVEIRA, L. M. F. Numerical and
Experimental Study of the Behavior of Vertical Interfaces of Interconnected Structural
Masonry Walls. Ph.D. Thesis, São Carlos School
of Engineering, University of São Paulo, São Carlos, 2014.
PAULTRE, P.; LÉGERON, F. Confinement Reinforcement Design for Reinforced Concrete Columns. Journal of Structural Engineering,
p. 738–749, 2008.
VAN ZIJL, G. P. A. G. Computational Modelling of Masonry Creep and Shrinkage.
PhD thesis, Delft University of Technology, 2000.
Acknowledgments
The authors gratefully acknowledge the support of CAPES and CNPq, Brazilian Postgraduate Support Agencies and also the Laboratory of Structures at the University of São Paulo for performing the tests.
Luciane Marcela Filizola de Oliveira
Post-doctorate student, São Carlos School of Engineering | University of São Paulo | Av. Trabalhador Sãocarlense, 400 | São Carlos – SP –
Brazil | Postal Code 13566-590 | Phone: +55 (16) 3373-9479 | E-mail: [email protected]
Márcio Roberto Silva Corrêa
Associate Professor, São Carlos School of Engineering | University of São Paulo | Phone: +55 (16) 3373 9458 | E-mail: [email protected]
Revista Ambiente Construído
Associação Nacional de Tecnologia do Ambiente Construído Av. Osvaldo Aranha, 99 - 3º andar, Centro