Article
J. Braz. Chem. Soc., Vol. 23, No. 10, 1915-1924, 2012. Printed in Brazil - ©2012 Sociedade Brasileira de Química 0103 - 5053 $6.00+0.00
A
*e-mail: [email protected]
Seasonal Distribution of Airborne Trace Elements and Water-Soluble Ions
in São Paulo Megacity, Brazil
Gisele O. Da Rocha,*,a Pérola C. Vasconcellos,b Simone G. Ávila,b Davi Z. Souza,b
Eduardo A. O. Reis,b Pedro V. Oliveirab and Odon Sanchez-Ccoylloc
aInstituto de Química, Universidade Federal da Bahia, Campus de Ondina,
40170-115 Salvador-BA, Brazil
bInstituto de Química and cInstituto de Astronomia, Geofísica e Ciências Atmosféricas,
Universidade de São Paulo (USP), Cidade Universitária-Butantã, 05508-900 São Paulo-SP, Brazil
Neste trabalho, as distribuições sazonais de Al, Ca, Cu, Fe, K, Mg, Na, Pb, Zn e de íons majoritários (Cl−, PO
4 3−, NO
3−, SO4
2−, HCOO−, CH
3COO−, oxalato, succinato, Na +, NH
4
+, K+, Mg2+
e Ca2+) foram estudadas na fração PM10 (material particulado menor que 10 µm) na cidade de
São Paulo (abril de 2003 a maio de 2004). Os níveis atmosféricos mais elevados foram encontrados para os íons inorgânicos SO4
2−, NO 3
−, Cl− e PO 4
3−, e dentre os íons orgânicos, oxalato e formiato.
Os níveis atmosféricos para elementos foram: Fe > Al > Ca > K > at > Mg > Zn > Cu > Pb. As fontes relevantes foram: (i) queima de combustíveis e/ou queima de biomassa (NO3−, HCOO−,
C2O42−, K+, Mg2+, Ca2+, Fe, Pb, Zn, Al, Ca, K e Mg), (ii) conversão gás-partícula (SO42− e NH4+) e
(iii) spray marinho (Cl−, Na+ e Na).
This study deals with the seasonal distribution of Al, Ca, Cu, Fe, K, Mg, Na, Pb and Zn and water soluble ions (Cl−, PO
4 3−, NO
3−, SO4
2−, HCOO−, CH
3COO−, oxalate, succinate, Na +, NH
4 +,
K+, Mg2+ and Ca2+) found in PM10 samples (particulate matter less than 10 µm in diameter)
São Paulo City, Brazil, (April 2003-May 2004). Higher atmospheric levels were found for SO4 2−,
NO3−, Cl− and PO4
3− while the main organic anions were oxalate and formate. Atmospheric levels
for elements were: Fe > Al > Ca > K > Na > Mg > Zn > Cu > Pb. Some sources were predominant for some species: (i) fuel burning and/or biomass burning (NO3−, HCOO−, C2O4
2−, K+, Mg2+, Ca2+,
Fe, Pb, Zn, Al, Ca, K and Mg), (ii) gas-to-particle conversion (SO4
2− and NH 4
+) and (iii) sea salt
spray (Cl−, Na+ and Na).
Keywords: major ion composition, water-soluble ions, trace elements, seasonal distribution of atmospheric contaminants, airborne particulate matter
Introduction
Atmospheric particulate matter (PM) plays an important role in both human health and climate of Earth. PM modifies the budget between scattering and absorption of solar radiation reaching the Earth’s surface. These particles can also act as cloud condensation nuclei (CCN) and ice
crystals regulating water cycle.1-3 Airborne particulate
matter is broadly accepted as a potent air pollutant in a typical urban location. It is generated from wide range of sources and contains numerous toxic substances. It triggers
respiratory related diseases and impacts the human health.4
There are several studies that deal with chronic and acute
adverse health effects and particulate matter4-8 even though
our understanding of the exact causes and mechanisms of these effects still remains limited.
According to the World Health Organization (WHO), 4-8% of deaths occurring annually in the world is related to
air pollution.9 Coarse inhalable particles may be deposited
in the upper respiratory tract whereas fine particles travel deeper into the lungs. Literature reports that the finest particles can reach alveolar regions but it is not obvious in which particular PM size range toxic substances are
concentrated.4 In several countries, policies of these
emissions have been and/or are being established with the aim of facing environmental pollution. For instance, the legislation of European Union regulates PM10 level
basis to be not higher than 50 µg m-3 (as well as it should not exceed more than 7 times per year) and an annual limit of 20 µg m-3.10
In the São Paulo metropolitan area (Brazil), mobile emissions are considered the main source of air pollution. In addition, meteorological conditions influence the pollutant concentrations mainly when other emission sources contribute to the air quality during the biomass
burning season.11
The aim of the present work was to study the seasonal distribution of selected trace elements (Al, Ba, Ca, Cr, Cu, Fe, K, Mg, Mn, Na, Pb and Zn) and water soluble ions (Cl−, PO
43−, NO3−, SO42−, HCOO−, CH3COO−, oxalate,
succinate, Na+, NH
4
+, K+, Mg2+ and Ca2+) found in PM10
samples collected at São Paulo City from April 2003 to May 2004. Concentration levels, species ratios, enrichment factors, statistical treatment of data (Pearson correlation and principal component analysis) and dry deposition flux results segregated by season are presented.
Experimental
Sampling, meteorological conditions and backward air mass trajectories
São Paulo site (SPA) (23°33´S and 46° 44´W) is at approximately 800 m above sea level. The collection point in SPA site is located in a green area, within approximately 2 km of a major highway carrying relatively heavy traffic consisting of a mixed contribution of gasohol-, diesel- and ethanol-fueled vehicles. A high volume PM10 sampler (Energética, Brazil) with a size-selective inlet was placed in an open area on the roof of the Department of Atmospheric Sciences building (University of São Paulo), being about 20 m above ground level. Before collection, filters were heated at 800 °C for 8 h in order to remove any organic contaminants. Samples were collected twice a month from April 2003 to May 2004 (n = 28) for 24 h by filtration of the ambient air through a quartz fiber filter (20 cm × 25 cm; Energética, Brazil). The concentration of the suspended particles was calculated weighting the filters before and after collection. Just after each collection, filters were properly kept into refrigerator below −4 oC until analysis.
Meteorological data such as temperature, relative humidity and precipitation of the period of sample collection were recorded by the climatological station from the Department of Atmospheric Sciences. The temperature varied from 12 to 28 ºC, relative humidity varied from 75 to 85%. More detailed meteorological information is
described elsewhere.11
Backward air mass trajectories by using HYSPLIT model (Hybrid Single Particle Langrangian Integrated Trajectory Model) (Air Resources Laboratory, NOAA, USA) were calculated for 96 h before the beginning of each sampling and at 500 m altitude. Four typical backward air mass trajectories arriving at São Paulo (Figure 1) site were observed: type 1, oceanic-continental (Southwestern Brazil) for 43% of trajectories (12 occurrences); type 2, oceanic-only for 25% of trajectories (7 occurrences); type 3, continental-only for 21% of trajectories (6 occurrences); and type 4, oceanic-continental (South America) for 11% of trajectories (3 occurrences). The type 1 trajectory was the most abundant of all trajectories but it is noted that there is an oceanic contribution for the majority of trajectories (by type 1, type 2 or type 4) which sum up to 79% of all trajectories. Since all trajectories were calculated 96 h before starting sample collection, they have originated in different places, bringing different contributions of air masses. For instance, type 1 trajectory which began on the Atlantic Ocean was most carried to the Southern Region of Brazil, and has probably contributed to particulate matter be aged and modified by typical urban and biomass burning releases before arriving at SPA site collection. Indeed, this trajectory has mainly contributed to mixed character (continental-oceanic) of air masses. The same condition
was observed in other literature reports.12,13 Type 3
trajectory has begun on Brazilian West-Center Region until arriving in São Paulo. This is a region well-known to possess extensive areas of biomass (forest and sugar cane) burning and also bovine pasture. Type 2 trajectory is essentially oceanic and type 4 trajectory is a mix of continental South American (urban, agricultural and bovine pasture activities) and oceanic contributions. Nonetheless, since wind has also travelled extensively by ocean (types 1, 2 and 4), urban areas (types 1, 3 and 4), biomass burning (types 1 and 3) and agricultural areas (types 1, 3 and 4), there may have probably been contributed differently for emission of some of those species considered in this study.
Sample preparation and analyses
For extraction of ion species, sample and blank filters (cuts of 47 mm diameter) were extracted using a shaker for
90 min with 20 mL deionized water (18 MΩ cm-1). After
passing through microporous membranes (Millipore Millex®
GV, PVDF 0.22 µm pore size; 33 mm diameter), the ionic concentrations of the aqueous extracts were determined by ion chromatography (Metrohm AG, Herisau, Switzerland)
with chemical suppression (50 mmol L-1 H
2SO4) and a
conductivity detector. For anion detection (SO4
2−, Cl−,
via a 20 µL loop through a Metrosep A Supp 5 250/4.0 mm
analytical column. A mixture of 1.0 mmol L-1 NaHCO
3 and
3.2 mmol L-1 Na
2CO3 was used as eluent. The suppressor
system was regenerated by solution of 50 mmol L-1 H
2SO4 solution pumped through suppressor unit simultaneously with deionized water. The determination of the organic acids was performed injecting the samples via a 20 µL loop using a Metrosep Organic Acids 250/7.8 mm analytical column. The system was run in the isocratic mode with
solution of perchloric acid (0.5 mmol L-1) as eluent and the
chemical suppressor system was regenerated by a solution
of 10.0 mmol L-1 LiCl pumped through the suppressor unit
simultaneously with deionized water. A Metrosep C2-150 150/4.0 mm analytical column was used for cation detection
(K+, NH
4+, Ca2+, Mg2+ and Na+) and the eluent used was a
solution 2.7 mmol L-1 oxalic acid. The system was run in
the isocratic mode.
Recoveries ranged from 109 to 118% for inorganic anions, from 87 to 107% for carboxylic anions and from 80 to 101% for cations. Limit of detection (LOD; s/n = 4, signal-to-noise ratio) ranged between 3-45 (inorganic
anions), 13-35 (organic anions) and 4-24 ng m−3 (cations).
Blank values were subtracted from sample determinations. Fluoride and nitrite levels were found below LOD.
For metal and metalloid determinations, sample and blank filters were digested by using a closed-vessel microwave system (Multiwave 3000, Anton Paar, Austria), equipped with 16 fluoropolymer vessels and ceramic vessel jackets. They support maximum temperature and pressure of 240 ºC and 4 MPa, respectively. The internal temperature and
pressure are monitored only in one controlling vessel using a sensor-protecting glass tube that enters directly in contact with digested solution. A circle filter piece (47 mm diameter) was transferred to the vessel and digested using oxidant
mixture (3 mL HNO3 + 2 mL H2O2 + 2 mL H2O). The
heating program was performed in three steps (temperature, ºC; ramp, min; hold, min): 1 (80; 5; 2), 2 (140; 5; 2) and 3 (190; 10; 30). There is a fourth step for cooling down the system through forced ventilation for 20 min. After digestion, samples and blank solutions were transferred to volumetric polypropylene tubes (Axygen Scientific, California, USA) and made up to 10 mL with deionized water. The solution was centrifuged for solid particle separation before analysis. A certified reference material of urban particulate matter SRM 1648a (NIST, USA) was also digested following the same procedure described for the samples.
A Spectro Ciros CCD ICP optical emission spectrometer (Spectro Analytical Instruments, Kleve, Germany) equipped with axially-viewed plasma was used. The spectrometer is equipped with a simultaneous CCD (charged-coupled device) solid state detector, polychromator and purged with argon and end-on gas interface for axially viewed configuration to minimize interference. The introduction system was composed of a double pass (Scott-type) spray chamber and a cross-flow nebulizer. The selection of spectral lines was based on spectrometer database. The setup of the ICP instrumental conditions for analysis was:
power 1250 W, outer gas flow 12 L min-1, intermediate gas
flow 1.0 L min-1, nebulizer gas flow 0.9 L min-1 and sample
uptake rate 1.5 L min-1. The following atomic (I) or ionic
(II) wavelengths were used for the elements determination: Al(I) 396.152 nm, Ba(II) 249.773 nm, Ca(II) 396.847 nm, Cr(II) 205.552 nm, Cu(I) 327.396 nm, Fe(II) 259.940 nm, K(I) 769.896 nm, Mg(I) 285.213 nm, Mn(II) 257.610 nm, Na(I) 588.995 nm, Pb(II) 283.305 nm and Zn(I) 213.856 nm. One standard reference material (SRM) of urban particulate matter SRM 1648a (NIST, USA) was used to check the entire accuracy of the analytical method. The comparisons between experimental and certified values for all elements are in good agreement, considering student’s t test at significance level of 95%.
Limits of detection (LOD) were calculated using the background equivalent concentration (BEC) and signal-to-background ratio (SBR):
BEC = Crs/SBR (1)
SBR = Irs – Iblank/Iblank (2)
LOD = 3 BEC RSD/100 (3)
where, Crs is the concentration of multi-elemental reference
solution (10 mg L-1), I
rs and Iblank are the emission intensities
for the multi-elemental reference (10 mg L-1) and blank
solutions, and RSD is the relative standard deviation for ten consecutive measurements of blank solution. The estimated
values for the limits of detection were: Al = 1.58 µg g-1,
Ba = 0.024 µg g-1, Ca = 0.027 µg g-1, Cr = 0.075 µg g-1, Cu = 0.015 µg g-1, Fe = 0.066 µg g-1, K = 0.0085 µg g-1, Mg = 0.045 µg g-1, Mn = 0.009 µg g-1, Na = 0.426 µg g-1, Pb = 0.084 µg g-1 and Zn = 0.027 µg g-1.
Statistical tests
Experimental data were analyzed by calculating the Spearman correlation coefficients using STATISTICA 6.0 (Statsoft, USA) program. Also principal component analysis (PCA) using Ward method and Euclidian distances were performed. Calculations were performed using the individual experimental values for each sample.
Results and Discussion
Trace elements and ion composition of PM10 samples
The seasonal distributed major ions and elements in PM10 samples are presented in Table 1. PM10 average
concentrations ranged from 33 to 58 µg m-3 for Summer
2003-2004 and Autumn 2003, respectively. According
to Brazilian law and recommendation from WHO,9 the
recommended PM10 concentration is 50 µg m-3. However,
PM10 levels as high as 116 µg m-3 in some Autumn and
Winter days of 2003 were observed. Table 2 shows relative contributions (%) of major ions and elements to PM10 concentrations by season, as considered in this study. Moreover, minor organic constituents (n-alkanes, pristane,
phytane and PAH)14 from the same set of samples are also
stated in the same table. Ion and element percentages presented 18.6, 21.4, 16.9, 21.6 and 14.5% of PM10 levels found in Autumn 2003, Winter 2003, Spring 2003, Summer 2003-2004 and Autumn 2004, respectively. Even though ion and element percentage contributions to PM10 were considered by season, those levels are close to found in urban regions. Unknown percentages are certainly due to EC/OC (elemental carbon/organic carbon) levels, not measured in this study.
Higher atmospheric levels were found for SO4
2−,
NO3−, Cl− and PO43− while the main organic anions were
oxalate and formate. For cations, higher levels were found
for NH4+, Ca2+ and Na+. Atmospheric levels for elements
were Fe > Al > Ca > K > Na > Mg > Zn > Cu > Pb.
Cations, HCOO−, NO
observed for those species since they presented higher levels in Autumn 2003 and Winter 2003 than in the other seasons for the most species. In general, climate in São Paulo State is normally characterized by dry Autumns and Winters and rainy Summers and Springs. With higher precipitations, Spring 2003 and Summer 2003-2004 have shown lower levels of these species due to more efficient (wet) removal mechanisms. Conversely, Autumn 2004 showed a different tendency due to higher precipitations rates (270 mm) decreasing the atmospheric pollutant levels.
For oxalate, CH3COO− and succinate, the levels found in the
Spring 2003 were higher than those from Autumn and Winter. Probably biogenic sources (metabolism of
vegetation, bacterial and/or fungi)15-17 were relevant
for them during this season. There were no significant
differences among seasons for SO42− and Cl− while for the
elements Cu and Na higher levels were observed during Summer. Species with no clear seasonal trend might possess different (biogenic and/or anthropic) sources contributions or removal efficiencies throughout seasons. Vehicular
emissions might be one important source for SO4
2−.
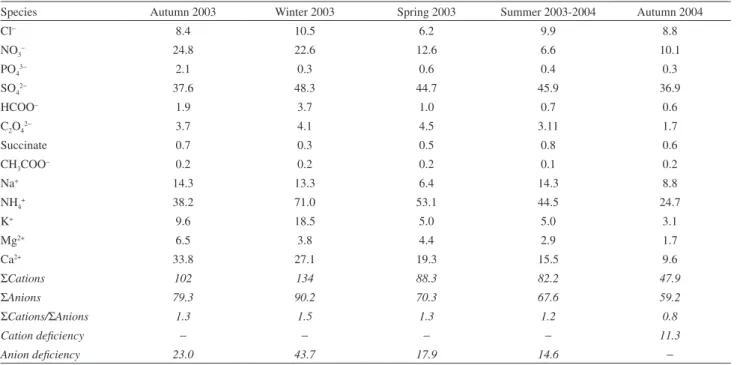
Ion balance calculations were done for all seasons
(Table 3). The Σcations/Σanions ratios were higher
than ones for all seasons except for Autumn 2004
(Σcations/Σanions = 0.8). The Σcations/Σanions ratios
smaller than 1.0 suggest that negative charges from anions were not fully neutralized by positive charges from
cations. This cation deficiency may probably be due to H+
Table 2. Percentage contributions of each class of chemical, in relation to PM10 levels
Species
Autumn 2003 Winter 2003 Spring 2003 Summer 2003-2004 Autumn 2004
Meana / (ng m-3)
Contributionb / %
Meana / (ng m-3)
Contributionb / %
Meana / (ng m-3)
Contributionb / %
Meana / (ng m-3)
Contributionb / %
Meana / (ng m-3)
Contributionb / %
Major ion 6143 10.6 7382 13.2 5189 12.1 4871 14.8 3846 9.6
Element 4616 8.0 4587 8.2 2069 4.8 2257 6.8 1955 4.9
Organicc 44 0.08 27 0.05 20 0.05 15 0.05 24 0.06
Unkownd 47197 81.4 44004 78.6 35721 83.1 25857 78.4 34174 85.4
aArithmetic mean; bpercentage contribution of each class of chemicals, in relation to PM10 concentration; corganics are stated as a sum of n-alkanes,
pristine, phytane and PAH mean values found in the same set of samples;14dunexplained concentration of PM10 by this study.
Table 1. Concentration levels (ng m-3) for elementos and ions in PM10 samples
Species Autumn 2003 Winter 2003 Spring 2003 Summer 2003-2004 Autumn 2004
Mean ± sd (Min - Max) Mean ± sd (Min - Max) Mean ± sd (Min - Max) Mean ± sd (Min - Max) Mean ± sd (Min - Max) Cl− 296 ± 264 (87 - 766) 374 ± 206 (148 - 593) 221 ± 230 (10 - 682) 353 ± 280 (72 - 703) 314± 146 (115 - 499)
NO3– 1538 ± 1210 (429 - 3625) 1404 ± 721 (435 - 2036) 784 ± 721 (115 - 2099) 411 ± 210 (292 - 785) 628 ± 638 (131 - 1703) PO43
− 66 ± 60 (7 - 157) 10 ± 7 (5 - 18) 19 ± 16 (1 - 38) 12 ± 8 (2 - 20) 11 ± 6 (4 - 16)
SO42− 1805 ± 1244 (592 - 3381) 2317 ± 1404 (1083 - 4113) 2146 ± 1410 (687 - 4369) 2205 ± 1406 (893 - 4585) 1771 ± 1176 (600 - 3689)
HCOO− 83± 50 (2 - 144) 168 ± 66 (125 - 244) 46 ± 51 (12 - 142) 30 ± 22 (12 - 62) 25 ± 6 (17 - 31)
C2O42
− 162 ± 84 (59 296) 181± 86 (69 - 260) 196 ± 150 (26 - 464) 137 ± 55 (56 - 210) 75 ± 35 (47 - 134)
succinate 41 ± 17 (5 - 64) 19 ± 12 (8 - 31) 26 ± 3 (22 - 29) 47 ± 60 (4 - 151) 32 ± 10 (20 - 43)
CH3COO
− 11 ± 5 (2 - 18) 12.7 ± 8.5 (2 - 22) 12 ± 11 (2 - 30) 6 ± 10 (2 - 24) 10 ± 6 (2 - 17)
Na+ 328± 224 (96 - 531) 307 ± 267 (67 - 682) 148 ± 106 (27 - 29) 329 ± 286 (42 - 637) 201 ± 199 (26 - 416) NH4
+ 687 ± 409 (270 - 1263) 1279 ± 899 (493 - 2316) 955 ± 730 (79 - 1763) 801 ± 686 (212 - 1988) 445 ± 324 (146 - 852) K+ 372 ± 181 (160 - 571) 722 ± 557 (144 - 1342) 196 ± 32 (152 - 249) 196 ± 59 (106 - 271) 122 ± 65 (36 - 194)
Mg2+ 79 ± 45 (36 - 159) 46 ± 21 (17 - 62) 53 ± 40 (17 - 132) 34 ± 41 (7 - 98) 20 ± 14 (7 - 39)
Ca2+ 675 ± 444 (289 - 1269) 542 ± 259 (195 - 820) 387 ± 165 (219 - 686) 310 ± 93 (175 - 438) 192 ± 95 (36 - 256)
Cu 32 ± 19 (7- 59) 26 ± 9 (14 - 36) 26 ± 26 (6 - 80) 38 ± 27 (14 - 81) 31 ± 19 (13 - 59)
Fe 1141 ± 765 (453 - 2176) 893 ± 612 (169 - 1657) 361 ± 219 (111 - 713) 334 ± 145 (95 - 491) 405 ± 174 (141 - 630)
Pb 42 ± 33 (15 - 96) 24 ± 5 (19 - 29) 19 ± 13 (7 - 37) 27 ± 22 (11 - 60) 15 ± 10 (1 - 27)
Zn 118 ± 96 (47 - 266) 86 ± 68 (16 - 180) 55 ± 32 (7 - 94) 91 ± 60 (21 - 153) 67 ± 21 (35 - 92)
Al 924 ± 751 (182 - 1961) 914 ± 760 (102 - 1882) 342 ± 194 (77 - 700) 321 ± 114 (156 - 457) 252 ± 145 (120 - 496) Ca 1024 ± 385 (656 - 1553) 1104 ± 198 (913 - 1302) 481 ± 155 (326 - 761) 472 ± 96 (421 - 641) 321 ± 14 (306 - 331) K 559 ± 394 (261 - 1268) 716 ± 474 (186 - 1116) 253 ± 30 (215 - 306) 243 ± 42 (188 - 285) 259 ± 72 (161 - 360) Mg 247 ± 97 (80 - 365) 245 ± 150 (40 - 379) 121 ± 45 (85 - 217) 127 ± 71 (72 - 246) 140 ± 98 (51 - 250) Na 529 ± 185 (291 - 796) 579 ± 178 (378 - 784) 411± 138 (274 - 677) 604 ± 339 (321 - 1076) 465 ± 159 (297 - 633) PM10 / (µg m-3) 58 ± 38 (27 - 116) 56 ± 54 (26 - 89) 43 ± 35 (13 - 117) 33 ± 4 (26 - 36) 40 ± 16 (28 - 67)
ion contribution (not measured in this study) to Σcations.
In the other seasons, Σcations/Σanions ratios were higher
than 1.0. In these cases, there is an anion deficiency maybe due to carbonate and bicarbonate ions (not measured in this work).
Ion diagnostic ratios (Table 4) were done in order to investigate how ion species are related to each other.
NH4
+/SO 4
2− ratio around the unity (1.0) gives the idea about
secondary process (gas-to-particle conversion) via reaction
between their vapor precursors (NH3 and SO2) forming
either NH4HSO4 or (NH4)2SO4. These are non-volatile
substances, generating then new particles.13 Since formation
of NH4Cl and NH4NO3 are reversible, they might be found
in PM in highly variable levels. During Autumn 2003, Spring 2003 and Summer 2003-2004, it seemed to have
enough gaseous NH3 to neutralize SO2 because NH4
+/SO 4
2−
ratios were, respectively, 1.0, 1.2 and 1.0. When the
following NH4
+/(SO 4
2− + NO
3−), NH4 +/(SO
4
2− + Cl−) and
NH4+/(NO3− + Cl−) ratios are considered, it is suggested
that for Winter 2003 NH4
+/(SO 4
2− + NO
3−) ratio = 1.0 and
NH4+/(SO42− + Cl−) ratio = 1.2, gaseous NH3 reacted to vapor
SO2, HCl and/or HNO3. Values below 1.0 for NH4
+/SO 4
2−,
NH4+/(SO42− + NO3−) and NH4+/(SO42− + Cl−) ratios for
Autumn 2004 show that there was not enough NH3 to
neutralize gaseous acids and it was probably done by crustal cations from dust resuspension (as it could be demonstrated
by Na+/Cl− ratio = 1.0 for Spring 2003 and Autumn 2004).
The ion HCOO− may be formed from precursors
emitted by vehicles and vegetation and is used as a tracer
of secondary processes while CH3COO− is mainly emitted
by fuel burning, being then a primary source tracer. When
HCOO−/CH
3COO− ratio is higher than 1.0, secondary sources are likely to prevail over primary sources. In all studied
periods, HCOO−/CH
3COO− ratios were higher than 1.0.
HCOO−/CH
3COO− ratio ranged from 3.2 (Autumn 2004) to
17.0 (Winter 2003), indicating that photochemical reactions
might be more important for the formation of these ions.12
According to Souza et al.,18 SO
4
2−, Na+, K+, Ca2+ and
Mg2+ in the atmospheric particulate matter may have sea
salt spray origin. In this way, the marine origin portion can
Table 4. Ion ratios (based in neq m-3 values) according to seasons in the PM10 samples
Ion ratios Autumn 2003 Winter 2003 Spring 2003 Summer 2003-2004 Autumn 2004
NH4+/SO42− 1.0 1.5 1.2 1.0 0.7
NH4+/(SO 42
− + NO
3
−) 0.6 1.0 0.9 0.8 0.5
NH4+/(SO 42
− + Cl−) 0.8 1.2 1.0 0.8 0.5
Na+/Cl− 1.7 1.3 1.0 1.4 1.0
HCOO−/CH
3COO− 10 17 5.0 6.2 3.2
Table 3. Ion balance considering the seasonal ion concentrations of PM10 samples (units in neq m-3)
Species Autumn 2003 Winter 2003 Spring 2003 Summer 2003-2004 Autumn 2004
Cl− 8.4 10.5 6.2 9.9 8.8
NO3− 24.8 22.6 12.6 6.6 10.1
PO43− 2.1 0.3 0.6 0.4 0.3
SO42− 37.6 48.3 44.7 45.9 36.9
HCOO− 1.9 3.7 1.0 0.7 0.6
C2O42− 3.7 4.1 4.5 3.11 1.7
Succinate 0.7 0.3 0.5 0.8 0.6
CH3COO− 0.2 0.2 0.2 0.1 0.2
Na+ 14.3 13.3 6.4 14.3 8.8
NH4+ 38.2 71.0 53.1 44.5 24.7
K+ 9.6 18.5 5.0 5.0 3.1
Mg2+ 6.5 3.8 4.4 2.9 1.7
Ca2+ 33.8 27.1 19.3 15.5 9.6
ΣCations 102 134 88.3 82.2 47.9
ΣAnions 79.3 90.2 70.3 67.6 59.2
ΣCations/ΣAnions 1.3 1.5 1.3 1.2 0.8
Cation deficiency − − − − 11.3
be calculated. Sea salt contribution for ions Cl−, SO 42−, K+,
Ca2+ and Mg2+ from PM10 were calculated based on typical
proportions between major ions from sea water18 (shown
in Figure 2). Sea spray contribution of SO4
2-, K+ and Ca2+
were below 3% for all seasons. It means that sources other than marine PM were more important for these ions. These
sources may be natural (for K+, Ca2+ and Mg2+ such as soil
resuspension) or anthropic (for Cl− and SO
4
2−, for instance,
vehicular and/or industrial) considering the characteristics of sampling site and São Paulo City. Anomalous (negative)
values were found for Cl− (all seasons) and Mg2+ (Summer
2003-2004 and Autumn 2004) in this study. This may have
happened since there have been modifications of Cl− (by
volatilization losses to form gaseous HCl) and Mg2+ (by
enrichment due to particle soil resuspension) quantities during types 1, 3 and 4 air mass trajectories (Figure 1) together to meteorological and topological condition changes.
Trace metals in aerosols are derived from a variety of sources which include the Earth crust, oceans, volcanic activity, the biosphere and a number of anthropogenic processes (e.g., fossil fuel burning, waste incineration, the processing of ores etc.). The degree to which a trace metal in an aerosol is enriched, or depleted, relative to a specific source can be assessed to a first approximation
using an enrichment factor (EF).19,20 Figure 3 presents
values higher than 10 for Zn, Pb and Cu which means that crustal origin is not significant for those metals. In this case, anthropic sources (biomass burning, vehicular emissions and industries) may account for them. In this way, soil resuspension seems to be important to those ones that EF value is smaller than 10 (Fe, Ca, K, Mg and Na).
Pearson correlation (95% confidence level) was calculated and Table 5 presents the PCA (95% confidence level) results for the studied species. Strong correlations
between SO4
2− and NH 4
+ (r = 0.7) can indicate gas-to-particle
Figure 2. Sea salt spray contribution for selected ions in PM10.
contribution for those levels in PM10, which agrees with
NH4
+/SO 4
2− values (Table 4) and discussion done there.
Furthermore, moderate correlations between SO42− (which
is a vehicular emission tracer) with C2O4
2− (r = 0.5) and
CH3COO− and C2O42− (r = 0.5) show that vehicular source is important for sulfate and oxalate. However, weak or even
negative correlations between HCOO− and C
2O42− (r = 0.3),
CH3COO− and HCOO− to SO4
2− (r = −0.1 and r = −0.01,
respectively) show other source (other than vehicular) for formate and acetate. Indeed, since there were not observed
correlations among CH3COO− and HCOO− with sulfate
but CH3COO−, HCOO− and C2O4
2− were relatively well
correlated so this may represent another common source
among them. Considering that HCOO−/CH
3COO− ratios > 1 in all seasons, it may seem that this additional source is their photochemical formation in atmosphere from precursors emitted directly such as olefins in situ oxidation.13,17 On the
other hand, succinate was not well correlated with HCOO−
(r = 0.1), with C2O42− (r = −0.1) and with SO42− (r = −0.2)
but slightly correlated with CH3COO− (r = 0.4) which
means that it was not emitted neither by vehicles nor by olefins in situ oxidation. Succinate can be emitted by the
metabolism of bacteria and fungi15-17 as it seems to have
happened during collection period in the present study. There were also observed weak-to-moderate correlations
between NH4
+ and HCOO− (r = 0.2) as well as NH
4 + and
C2O42− (r = 0.5). Considering that NH4+ levels were higher
than SO42−, there was enough NH4+ for neutralizing other
vapor acids. In this way, it is possible that the gaseous acids
(formic acid and oxalic acid) have reacted with vapor NH3
generating ammonium oxalate and ammonium formate.
According to Yao et al.,17 the former is also a non-volatile
salt that could suggest, together with ammonium sulfate, the gas-to-particle conversion contribution, while the latter is a volatile salt that could then regenerate their gaseous precursors.
Moderate-to-strong correlations (0.5 < r < 0.9) among
K+, Ca2+, Mg2+, Fe, Al, Ca, K and Mg show contribution
of soil suspended particles by taking into consideration that Fe and Al are crustal tracers. Also, good correlations
among K+, Ca2+, Mg2+, Pb, Cu and Zn may show another
source than soil suspension since Pb, Cu, and Zn had EF value higher than 10. This additional source is probably
anthropogenic. Considering K+ as a biomass burning tracer,
it is possible to consider here that it was such a probable source for them. Moreover, since Fe and Al were also well correlated with Pb, Cu and Zn, biomass burning was also important for Fe and Al atmospheric levels.
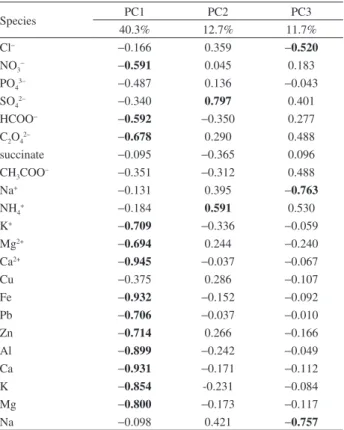
PCA suggests three principal components for explaining the acquired data for ions and trace metals. Significant scores (95% confidence level) are in bold. Table 6 presents three principal components, in which PC1 explains 40.3% of total variance, PC2 explains 12.7% of total variance, and
PC3 11.7% of total variance. PC1 states for NO3−, HCOO−,
Table 5. Pearson correlation (r) for ions and elements present in PM10 samples
Cl− NO
3− PO43− SO42−HCOO−C2O42− Succinate CH3COO− Na+ NH4+ K+ Mg2+ Ca2+ Cu Fe Pb Zn Al Ca K Mg Na
Cl− 1
NO3
− 0.10 1
PO43
− −0.20 0.56 1
SO42− 0.27 0.35 0.15 1 HCOO− −0.02 0.38 0.00 −0.01 1
C2O42
− 0.04 0.38 0.02 0.57 0.35 1
Succinate −0.10 −0.09 0.07 −0.23 0.09 −0.08 1
C2O42−, K+, Mg2+, Ca2+, Fe, Pb, Zn, Al, Ca, K and Mg, PC2 states for SO4
2− and NH 4
+, and PC3 represents Na+, Cl− and
Na. Our group tentatively proposes that PC1 represents a
mixed contribution of biomass burning (since K+ is used
as this source tracer) and/or automobile fuel burning, PC2 represents gas-to-particle conversion, and PC3 represents the sea spray contribution. These assumptions agree with the contribution of the four types of air mass trajectories discussed earlier. During biomass burning, it is difficult to distinguish releases due to burning by itself from soil suspension. Indeed, when biomass is being burnt, soil particles are suspended into fire and often biomass burning is associated with soil suspension. This may explain high scores for Al, Fe, Mg and Ca (soil suspension tracers) in PC1, as also observed by the EF value of them.
Dry atmospheric deposition fluxes (Fd) were calculated
by multiplying the geometric mean particulate concentration in air of the element of interest by the elemental dry settling
velocity.21 Table 7 presents seasonal estimates of dry
deposition fluxes for selected ions and trace metals from
PM10 samples. Since values of Fd are higher for both
Autumn 2003 and Winter 2003 (characterized as drier seasons) than other seasons, it was possible to say that dry deposition was the predominant removal mechanism in these periods while probably wet deposition had a higher influence in Spring 2003, Summer 2003-2004 and exceptionally in Autumn 2004.
In a previous study done in July 2003 in São Paulo State, at SPA, Araraquara (ARQ) and Piracicaba (PRB) sites, sugar cane burning and industrial activities were the major
emissions sources.14 Burning of solid waste and biomass on
small properties and at landfills was responsible for the high
Cl− ion concentrations at SPA site. The abundance of NO
3−,
SO42− and K+ at ARQ site suggested that the atmosphere was
influenced by vehicular and biomass burning emissions.
The presence of NO3−, SO42−, Fe, Al, Ca and K at the PRB
site suggested that soil resuspension and sugarcane burning
Table 7. Seasonal estimates of aerosol dry deposition flux (Fd) for selected ions and elements in the PM10 samples
Cl− a NO 3
− a SO 42
− aHCOO− bCH 3COO
− b Na+ a NH
4+ a K+ a Mg2+ c Ca2+ c Cud Fed Pbd Znd Ale Caf Mgd Dry settling veloc. (Vd) / (cm s-1) 4.1 0.27 0.52 0.5 1.0 3.49 0.13 3.9 1.5 2.1 0.4 1 1.5 0.8 0.15 1.07 0.3 Autumn 2003
Geometric mean / (ng m-3) 213.8 1193 1413 49.80 9.200 253.6 579.0 333.0 69.50 565.1 26.50 928.2 32.10 90.40 636.9 964.0 223.9 Fd / (µg m-2 day-1) 757.4 278.2 635.0 21.53 7.97 764.7 65.03 1122 90.03 1025 9.160 802.0 41.61 62.45 82.54 891.2 58.03 Winter 2003
Geometric mean / (ng m-3) 326.0 1206 2007 160.7 9.400 222.5 1029 522.8 40.90 480.2 24.20 678.2 23.30 62.90 591.3 1091 184.6 Fd / (µg m-2 day-1) 1155 281.3 901.9 69.41 8.110 670.9 115.5 1762 53.06 871.2 8.350 586.0 30.18 43.49 76.64 1008 47.84 Spring 2003
Geometric mean / (ng m-3) 123.5 502.3 1738 29.20 7.000 112.5 599.8 193.8 41.70 359.5 17.10 304.9 15.60 43.00 289.5 461.4 115.4 Fd / (µg m-2 day-1) 437.4 117.2 780.9 12.62 6.090 339.2 67.37 652.9 54.02 652.2 5.920 263.4 20.27 29.74 37.52 426.6 29.92 Summer 2003-2004
Geometric mean / (ng m-3) 252.4 380.1 1909 25.20 3.300 214.8 619.2 187.9 17.80 297.6 31.70 294.0 21.70 71.20 301.8 465.6 114.7 Fd / (µg m
-2 day-1) 894.2 88.68 857.7 10.88 2.870 647.7 69.55 633.2 23.05 540.0 10.94 254.1 28.15 49.23 39.11 430.4 29.73 Autumn 2004
Geometric mean / (ng m-3) 280.6 424.2 1488 24.50 8.400 112.2 347.3 103.6 16.10 157.4 26.70 365.3 10.50 63.60 224.0 320.7 111.2 Fd / (µg m-2 day-1) 994.2 98.95 668.7 10.59 7.290 338.4 39.01 349.1 20.81 285.7 9.210 315.6 13.63 43.94 29.03 296.5 28.82 aReference 22; breference 23; creference 24; dreference 25; ereference 26; freference 27.
Table 6. Principal component analyses (PCA) for major ions and elements found in PM10 samples
Species PC1 PC2 PC3
40.3% 12.7% 11.7%
Cl− −0.166 0.359 −0.520
NO3− −0.591 0.045 0.183
PO43– −0.487 0.136 −0.043
SO42– −0.340 0.797 0.401
HCOO− −0.592 −0.350 0.277
C2O42– −0.678 0.290 0.488
succinate −0.095 −0.365 0.096
CH3COO− −0.351 −0.312 0.488
Na+ −0.131 0.395 −0.763
NH4+ −0.184 0.591 0.530
K+ −0.709 −0.336 −0.059
Mg2+ −0.694 0.244 −0.240
Ca2+ −0.945 −0.037 −0.067
Cu −0.375 0.286 −0.107
Fe −0.932 −0.152 −0.092
Pb −0.706 −0.037 −0.010
Zn −0.714 0.266 −0.166
Al −0.899 −0.242 −0.049
Ca −0.931 −0.171 −0.112
K −0.854 -0.231 −0.084
Mg −0.800 −0.173 −0.117
Na −0.098 0.421 −0.757
have strong influences. Despite the PM10 and species levels found in the intensive campaign were higher than those found in the different seasons; the main emissions sources were similar in both campaigns.
Conclusions
The present study showed that for NH4
+ and SO
4 2−,
secondary process (gas-to-particle conversion) via reaction between their vapor precursors was one relevant ion source in PM10. Sea salt spray was a minor source for some ions (Cl−, SO
4
2−, K+, Ca2+ and Mg2+). Instead, other sources were
more important such as natural (for Al, Fe, Ca and Mg) or
anthropogenic (Cl− and SO
4
2−, vehicular). Some sources
were predominant for some species: (i) fuel burning and/or biomass burning (NO3−, HCOO−, C2O4
2−, K+, Mg2+, Ca2+, Fe,
Pb, Zn, Al, Ca, K and Mg), (ii) gas-to-particle conversion
(SO4
2− and NH
4
+) and (iii) sea salt spray (Cl−, Na+ and Na).
Acknowledgements
Authors wish to thank the following research support agencies: Fundação de Amparo à Pesquisa do Estado de São Paulo (FAPESP Project No. 2001/01763-0) and Conselho Nacional de Conselho Científico e Tecnológico (CNPq). P. C. Vasconcellos and G. O. Da Rocha acknowledge CNPq for their research fellowships.
References
1. Kumagai, K.; Iijima, A.; Tago, H.; Tomioga, A.; Kozawa, K.; Sakamoto K.; Atmos. Environ. 2009, 43, 3345.
2. Singh, R.; Bhupendra, S.; Sharma, S. B.; Chalka, S. N.; Environ. Monit. Assess. 2010, 168, 195.
3. Srimuruganandam, B.; Nagendra, S. M. S.; Sci. Total Environ. 2012, 433, 8.
4. Harrison, R. M.; Giorio, C.; Beddows, D. C. S.; Dall’Osto; Sci. Total Environ. 2010, 409, 289.
5. Chiarelli, P. S.; Pereira, L. A. A.; Saldiva, P. H. N.; Ferreira Filho, C.; Garcia, M. L. B.; Braga, A. L. F.; Martins, L. C.; Environ. Res.
2011, 111, 650.
6. Novaes, P.; Saldiva, P. H. N.; Matsuda, M.; Macchione, M.; Rangel, M. P.; Kara-José, N.; Berra, A.; Environ. Res.2010, 110, 372.
7. Olmo, N. R. S.; Saldiva, P. H. N.; Braga, A. L. F.; Lin, C. A.; Santos, U. P.; Pereira, L. A. A.; Clinics2011, 66, 681. 8. Davel, A. P.; Lemos, M.; Pastro, L. M.; Pedro, S. C.; André,
P. A., Hebeda, C.; Farsky, S. H. Saldiva, P. H.; Rossoni, L. V.; Toxicology2012, 295, 39.
9. http://www.euro.who.int/__data/assets/pdf_file/0005/78638/ E90038.pdf, accessed in October 2012.
10. López, J. M.; Callén, M. S.; Murillo, R.; García, T.; Navarro, M. V.; de la Cruz, M. T.; Mastral, A. M.; Environ. Res.2005, 99, 58.
11. Vasconcellos, P. C.; Balasubramanian, R.; Bruns, R. E.; Sanchez-Ccoyllo, O.; Andrade, M. F.; Flues M.; Water, Air, Soil Pollut. 2007, 186, 63.
12. Allen, A. G.; Cardoso, A. A.; da Rocha, G. O.; Atmos. Environ.
2004, 38, 5025.
13. da Rocha, G. O.; Allen, A. G.; Cardoso, A. A.; Environ. Sci. Technol. 2005, 39, 5293.
14. Vasconcellos, P. C.; Souza, D. Z.; Magalhães, D.; da Rocha, G. O.; Water, Air, Soil Pollut.2011, 222, 325.
15. Kawamura, K.; Ikushima, K.; Environ. Sci. Technol. 1993, 27, 2227.
16. Kawamura, K.; Kaplan, I. R.; Environ. Sci. Technol. 1985, 19, 1082.
17. Yao, X.; Fang, M.; Chan, C. K.; Ho, K. F.; Lee, S. C.; Atmos. Environ. 2004, 38, 963.
18. Souza, P. A.; Mello, W. Z.; Mariani, R. L.; Sella, R. M.; Quim. Nova2010, 33, 1247.
19. Sardans, J.; Peñuelas, J.; Chemosphere 2005, 60, 1293. 20. Pereira, P. A. P.; Lopes, W. A.; Carvalho, L. S.; da Rocha, G. O.;
Bahia, N. C.; Loyola, J.; Quitério, S. L.; Escaladera, V.; Arbilla, G.; de Andrade, J. B.; Atmos. Environ. 2007, 41, 7837.
21. Da Rocha, G. O.; Lopes, W. A.; Pereira, P. A. P.; Vasconcellos, P. C.; Santos, F. O.; Carvalho, L. S.; Conceição, L. S.; de Andrade, J. B.; J. Braz. Chem. Soc. 2009, 20, 680.
22. Chu, C. C.; Fang, G. C.; Chen, J. C.; Yang, I.; Environ. Monit. Assess. 2008, 146, 441.
23. Khare, P.; Kumar, N.; Satsangi, G. S.; Kumari, K. M.; Srivastava, S. S.; Chemosphere 1998, 36, 2993.
24. Cadle, S. H.; Dasch, J. M.; Mulawa, P. A.; Atmos. Environ. 1985, 19, 1819.
25. Fang, G. C.; Wu, Y. S.; Chang, S. Y.; Lin, J. B.; Lin, J. G.; Chemosphere 2007, 67, 966.
26. Quinn, T. L.; Ondov, J. M.; Atmos. Environ. 1998, 32, 3467. 27. Odabasi, M.; Muezzinoglu, A.; Bozlaker, A.; Atmos. Environ.
2002, 36, 5841.
Submitted: April 8, 2012
Published online: October 26, 2012