Article
J. Braz. Chem. Soc., Vol. 23, No. 9, 1680-1687, 2012. Printed in Brazil - ©2012 Sociedade Brasileira de Química 0103 - 5053 $6.00+0.00
A
*e-mail: [email protected]
Stripped Sour Water Treatment by Advanced Oxidation Processes
José R. Guimarães,* Mirthys C. Gasparini, Milena G. Maniero and Carlos G. N. Mendes
School of Civil Engineering, Architecture and Urbanism, University of Campinas, Av. Albert Einstein, 951, CP 6021, 13083-852 Campinas-SP, Brazil
No presente trabalho foi avaliada a aplicação dos processos de fotólise (UV), peroxidação (H2O2), peroxidação assistida por radiação ultravioleta (UV/H2O2), reagente de Fenton
(H2O2/Fe(II)) e foto-Fenton (H2O2/Fe(II)/UV) no tratamento de água ácida retificada proveniente
da Refinaria de Petróleo Replan da Petrobras, Paulínia-SP. Para avaliação da eficácia dos processos, a concentração de carbono orgânico dissolvido (COD) foi monitorada durante todo o período de reação. Dentre os processos avaliados, a peroxidação assistida por radiação ultravioleta apresentou o melhor potencial para sua aplicação no tratamento da água ácida retificada.
This study assessed the application of photolysis (UV), peroxidation (H2O2), peroxidation
combined with ultraviolet light (UV/H2O2), Fenton’s reagent (H2O2/Fe(II)) and photo-Fenton (H2O2/Fe(II)/UV) processes in the treatment of stripped sour water from the Petrobras Replan Oil Refinery in Paulínia City, São Paulo State, Brazil. To evaluate the efficiency of the process, the concentration of dissolved organic carbon (DOC) was monitored throughout the reaction period. Among the evaluated processes, peroxidation combined by ultraviolet radiation showed the best potential for its application in the stripped sour water treatment.
Keywords: Fenton, oil refinery, photo-Fenton, reuse, UV/H2O2
Introduction
The oil refining industry uses a large amount of water in its production process, generating a large volume of effluent. At the Replan Refinery in Paulínia City (São Paulo State, Brazil), 700 L of water are consumed per 1000 L of oil
processed. There is a great interest in improving wastewater management in petrochemical facilities by optimizing water use and introducing technologies which enable water to be reused in production units.1
Sour water is one of the most significant issues in a refinery mainly due to its composition and its corrosive nature.It is produced by various different processes and thus its composition varies.In addition, the management cost of this type of water is quite high. Sour water is defined as any processed water containing hydrogen sulfide, ammonia, phenols, cyanides, dissolved oils, mercaptans, hydrocarbons, suspended solids and high levels of dissolved organic carbon (DOC) and chemical oxygen demand (COD).2It usually has pH values above
7, though it gets its name from its characteristic smell. Sour water may result from water vapor injected into oil processing units in order to reduce the partial pressures of hydrocarbons, which provides less extreme temperature conditions. Some is generated by injection of wash water to prevent salt deposition inside pipes or equipment such as heat exchangers.According to Coelho et al.,3 typical sour
water production in large refineries is between 0.2 and 0.5 m3 ton-1 of crude oil processed.
Sour water is typically not treated along with the effluents from the refinery. It is separated and stripped in order to remove sulfide and ammonia, so they can be reused in the refining process.Though stripped sour water from the Petrobras Replan Refinery in Paulínia City is H2S-free,
it contains high levels of ammonia, mercaptans and hydrocarbons, in addition to oils and greases. For this reason, it is not possible to reuse all the sour water produced at Replan.
is intended to be reused. Advanced oxidation processes (AOPs) are technologies that involve the generation of hydroxyl radicals (•OH), which are highly oxidizing and
non-selective. Due to their high reactivity, these radicals can react with a wide variety of complex organic compounds, oxidizing them to simple molecules, or even mineralizing them.4,5
Biodegradation,6 membrane bioreactor methods,7
electrocoagulation,8 enhanced photo-degradation,9
electrochemical methods,10,11 microwave-assisted catalytic
wet air oxidation12 and photocatalytic degradation methods1
are used for the treatment of effluents from oil refineries. However, there are still few works about sour water treatment in scientific literature.
Coelho et al.3 evaluated reduction of DOC from sour
water from a petroleum refinery by several oxidation processes and verified that Fenton and photo-Fenton led to the best results. Bhargava et al.13 employed the catalytic
wet oxidation process for treating stripped sour water from an oil shale refinery in Australia, with a 9 g L-1 DOC initial
concentration, and they reduced DOC by 73% after a 3 h reaction at 200 °C using a copper and palladium bimetallic catalyst. Prasad et al.14 adopted the wet oxidation with
hydrogen peroxide technique to treat the same effluent used by Bhargava et al.13 DOC removal was 80% in 1.5 h
at 150 °C, using 64 g L-1 of H 2O2.14
It is also important to emphasize that studies based on treatment of industrial effluents for the purpose of reusing them in the production process have become very important. Reusing treated water consolidates alternatives and actions that use water more rationally, minimizing waste. Among various published works, Ismail and Al-Hashimi,15 El-Salam and El-Naggar,16
Oliveira et al.17 and de Feo et al.18 reported reuse proposals
in different kinds of industrial plants.
The objective of this study was to evaluate reduction of dissolved organic carbon present in stripped sour water flow by five processes: photolysis (UV), peroxidation (H2O2), peroxidation with ultraviolet radiation (UV/H2O2),
Fenton’s reagent (H2O2/Fe(II)) and photo-Fenton (H2O2/Fe(II)/UV). The effects of initial concentrations
of hydrogen peroxide and ferrous ions (Fe(II)) on the treatment of this effluent were also investigated.
Experimental
Reagents and effluent
Ferrous sulfate heptahydrate (FeSO4.7H2O),
concentrated sulfuric acid and hydrogen peroxide (30% v/v) were supplied by Synth (Diadema, Brazil).
Stripped sour water samples from the Replan Refinery in Paulínia City were collected and transferred to the Laboratory of Oxidation Processes (LABPOX) of the Department of Sanitation and Environment (DSA) (School of Civil Engineering, Architecture and Urbanism, at University of Campinas (Unicamp)). The sample was characterized (Table 1) and stored in a refrigerator (ca. 10 °C).
Notable levels of COD, BOD (biochemical oxygen demand) and DOC were found, suggesting the presence of dissolved oil, phenols and hydrocarbons. The low BOD/COD ratio (0.27) indicates the low biodegradability of this effluent. The pH value is high because caustic soda is added to remove ammonia gas in the stripping tower. The electrical conductivity (EC) value might indicate the presence of salts dissolved in the sample. The effluent had pink-orange coloring.
Experimental system
The batch system used in this study is presented in Figure 1. The batch was made using a photochemical reactor, a magnetic stirrer, a 600 mL vessel and a peristaltic
Table 1. Characterization of stripped sour water sample
Parameters Values Units
COD 553 mg O2 L-1
BOD 147 mg O2 L-1
DOC 160.5 mg L-1
EC 396 µS cm-1
pH 9.5
Turbidity 30 UT
Apparent color 624 PtCo
pump to recirculate the solution at a flow of approximately 207 mL min-1. This system was based on works by
da Silva et al.19 and Guimarães et al.20
The bench photochemical reactor consisted of a 42.5 cm long and 4 cm internal diameter borosilicate glass cylinder with a low pressure mercury vapor lamp inserted in the center (15 W, λmax of 254 nm, 2.5 cm internal diameter, brand Ecolume). The lamp was in direct contact with the circulating solution. The internal volume of the reactor was approximately 270 mL. The radiation intensity (I) of the UV lamp was 8.3 mW cm-2. It was obtained by a VLX 3Wr
model Cole Parmer radiometer calibrated to 254 nm. In this experimental system, the effluent was continuously stirred inside the vessel, pumped into the reactor with an upward flow and returned to the vessel, forming a closed-circuit. In tests using UV radiation, the UV light exposure time of the effluent was different from the total trial time, and was calculated according to equation 1.
tirrad = ttot (Vreact / Vsol) (1)
in which tirrad is exposure time to UV radiation (min), ttot is total trial time (min), Vreact is useful volume of the photolytic
reactor (mL) and Vsol is total volume of the solution (mL). A volume of 500 mL of the sample was used in all tests. In peroxidation and UV/H2O2 trials, H2O2 was added once at different DOC:H2O2 mass ratios between 1:2 and 1:7, giving
360 to 1260 mg L-1 H
2O2 concentrations. For Fenton and
photo-Fenton processes, 1:5 and 1:7 DOC:H2O2 (900 and
1260 mg L-1 H
2O2) mass rations were evaluated, and ferrous
ion concentration varied from 31 to 500 mg L-1. Photolysis,
peroxidation and UV/H2O2 trials were performed at the original pH of the sample, while the value was adjusted to pH 3.0 in Fenton and photo-Fenton processes using diluted sulfuric acid.
Aliquots were collected after 15 min and every 30 min thereafter to monitor the concentration of DOC in order to evaluate the effectiveness of procedures. After total reaction time, COD, color, turbidity and electrical conductivity analyses were also performed.
Analytical methods
A Shimadzu model 5000A total organic carbon analyzer was used for DOC analysis.COD and BOD analyses were performed according to APHA/AWWA/WEF standard methods.21
Measurements of hydrogen ionic potential (pH) were performed using the electrometric method, using the ASTM D1293 methodology with a Thermo Orion 410A pH meter.22
Turbidity analyses were based on section 2130 B of the APHA/AWWA/WEF methodology,21 using a HACH model
2100N turbidimeter.Electrical conductivity measurements were performed according to APHA/AWWA/WEF section 2510 B21 on a Micronal B330 conductivity meter.
Color analyses were performed as defined in section 2120 C of the APHA/AWWA/WEF methodology21 using
a HACH model DR4000 spectrophotometer.
A colorimetric analytical method was adopted for the determination of hydrogen peroxide. It was based on redox reactions between the solution, which contained H2O2, and
a yellow-colored acidic metavanadate ion solution.Due to the formation of red-orange-colored peroxovanadium cations with maximum absorbance at 450 nm, hydrogen peroxide concentration could be obtained by UV-Vis spectrophotometry.23
Results and Discussion
Photolysis (UV)
DOC reduced by 17% after 210 min of photolysis. This may be because of the degradation of compounds present in the sample and/or decreased solubility of certain volatile and semi-volatile organic compounds due to the approximately 8 °C temperature increase during the trial.
COD (16.4%) was reduced by a similar amount to DOC. Color was reduced by 58% and turbidity by 29%. The decreased values for these parameters may be due to the effect of temperature on solubility and to UV radiation modifying the structure or destroying the chromophore groups of a set of molecules present in the effluent that absorb electromagnetic radiation at a wavelength close to 254 nm.
Photolysis was found to reduce DOC by a similar amount by Coelho et al.,3 who verified reduction of 20%
in treatment of sour water from an oil refinery with initial DOC concentration around 1000 mg L-1.
Peroxidation (H2O2)
There was no reduction in DOC concentration in the peroxidation process, showing that the compounds present in stripped sour water cannot be mineralized when only the oxidant hydrogen peroxide is applied.
Coelho et al.3 verified that peroxidation reduced DOC
of sour water from an oil refinery by only 8%, confirming the results obtained in this work.
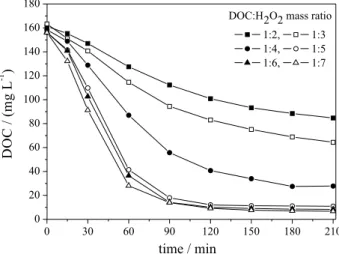
Peroxidation combined with ultraviolet light (UV/H2O2)
According to Figure 2, when DOC:H2O2 mass ratio
was 1:2, DOC reduction was 47.5%. At a ratio of 1:3, DOC reduction was 60.6%. Both were slower and smaller than the higher ratios in 210 min of reaction. When the DOC:H2O2 mass ratio was 1:4, degradation was 82% for
the same reaction time. This showed that a higher H2O2 concentration had a more pronounced DOC concentration decay curve, i.e., a higher degradation rate of organic compounds. However, this behavior was verified only up to 1:4 DOC:H2O2 mass ratio.
No significant differences were noted in DOC reduction among DOC:H2O2 mass ratios of 1:5, 1:6 and 1:7:
maximum organic carbon reduction values were between 93 and 95% in 150 min of reaction.
Abramovic et al.24 observed the same behavior in the
degradation of the insecticide thiacloprid: a rapid increase in the reaction rate occurred at H2O2 concentrations from 0 to 45 mmol L-1 (0 to 1530 mg L-1), while for the range
of 45-162 mmol L-1 (1530 to 5508 mg L-1) only a slight
increase was observed. It remained practically constant afterwards. Ghodbane and Hamdaoui25 verified that up
to the limit of 1543 mg L-1, more color was removed as
initial H2O2 concentration increased, supporting the results obtained here.
According to Silva et al.26 and Daneshvar et al.,27
when there is excess H2O2, there may be reactions that
compete for hydroxyl radicals (equations 2 to 4). As a result, increasing hydrogen peroxide concentration does not
increase DOC degradation because of competition between the oxidant and the organic compounds by •OH. Therefore,
there is an optimal concentration of this oxidant at which the photo-oxidation rate is at its maximum.
•OH + H
2O2→ HO2• + H2O (2)
2 •OH → H
2O2 (3)
HO2• + •OH → O
2 + H2O (4)
Fenton’s reagent (H2O2/Fe(II))
The 1:5, 1:6 and 1:7 DOC:H2O2 mass ratios were able to reduce more than 90% of DOC in the UV/H2O2 tests, so
the 1:5 and 1:7 mass ratios were used in the Fenton tests in order to make a comparison between the processes. Iron concentrations from 31 to 500 mg L-1 were used, thus the
oxidant/ferrous ion mass ratios varied from 1.8:1 to 40:1. Optimum H2O2:Fe(II) molar ratios from 1:1 to 400:1 (0.6:1 to 242.8:1 mass ratios) have been proposed to degrade different compounds in aqueous solution.28
The reaction rate in the first 60 min for Fenton’s reagent was directly proportional to Fe(II)concentration for both 1:5 and 1:7 DOC:H2O2 ratios, as shown in Figure 3.
This process proved to be very inefficient when low concentrations of ferrous ion (31 mg L-1) were applied,
reaching a maximum DOC reduction of only 8%. For initial Fe(II) contents of 125, 250 and 500 mg L-1, DOC reduction
was very similar in 120 min of reaction, ranging from 38 to 45%. These values stabilized after this reaction period.
Other works have also reported DOC removal of around 40% employing Fenton’s reagent for the treatment of effluents.29 This may occur due to the formation of
carboxylic acids. These treatment-resistant intermediate compounds react very slowly with •OH, making the reaction
unproductive.30 Another possibility is the reaction of Fe(III)
ions with these intermediate products, forming stable organic compounds that are difficult to degrade, decreasing the efficiency of the reaction, as shown in equation 5.3,29,31
Fe(III) + RCO2−→ [Fe(III)(RCO
2−)]2+ (5)
For both concentrations of hydrogen peroxide evaluated, DOC reduction was almost the same. Increasing H2O2 concentration from 900 mg L-1 (1:5 DOC:H
2O2) to
1260 mg L-1 (1:7 DOC:H
2O2) while maintaining the same
Fe(II)content did not significantly improve DOC and COD reduction within the time of the experiment. The highest efficiencies obtained were 49% for DOC and 81.7% for COD.
Varying Fe(II) and H2O2 concentrations, it was found the same effect by Padoley et al.32 assessing Fenton’s Figure 2. DOC concentration variation over time for degradation by
reagent as a pretreatment option for 3-cyanopyridine wastewater (which had high ammonia content, alkaline pH and extremely high COD values). Padoley et al.32
verified that more COD was removed when ferrous sulfate concentration was increased up to a ferrous concentration of 2.4 g L-1 and increasing hydrogen
peroxide concentration over 750 mg L-1 did not result in
increasing COD reduction.
Photo-Fenton process (H2O2/Fe(II)/UV)
After the first 60 min of reaction in the photo-Fenton process, DOC removal was inversely proportional to Fe(II) concentration for both DOC:H2O2 mass ratios assessed
(1:5 and 1:7), as shown in Figure 4. This is different from what happened with Fenton’s reagent. It was found that the optimum Fe(II)concentration was the lowest assessed (31 mg L-1). The lower concentrations of ferrous ion used
resulted in more efficient DOC removal efficiencies since Fe(II) ions are regenerated by [Fe(OH)]2+ and [Fe(RCO
2)]2+
photolysis in the Fenton/photo-Fenton system, among other mechanisms, according to equations 6 and 7.30,33
[Fe(OH)]2+ + hν→ Fe(II) + •OH (6)
[Fe(RCO2)]2+ + hν→ Fe(II) + CO2 + •R (7)
It is possible that so many hydroxyl radicals are formed by the decomposition of H2O2 in the photo-Fenton process
at high Fe(II) concentrations. Competitive reactions take place consuming a large amount of those hydroxyl radicals (equations 2 to 4) before they are effectively used in the degradation of organic compounds.33 High Fe(II)
concentration can result in increased turbidity of the solution, preventing the absorption of the UV radiation necessary for photolysis. In addition, excess Fe(II) ions can scavenge hydroxyl radicals.31,33-36
The test lasted 150 min. At this point, there was no notable difference between DOC reduction values at the two hydrogen peroxide concentrations assessed: 900 mg L-1
(1:5 DOC:H2O2) and 1260 mg L-1 (1:7 DOC:H2O2). The best
result was around 95% DOC reduction at the 1:5 DOC:H2O2 mass ratio with the Fe(II)concentration of 31 mg L-1.
A similar result (94%) was obtained using the highest H2O2 concentration and the same Fe(II) concentration
(31 mg L-1). The highest efficiency for the COD parameter
Figure 3. DOC values at different Fe(II) concentrations over time for (a) 1:5 and (b) 1:7 DOC:H2O2 mass ratios, for the Fenton process.
was also achieved using a concentration of 31 mg L-1 Fe(II)
for both DOC:H2O2 mass ratios.
Comparison between the processes
Figure 5 shows the results of DOC reduction of stripped sour water subjected to photolysis, peroxidation, peroxidation assisted by ultraviolet light, Fenton and photo-Fenton processes for 210 min of testing.
The maximum DOC reduction by photolysis after 210 min was 17%, while peroxidation was not able to reduce DOC concentration, independent of the concentration of peroxide used (360 to 1260 mg L-1).
For the UV/H2O2 process, in 210 min of reaction, DOC reduction efficiency at 1:5 DOC:H2O2 was 93%,while it
was 98% at a 1:7 mass ratio, and COD removal efficiencies were 95% for 1:5 DOC:H2O2 and 99% for a 1:7 mass
ratio. Maximum color reduction was 42.3%. However, this process was not effective at reducing turbidity (maximum 4.0%). The reactions were definitely more significant for dissolved compounds.
By using 1:7 DOC:H2O2 mass ratio and 250 mg L-1 of
Fe(II), DOC was reduced 45% in 120 min for Fenton’s reagent. After that time, reduction efficiency stabilized. DOC removal was 95% for the photo-Fenton process using 31 mg L-1 ferrous ion and a 1:5 DOC:H
2O2 mass ratio in
150 min of reaction.
It can be concluded that, considering the total testing time of 210 min, peroxidation, photolysis and Fenton’s reagent processes were not very efficient at degrading the organic compounds found in stripped sour water.
Photo-mediated processes using UV radiation (UV/H2O2 and
photo-Fenton) offered the most efficient DOC reduction.
Potential reuse of the effluent treated by AOP
Among the studied processes, peroxidation combined with ultraviolet radiation (UV/H2O2) presented as a promising
process to treat stripped sour water for the purpose of reusing. The photo-Fenton process also resulted in the reduction of most of DOC from stripped sour water (as shown in Figure 5). However, here are some disadvantages in the use of the photo-Fenton process. The pH value must be adjusted at the beginning and at the end of the reaction and precipitated iron hydroxide has to be removed as well, generating additional costs. Another restriction may relate to high electrical conductivity values of the effluent treated by photo-Fenton, around 1200 µS cm-1, which could significantly reduce the
possibilities of reusing of this effluent.
By comparing the two DOC:H2O2 mass ratios in
peroxidation assisted by ultraviolet radiation (Figure 5), it can be concluded that the best treatment option is using the DOC:H2O2 1:5 ratio. This conclusion took the economy of hydrogen peroxide into account since the efficiency of both treatments was very similar.
One possibility for reusing the stripped sour water treated by peroxidation assisted by ultraviolet radiation (1:5 DOC:H2O2 mass ratio) would be as replacement
water in the cooling towers since they are responsible for consuming 49% of the water collected from the Jaguari River by Replan Refinery in Paulínia City. Table 2 shows the parameters analyzed for raw effluent and that treated by the UV/H2O2 process compared with values recommended by US EPA (United State Environmental Protection Agency) for cooling tower feedwater.37 It is worth mentioning that
there is no legislation governing water reuse in Brazil.
Figure 5. DOC value variation over time during treatment by (a) H2O2 (DOC:H2O2 1:7 mass ratio), (b) UV, (c) Fenton’s reagent (250 mg L-1 Fe(II) and DOC:H2O2 1:7 mass ratio), (d) UV/H2O2 (DOC:H2O2 1:5 mass ratio), (e) UV/H2O2 (DOC:H2O2 1:7 mass ratio) and (f) photo-Fenton (31 mg L-1 Fe(II) and DOC:H
2O2 1:5 mass ratio).
Table 2. Characterization of stripped sour water before and after treatment
by UV/H2O2 process (DOC:H2O2 1:5 mass ratio; 210 min of reaction) and recommended values for replacement water in cooling towers (adapted from Oenning Jr. and Pawlowsky)38
Parameters Units
Results Recommended
limits for cooling water
Raw Treated
COD mg O2 L-1 553 15 ≤ 75a
BOD mg O2 L-1 147 n.p. ≤ 30b
DOC mg L-1 160.5 10.9 n.f.
EC µS cm-1 396 520 800-1200c
pH 9.5 8.2 6-9b
Turbidity UT 30 29.8 ≤ 3.0d
Apparent color
PtCo 624 428 n.f.
By comparing the values of the parameters analyzed with the recommended limits for replacement water in cooling towers, it can be seen that the only parameter that does not fit is the turbidity value, which is much higher than the recommended one. The other values are within the range recommended in literature.37,39 It is important to emphasize
that no information was found on the recommended values for DOC and color parameters.
Therefore, in order to make the reuse of stripped sour water treated by UV/H2O2 process feasible as replacement water in the cooling towers, it would be necessary to pre-treat the water to reduce turbidity. The pre-pre-treatment could be performed by means of a physical process. Furthermore, studies involving scale-up are of fundamental importance. However, a more detailed and thorough study would be indispensable in order to select the most appropriate technique, in addition to careful economic evaluation and monitoring to avoid damaging the cooling system.
Conclusions
The photo-irradiated advanced oxidation processes (photo-Fenton and peroxidation assisted by ultraviolet radiation) were highly effective at reducing DOC in stripped sour water. The photo-Fenton process (H2O2/Fe(II)/UV)
was able to reduce 95% of DOC when 31 mg L-1 of Fe(II)
were used at a 1:5 DOC:H2O2 mass ratio. DOC reduction
efficiency by UV/H2O2 was nearly 95% when 1:5, 1:6 and 1:7 DOC:H2O2 mass ratios were employed.
Finally, the peroxidation assisted by ultraviolet radiation (1:5 DOC:H2O2 mass ratio) presented high potential for
the treatment of stripped sour water for the purpose of its reuse as replacement water in cooling towers after being treated to reduce turbidity. However, scale-up studies are necessary for proper management of the treated effluent.
Acknowledgements
The authors would like to thank Petrobras and Coordenação de Aperfeiçoamento de Pessoal de Nível Superior (CAPES) for providing scholarships to M. C. Gasparini and M. G. Maniero (PNPD 0233080).
References
1. Saien, J.; Nejati, H.; J. Hazard. Mater.2007, 148, 491.
2. United States Environmental Protection Agency (US EPA); Profile of the Petroleum Refining Industry; Office of Compliance Sector
Notebook Project: Washington D.C, September, 1995, http:// www.epa.gov/compliance/resources/publications/assistance/ sectors/notebooks/petrefsn.pdf accessed in August 2012.
3. Coelho, A.; Castro, A. V.; Dezotti, M.; Sant’Anna Jr., G. L.;
J. Hazard. Mater. 2006, B137, 178.
4. Malato, S.; Blanco, J.; Vidal, A.; Alarcón, D.; Maldonado, M. I.; Cáceres, J.; Gernjak, W.; Sol. Energy2003, 75, 329.
5. Maniero, M. G.; Bila, D. M.; Dezotti, M.; Sci. Total Environ.
2008, 407, 105.
6. Wang, L.; Barrington, S.; Kim, J.-W.; J. Environ. Manage. 2007,
83, 191.
7. Rahman, M. M.; Al-Malack, M. H.; Desalination2006, 191, 16.
8. El-Naas, M. H.; Al-Zuhair, S.; Al-Lobaney, A.; Makhlouf, S.;
J. Environ. Manage.2009, 91, 180.
9. Stepnowski, P.; Siedlecka, E. M.; Behrend, P.; Jastorff, B.;
Water Res.2002, 36, 2167.
10. Santos, M. R. G.; Goulart, M. O. F.; Tonholo, J.; Zanta, C. L. P. S.;
Chemosphere2006, 64, 393.
11. Yavuz, Y.; Koparal, A. S.; Öğütveren, Ü. B.; Desalination2010,
258, 201.
12. Sun, Y.; Zhang, Y.; Quan, X.; Sep. Purif. Technol. 2008, 62, 565.
13. Bhargava, S. K.; Tardio, J.; Jani, H.; Akolekar, D. B.; Föger, K.; Hoang, M.; Catal. Surv. Asia2007, 11, 70.
14. Prasad, J.; Tardio, J.; Jani, H.; Bhargava, S. K.; Akolekar, D. B.; Grocott, S. C.; J. Hazard. Mater.2007, 146, 589.
15. Ismail, Z. Z.; Al-Hashimi, E. A.; J. Clean. Prod. 2011, 19, 197. 16. El-Salam, M. M.; El-Naggar, H. M.; J. Clean. Prod. 2010, 18,
1403.
17. Oliveira, K. D.; Cardoso, M.; Nicolato, R.; Lat. Am. Appl. Res. 2010, 40, 81.
18. De Feo, G.; Rizzo, L.; Belgiorno, V.; Meric, S.; Int. J. Environ. Pol. 2006, 28, 100.
19. Da Silva, C. R.; Maniero, M. G.; Rath, S.; Guimarães, J. R.;
J. Adv. Oxid. Technol. 2011, 14, 106.
20. Guimarães, J. R.; Santos, L. U.; Assalin, M.; Figueiredo, R. F.;
Rev. DAE2010, 184, 35.
21. American Public Health Association (APHA), American Water Works Association (AWWA), Water Environment Federation (WEF); Standard Methods for Examination of Water and Wastewater, 21th ed.; American Public Health Association:
Washington D.C., 1998.
22. ASTM D1293: Standard Test Methods for pH of Water, American Society for Testing and Materials, Philadelphia, 1999. 23. Nogueira, R. F. P.; Oliveira, M. C.; Paterlini, W. C.; Talanta
2005, 66, 86.
24. Abramovic, B. F.; Banic, N. D.; Šojic, D. V.; Chemosphere 2010, 81, 114.
25. Ghodbane, H.; Hamdaoui, O.; Chem. Eng. J.2010, 160, 226. 26. Silva, T. C. F.; Silva, C. M.; Reis, C.; Bellato, C. R.; Lucia, L. A.;
Ind. Eng. Chem.Res. 2010, 49, 11214.
27. Daneshvar, N.; Rabbani, M.; Modirshahla, N.; Behnajady, M. A.;
28. De Souza, D. R. D.; Duarte, E. T. F. M.; Girardi, G. D. S.; Velani, V.; Machado, A. E. D. H.; Sattler, C.; Oliveira, L. D.; Miranda, J. A. D.; J. Photochem. Photobiol., A 2006, 179, 269. 29. Maciel, R.; Sant’Anna Jr., G. L.; Dezotti, M.; Chemosphere
2004, 57, 711.
30. Domènech, X.; Jardim, W. F.; Litter, M. I. In Eliminación de Contaminantes por Fotocatálisis Heterogênea; Blesa, M. A., ed.; Red CYTED VIII-G: Buenos Aires, Argentina, 2001. 31. Mota, A. L. N.; Albuquerque, L. F.; Beltrame, L. T. C.;
Chiavone-Filho, O.; Machulek Jr., A.; Nascimento, C. A. O.;
Braz. J. Pet. Gas2008, 2, 122.
32. Padoley, K. V.; Mudliar, S. N.; Banerjee, S. K.; Deshmukh, S. C.; Pandey, R. A.; Chem. Eng. J. 2011, 166, 1.
33. Yang, M.; Hu, J.; Ito, K.; Environ. Technol. 1998, 19, 183.
34. Zang, Y.; Pagilla, K.; Desalination2010, 263, 36.
35. Saritha, P.; Aparna, C.; Himabindu, V.; Anjaneyulu, Y.;
J. Hazard. Mater. 2007, 149, 609.
36. Ghaly, M. Y.; Härtel, G.; Mayer, R.; Haseneder, R.; Waste Manage. 2001, 21, 41.
37. United States Environmental Protection Agency (US EPA);
Guidelines for Water Reuse; US Agency for International
Development: Washington D.C., September, 2004, http:// www.ehproject.org/PDF/ehkm/water-reuse2004.pdf accessed in August 2012.
38. Oenning Jr., A.; Pawlowsky, U.; Eng. Sanit. Ambient. 2007, 12,
305.
39. Tchobanoglous, G.; Burton, F. L.; Stensel, H. D.; Wastewater Engineering: Treatment and Reuse, 4th ed.; Metcalf & Eddy:
New York, 2003.
Submitted: May 31, 2012
Published online: August 30, 2012