Article
Printed in Brazil - ©2012 Sociedade Brasileira de Química0103 - 5053 $6.00+0.00
A
*e-mail: [email protected]
Adsorptive Stripping Voltammetry Determination of the Hormone Therapy
Raloxifene HCl in Formulation and Human Serum
Mohamed M. Ghoneim, Amera. M. Hassanein,* Nehal A. Salahuddin, Hanaa S. El-Desoky and Mona N. Elfiky
Chemistry Department, Faculty of Science, Tanta University, 31527 Tanta, Egypt
Raloxifeno HCl (RLX) adsorveu fortemente na superfície do eletrodo de mercúrio numa monocamada com cobertura superficial de 5,724 × 10−10 mol cm-2. Dois métodos voltamétricos de
redissolução catódico adsortivo com varredura linear e onda quadrada (LS-AdCSV e SW-AdCSV, respectivamente) precisos, rápidos e livres de extração são descritos para determinação em nível de traço de RLX em solução, em formulação comercial e soro humano. Limites de quantificação (LOQ) de 2,0 × 10⁻⁹ e 5,0 × 10⁻¹¹ mol L−1 de RLX em solução e 4,0 × 10⁻⁹ e 1,0×10⁻¹⁰ mol L−1
em soro humano enriquecido foram obtidos pelos métodos descritos LS-AdCSV e SW-AdCSV, respectivamente. Interferências de alguns excipientes comuns, íons metálicos e drogas coadministradas foram insignificantes. LOQ adquidos pelos métodos são baixos assim como oferecem boas possibilidades de determinação de drogas em preparações farmacológicas de baixa dosagem. Contudo, o método SW-AdCSV descrito é sensível suficiente em ensaios de drogas também em soro humano.
Raloxifene HCl (RLX) was found tostrongly adsorb onto surface of the mercury electrode in a monolayer surface coverage of 5.724 × 10⁻¹⁰ mol cm–2. Two precise, rapid and
extraction-free linear sweep and square wave adsorptive cathodic stripping voltammetry (LS-AdCSV and SW-AdCSV, respectively) methods are described for trace quantitation of RLX in bulk form, commercial formulation and human serum. Limits of quantification (LOQ) of 2.0 × 10⁻⁹ and
5.0 × 10⁻¹¹ mol L−1 RLX in bulk form and 4.0 × 10⁻⁹ and 1.0 × 10⁻¹⁰ mol L−1 RLX in spiked
human serum were achieved by the described LS-AdCSV and SW-AdCSV methods, respectively. Insignificant interferences from some common excipients, metal ions and co-administrated drugs were obtained. LOQ achieved by the methods are low as well as they offer good possibilities for determination of drug in low-dosage pharmaceutical preparations. However, the SW-AdCSV method described is sensitive enough to assay the drug also in human serum.
Keywords: raloxifene HCl, determination, stripping voltammetry
Introduction
Raloxifene hydrochloride (RLX) is a selective estrogen receptor modulator. It is a hormone therapy drug that is used for the prevention of osteoporosis and risk reduction of invasive breast cancer in postmenopausal women at high risk for developing invasive breast cancer or with osteoporosis.1-3
The drug reduces the rate of bone loss at both distal sites and in the spinal column and may increase bone mass at certain sites.4 Approximately 60% of RLX is rapidly
absorbed from the gastrointestinal tract. However, the mean absolute bioavailability is 2%.2-4 RLX is metabolized
by UDP-glucuronosyltransferases in the liver and the resulting glucuronides are excreted via the bile into the intestine.5 Following oral administration of a single dose
of 60-120 mg RLX,6-8 peak plasma concentration (C max) of
0.50 to 0.92 ng mL−1 was attained at 6 h (T
max). However,
a limit of quantification (LOQ) of 0.10 ng mL−1 RLX6,7 in
both males and postmenopausal females was reported.6,7
Va r i o u s a n a l y t i c a l m e t h o d s i n c l u d i n g high-performance liquid chromatography (HPLC),9-15
spectrophotometry16-24 and capillary electrophoresis25 have
been reported in the literature for the determination of RLX in bulk samples as well as pharmaceutical preparations. The HPLC methods reported9-15 necessitate sample
expensive equipment and considerable skills are necessary to operate them successfully. Besides, some of these HPLC methods require high strength ionic buffered mobile phases,11,14 which are hazardous for column efficiency and
need prolonged time for column saturation and washing. In addition, the sensitivity of the reported HPLC methods9-15
was low since they offer limits of quantification of 0.02 µg mL-1 to 4.04 mg mL-1. On the other hand, the
spectrophotometric methods reported for the assay of RLX were based on redox and complexation reactions for formation of colored chromogens prior to the analysis.16-24
Determination of RLX by these methods was also not sensitive enough (LOQ = 0.08 to 16.00 µg mL-1), complex,
or at least required time-consuming steps, which may lead to significant analytical errors. Determination of RLX in its formulations with a method based on measurement of the intensity of resonance Rayleigh scattering of the ion association complex of RLX with Evans blue was reported26 (LOQ = 60.0 ng mL-1) but it requires an
expensive instrumental set up. On the other side, liquid chromatography-tandem mass spectrometry (LC-MS/MS) has been successfully applied for determination of RXL in human urine (LOQ = 0.515 to 20.0 ng mL-1)27,28 and in human
plasma (LOQ = 20.00 ng L-1).29 However, LC-MS/MS
methods involve expensive solid phase extraction steps prior to the analysis which are time-consuming and not economically feasible for routine analysis (as such equipment and techniques are not available in most of the laboratories). Moreover, most of the methods reported9-28
are considered not efficient enough for the assay of RLX in human plasma and at different therapeutic dose levels for pharmacokinetic studies as well as therapeutic drug monitoring. Therefore, a simple and sensitive procedure is desired for determination of RLX in human plasma.
Stripping voltammetry is an extremely sensitive electrochemical technique that utilizes a non-electrolytic preconcentration (accumulation) step for trace determination of a wide range of drugs in different matrices. The combination of a preconcentration step with the advanced voltammetric measurement generates the extremely favorable signal-to-background ratio that characterizes stripping voltammetric analysis.30
To our knowledge, cathodic adsorptive stripping voltammetry technique utilizing hanging mercury dropping electrode (HMDE) has not been reported yet for assay of RLX. So, the present work aimed to study the electrochemical behavior of RLX at HMDE and to describe validated simple, sensitive, fast and precise stripping voltammetry methods for its trace determination in various matrices without sample pretreatment, extraction or formation of colored chromogens prior to the analysis.
Compared to solid electrode materials, mercury is a very attractive choice of material because it has a high hydrogen overvoltage that greatly extends the cathodic potential window up to ca. −2.0 V, and possesses a highly
reproducible, readily renewable and smooth surface. Although, the use of mercury electrode has been recently discouraged mainly due to environmental reasons, it is used in the present work because of its high hydrogen overvoltage which facilitates the study of electroreduction of substances of very negative reduction potentials in aqueous electrolyte (e.g., C=O group in the examined RLX molecule).
Experimental
Equipments
Computer-controlled electrochemical analyzers models 263A and 394-PAR (Princeton Applied Research, Oak Ridge, TN, USA) with the software package 270/250-PAR were used for the voltammetric measurements. An electrode assembly (303A-PAR) incorporated with a micro-electrochemical cell and a three-electrode system, comprising of a hanging mercury drop electrode (HMDE) as working electrode (surface area = 0.026 cm2),
Ag/AgCl/KCls as reference electrode and platinum wire
as auxiliary electrode, were used. A magnetic stirrer (305-PAR) was used to provide the convective transport during the accumulation step.
Materials and solutions
A stock standard solution of 1.0 × 10⁻³ mol L−1 bulk
Raloxifene hydrochloride (RLX), [6-hydroxy-2-(4-hydroxyphenyl)benzo[b]thien-3-yl]-[4-[2-(1-piperidinyl) ethoxy]phenyl]methanone hydrochloride (Eli Lilly Company, Indianapolis, USA) was purchased from Sigma-Aldrich, prepared in methanol (Merck), and then stored at 4 °C. Working solutions of RLX (1.0 × 10⁻⁸ to
1.0 × 10⁻⁴ mol L−1) were daily prepared by appropriate
dilution with methanol just before use.
Twenty Evista® tablets (Eli Lilly Company, Indianapolis,
0.45 µm Millipore filter (Gelman, Germany). The desired concentrations of RLX were obtained by accurate dilution with methanol.
Six serum samples of three healthy subjects (two samples from each subject) were stored frozen until assay. Into each of 10 centrifugation tubes (3.0 mL volume polypropylene microcentrifuge tubes) containing a certain concentration of RLX (1.0 × 10⁻⁸ to 1.0 × 10⁻⁴ mol L−1),
1.0 mL volume of the human serum was transferred, and then mixed well with 1.0 mL of methanol to denaturate and precipitate proteins. The solutions were centrifuged (using an Eppendorf centrifuge 5417C, Hamburg, Germany) for 3 min at 14000 rpm to separate out the precipitated proteins. The clear supernatant layers of the solutions were filtered through 0.45 µm Millipore filters to produce protein-free human serum samples spiked with various concentrations of RLX (1.0 × 10⁻⁸ to 1.0 × 10⁻⁴ mol L−1).
A set of Britton-Robinson (B-R) universal buffers at pH 2.0 to 11.5, a mixture of 0.04 mol L−1 solution of
each of acetic, orthophosphoric and boric acids adjusted to the required pH with 0.20 mol L−1 sodium hydroxide
solution31 as supporting electrolytes were prepared. A
pH-meter (Crison, Barcelona, Spain) was used for the pH measurements. Deionized water was supplied from a Purite-Still Plus deionizer connected to an AquaMatic double-distillation water system (Hamilton Laboratory Glass LTD, Kent, UK).
General analytical procedure
A known volume of the analyte solution was pipetted into 10.0 mL volume calibrated flask and then filled up with the B-R universal buffer at pH 5. This solution was quantitatively introduced into the electrolysis cell, and then deoxygenated with pure nitrogen gas (99.99 % ) for about 5 min in the first cycle and for 50 s in each successive cycle, while a stream of nitrogen gas was kept over the solution during the measurements. In stripping voltammetric analysis, preconcentration of RLX onto the surface of HDME was performed by adsorptive accumulation at –0.7 V (vs. Ag/AgCl/KCls) for 300 s while stirring the solution
at 400 rpm. After equilibrium time of 5 s allowed for the solution to become quiescent, the voltammograms were recorded by scanning the potential towards negative direction using linear sweep or square-wave potential waveforms.
The mean recovery (%R) for the found concentrations was calculated as a percent of the nominal concentrations in the standard solutions. Accuracy was expressed as a relative error [RE% = (CFound /CTaken) – 1) × 100] while precision
was assessed from the relative standard deviation (RSD %) of the mean recovery.
Results and Discussion
Cyclic voltammetric studies
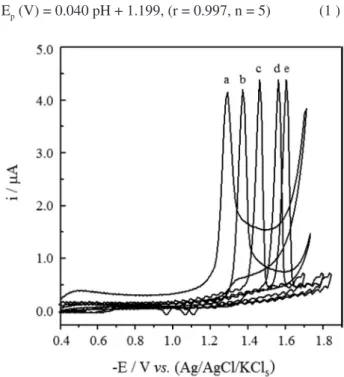
Cyclic voltammograms of 1.0 × 10⁻⁴ mol L−1 RLX
in the B-R universal buffer at pH (2.0 to 10.0) exhibited a single irreversible cathodic peak attributed to the reduction of its C=O double bond via the consumption of two electrons (Figure 1). The absence of any peak on the reverse scan indicated the irreversible nature of the electrode reaction of RLX. The peak potential Ep (V)
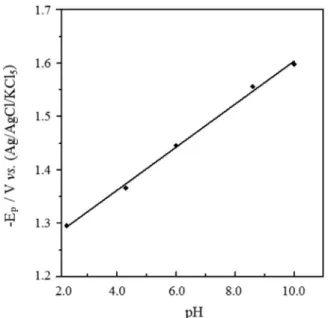
shifted towards more negative values upon the increase of pH of the medium confirming the involvement of protons in the electrode reaction and that the proton-transfer precedes the electron-transfer process.32 Rectilinear plot
of the peak potential Ep (V) vs. pH was obtained (Figure
2), its corresponding regression equation (with coefficient of correlation, r) was:
Ep (V) = 0.040 pH + 1.199, (r = 0.997, n = 5) (1 )
The irreversible nature of the electrode reaction was also identified at different pH values from the shift of peak potential Ep (V)to more negative values upon the increase
of scan rate ν (25 to 500 mV s–1).35 Plots of E
p (V) at
different pH values vs. ln ν were linear, its corresponding regression equation was:
Ep (V) = (0.012 to 0.013) ln ν (mV s
−1) + (1.237 to 1.520),
According to Nicholson et al.36 and Greef et al.,37 values
of αna (product of symmetry transfer coefficient α and
number of electrons na transferred in the rate-determining
step) of 0.988 to 1.070 were estimated from slope values of the obtained Epvs. ln ν plots:
(3)
The most probable value of the transfer coefficient α
(0.494 to 0.535) was estimated at various pH values, for the number of electrons na transferred in the rate-determining
step for the electroreduction of the >C=O double bond of the analyte equals 2.32 The estimated value of the transfer
coefficient αindicates the symmetry of the energy barrier
in such an irreversible reduction process.
The number of protons (p) involved in the rate-determining step was consequently estimated from the slope value of the Ep vs. pH plot using the following
relation:38
(4)
and was found to equal 0.67 - 0.73 (i.e., p ca. 1).
On other side, according to Randles-Sevcik equation for irreversible process,35,37,39
ip = (2.99 × 10 5) n (αn
a)
1/2 A C0 D1/2ν1/2 (5)
the peak current ip is proportional to the square root
of scan rate ν1/2 (semi-infinite diffusion), while for an
adsorption-controlled reaction,35,40 the peak current i p is
proportional to the applied scan rate v (thin layer behavior) according to the following equation:35
(6)
where na is the number of electron transfer in the
rate-determining step, A (cm2) is the surface area of the
working electrode, D (cm2 s−1) is the diffusion coefficient,
C0 (mol cm−3) is the bulk concentration of analyte, n is
the total number of electrons consumed in the reduction process and Γ0 (mol cm−2) is the amount of analyte adsorbed
onto surface of the electrode. Linear plots of ip (µA) vs. scan
rate ν (V s–1) were obtained at different pH values with slope
values of 8.50 to 9.44 µA V–1 s (r = 0.998 ± 0.001, n = 5).
The peak current ip was proportional to ν indicating that
the reduction process of RLX at HMDE is controlled by adsorption.35,40
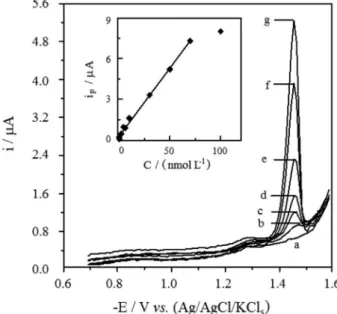
The adsorptive affinity of RLX onto the HMDE surface was also designated by recording the cyclic voltammograms of 5.0 × 10⁻⁶ mol L−1 RLX at 200 mV s–1 in the B-R
universal buffer of pH 5 following its preconcentration by adsorptive accumulation onto the HMDE under open circuit conditions (Figure 3, curve a), and then at Eacc= –0.7 V (vs. Ag/AgCl/KCls) for 50 s (Figure 3,
1st cycle, curve b and 2nd cycle, curve c). As shown in
Figure 3, an enhanced peak current magnitude was observed following preconcentration of the analyte by adsorptive accumulation onto the HMDE (1st
cycle, curve b). Whereas, in the 2nd cycle (curve c)
the voltammogram exhibited very small peak current compared to that of the 1st cycle (curve b), which may
be attributed to desorption of RLX from the mercury electrode surface.
Moreover, according to equation 6, log ip (µA) vs.
log ν (mV s–1) plot was a straight line; its corresponding
regression equation was:
log ip (µA) = 0.992 ± 0.005 log ν (mV s
–1) –1.894 ± 0.003,
(r = 0.999 ± 0.002, n = 5) (7)
The slope value (0.992 µA mV–1 s) is very close to
the expected theoretical value 1.0 for an ideal reaction of surface species.40 This indicates again the strong adsorptive
behavior of RLX onto the mercury electrode surface. Furthermore, the electrode surface coverage (Γ0, mol cm−2) of RLX in the B-R universal buffer at pH
5 was estimated using the equation Γ0 = Q/nFA, where
Q (C) is the charge consumed by the surface process which estimated by the integration of the area under the Figure 2. Epvs. pH plot for 1.0 × 10⁻⁴ mol L−1 RLX, at scan rate of
peak corrected to the residual current, n is the number of electrons consumed in the reduction of >C=O group to the >CHOH via the consumption of 2 electrons (n = 2), F is the Faraday constant (96487 C) and A is the surface area of the working electrode (0.026 cm2). On dividing
the amount of charge (Q) consumed by the surface process (2.872 × 10⁻⁶ C) by the conversion factor nFA
(5017.324 mol C cm–2), a monolayer surface coverage of
5.724 × 10⁻¹⁰ mol cm−2 was estimated. Each adsorbed RLX
molecule thus occupied an area of 0.29 nm2.
On the other hand, as reported in the literature, the probable much stable and favored structure of RLX.HCl molecule is that in which a proton is attached to the N atom, forming an ion-pair structure (RLX.H+) Cl−,7,14,21,41-43
(Scheme 1). This was attributed to the high electron density at the hetero N atom that was confirmed by the molecular orbital calculations reported in the literature for RLX and some related molecules.42,43 Moreover, RLX
possesses three pKa values reported as 8.95, 9.83 and
10.91.41,43 However, in this study, the constancy of the
slope of Ep vs. pH plot may be attributed to the very
close reduction peak potentials of the protonated and unprotonated forms (acid and base forms) of RLX. Thus, in the acidic media (pH values < 7), cationic form was expected to be predominant (pKa1 of 8.95 is attributed to
the dissociation of protonated basic nitrogen). While, in strong basic solutions (pH values > 11), both hydroxyl groups of RLX are dissociated (pKa2 9.83 and pKa3 10.91)
resulting doubly charged anion, while the base nitrogen would be uncharged.41
Based on the foregoing results, the electroreduction reaction of the >C=O double bond of both the acidic (I) and the basic (IV) forms of RLX at the mercury electrode in solutions at pH values < 7.0 and pH > 11.0, respectively, can be expressed as shown in Scheme 2. However, in solutions at intermediate pH values 7.0-11.0, RLX molecule is expected to present in three acid-base equilibriums, (I-II), (II-III) and (III-IV) (Scheme 2), or in zwitterions by simultaneously possessing both anionic and cationic structural moieties.41 The acidic and basic forms (I-IV) are
electroactive as indicated by relative similar values of the peak current over the pH range. Thus, their reduction over the pH range 7.0-11.0 takes place via one cathodic step as their limiting currents overlapped.
Analytical studies
Stripping voltammetry analytical methods
Linear sweep (LS) and square-wave (SW) adsorptive cathodic stripping voltammetry (AdCSV) methods were optimized here for trace quantification of RLX.
Effect of pH of the medium
This was carried out by recording voltammograms of 5.0 × 10⁻⁷ mol L−1 bulk RLX at HMDE in B-R universal
buffers at various pH values (2.0-10.0) following its preconcentration onto the HMDE by adsorptive accumulation at −0.7 V for 50 s using both linear-sweep and square wave potential-waveforms. The voltammograms exhibited a single cathodic peak over the entire pH range due to the reduction of >C=O group. A sharp and better enhanced peak current was achieved in buffered solutions of pH 4 to 6. Therefore, a B-R buffer of pH 5 was chosen as a supporting electrolyte for the rest of the present analytical study.
Effect of instrumental parameters
Optimizations of the scan rate ν (20 to 100 mV s−1) and
pulse-parameters (frequency f = 10 to 120 Hz, scan increment Figure 3. Cyclic voltammograms of 5.0 × 10⁻⁶ mol L−1 RLX in the B-R
universal buffer at pH 5 recorded following preconcentration onto the HMDE by adsorptive accumulation at open circuit conditions (a) and at Eacc = –0.7 V (1st cycle (b), and 2nd cycle (c)) for 50 s, at scan rate of 200 mV s–1.
Scheme 2. Electrode reaction of RLX at the mercury electrode.
∆Es = 2 to 12 mV and pulse-height a = 5 to 30 mV) on the
peak current response were attempted by LS-AdCSV and SW-AdCSV, respectively, in B-R universal buffer at pH 5. This was carried for 5.0 × 10⁻⁷ mol L−1 RLX, following
its preconcentration onto the HMDE by adsorptive accumulation at Eacc = −0.7 V for 50 s. Well-defined
LS-AdCSV and SW-AdCSV peak currents were achieved at scan rate ν of 100 mV s−1 and at pulse-parameters of:
f = 90 Hz, ∆Es = 10 mV and a = 25 mV, respectively.
Effect of preconcentration conditions
Voltammograms of 1.0 × 10⁻⁷ mol L−1 RLX in the
B-R universal buffer at pH 5 were recorded using linear-sweep and square-wave potential-waveforms following preconcentration by adsorptive accumulation onto the HMDE for 50 s at various accumulation potentials Eacc
to the more favorable alignment of the molecules by the electric field at the electrode solution interface.44,45
However at more negative potentials, the peak current decreased indicating that the reactant species were no longer strongly adsorbed at potentials where the mercury is negatively charged with respect to the point of zero charge potential.46 Therefore, a preconcentration potential
of −0.7 V (vs. Ag/AgCl/KCls) was chosen for the rest of
the present analytical study.
On the other hand, the dependence of LS-AdCSV and SW-AdCSV peak current magnitudes of 5.0 × 10⁻⁷ and
5.0 × 10⁻⁸ mol L−1 RLX in the B-R universal buffer at
pH 5 on the preconcentration time (tacc) of the analyte at
Eacc = −0.7 V was studied. For 5.0 × 10
−7 mol L−1 bulk
RLX, the response was linear up to 110 s then leveled off, indicating that the adsorptive equilibrium onto the mercury electrode surface was achieved,46 i.e., full surface
coverage was approached. While for 5.0 × 10⁻⁸ mol L−1
RLX as the preconcentration time was increased, linearity was prevailed over the tested preconcentration time. Thus, the preconcentration time of choice will be dictated by the sensitivity needed. In the present analytical investigations, preconcentration time of 300 s was applied to avoid the achievement of saturation of the electrode surface.
Accordingly, the optimum instrumental conditions of the described LS-AdCSV and SW-AdCSV methods were: scan rate ν of 100 mV s−1 (for LS-AdCSV) and
pulse-parameters of: f = 90 Hz, ∆E
s = 10 mV and a = 25 mV
(for SW-AdCSV). Besides, the optimal preconcentration conditions for both methods were: Eacc= −0.70 V
(vs. Ag/AgCl/KCls) and tacc.= 300 s using the B-R universal
buffer at pH 5 as a supporting electrolyte.
Methods validation
Validation schemes of the analytical methods for the determination of various analytes are defined in ICH (International Conference on Harmonization) guidelines and some pharmacopoeias such as United States (USP) or European (EP) Pharmacopoeias. Most of the validation scheme described in ICH guidelines47 and USP48 was applied in the present work
for validation (via linearity, repeatability, reproducibility, precision, accuracy, selectivity and robustness)47,48 of the
described stripping voltammetry methods for assay of bulk RLX.
Voltammograms of various concentrations of RLX were recorded under the optimized operational conditions of the developed stripping voltammetry methods. Linear variations of the peak currents ip (µA) with concentrations
C (nmol L−1) of bulk RLX were obtained by the described
LS-AdCSV and SW-AdCSV methods, the corresponding regression equations were:
LS-AdCSV:
ip (µA) = 2.90 × 10⁻³ ± 0.74 × 10⁻⁶ C (nmol L-1) +
0.063 ±5.80 × 10⁻⁴ (8)
SW-AdCSV:
ip (µA) = 100.30 × 10⁻³ ± 1.22 × 10⁻⁶ C (nmol L-1) +
0.270 ± 5.00 × 10⁻⁴ (9)
Characteristics of the calibration curves and the achieved limits of detection (LOD) and quantitation (LOQ) by means of the developed stripping voltammetric methods are reported in Table 1. LOD and LOQ of bulk RLX were estimated using the expressions:49
LOD = 3 SD/b and LOQ = 10 SD/b (10)
where SD is the standard deviation of the intercept of the calibration curve (or the blank) and b is the slope of the calibration curve. The results shown in Table 1 indicated the reliability of the developed stripping voltammetric methods for quantification of bulk RLX. However, the described SW-AdCSV method is much more sensitive.
Repeatability, reproducibility, precision and accuracy47,48
of the described LS-AdCSV and SW-AdCSV methods were evaluated by performing five replicate measurements for various concentrations of bulk RLX (5.0 × 10⁻⁹,
1.0 × 10⁻⁸ and 5.0 × 10⁻⁸ mol L−1) over 1 day (intra-day
assay) and for 3 days (inter-day assay). Some of the results obtained by the methods are summarized in Table 2. Insignificant differences were observed between the amounts of RLX taken and found. Satisfactory mean recoveries, relative standard deviations and relative errors were achieved indicating the repeatability, reproducibility, precision and accuracy of the methods for assay of RLX within the linearity range of each of described method.
The robustness47,48 of the developed stripping
voltammetric methods was examined by studying the effect of variation of some of the neck operational conditions such as pH (4.5 to 5.5), preconcentration potential (−0.65 to −0.75 V) and preconcentration time (295 to 305 s) on mean percentage recovery (% R) and relative standard deviation (% RSD) of different concentrations (1.0 × 10⁻⁹
to 1.0 × 10⁻⁸ mol L−1) of bulk RLX. The obtained mean
insignificantly affected, the developed adsorptive stripping voltammetric methods are reliable for quantitation of RLX and could be considered robust.
The inter-laboratory precision47,48 was also examined
for analysis of different concentrations (1.0 × 10⁻⁹ to
5.0 × 10⁻⁸ mol L−1) of RLX by means of the described
LS-AdCSV and SW-AdCSV methods using two potentiostats (PAR) models 263A (Lab 1) and 394 (Lab 2) at different elapsed time by two different analysts. The obtained mean recoveries (98.08 ± 0.98 to 98.63 ± 0.63%) were found reproducible.
Interference from excipients and co-formulated substances usually used with various pharmaceutical preparations47,48 was also examined. This was performed
by analysis of various concentrations of RLX solutions (1.0 × 10⁻¹⁰ to 5.0 × 10⁻⁸ mol L−1) by means of each of
the developed stripping voltammetric methods in the absence and presence of such common excipients or co-formulated substances (e.g., lactose, starch, gelatin, talc, magnesium stearate, crospovidone, FD and C blue No. 2 aluminum lake, hypromellose, lactose monohydrate, modified pharmaceutical glaze, polyethylene glycol, polysorbate 80, povidone, propylene glycol and titanium dioxide) usually used in the pharmaceutical preparations. The mean percentage recoveries and the relative standard deviations (%R ± RSD) obtained by mean of the developed methods were (98.59 ± 1.43 to 99.3± 1.56%) and (98.2 ± 2.82 to 99.89 ± 1.58%) in the absence and presence of such components, respectively. Hence, the proposed methods were found to be free from interference by the excipients or co-formulated substances in the level found in RLX dosage forms.
Table 1. Characteristics of the calibration curves of LS-AdCS and SW-AdCS voltammetric determination of RLX in bulk form and in pharmaceutical preparation (Evista® tablets) in a B-R universal buffer at pH 5;t
acc. = 300 s, Eacc. = –0.7 V, f= 90 Hz, ∆Es= 10 mV anda = 25 mV, at 25 oC
Method Linearity range / (mol L-1)
r LOD / (mol L-1) LOQ / (mol L-1)
Bulk form
LS-AdCSV SW-AdCSV
2.0 × 10⁻⁹ - 1.0 × 10⁻⁷ 5.0 × 10⁻¹¹ - 7.0 × 10⁻⁸
0.995 0.997
6.0 × 10⁻¹⁰ 1.5 × 10⁻¹¹
2.0 × 10⁻⁹ 5.0 × 10⁻¹¹
Evista® tablets
LS-AdCSV SW-AdCSV
2.0 × 10⁻⁹ - 9.5 × 10⁻⁸ 5.0 × 10⁻¹¹ - 7.5 × 10⁻⁸
0.994 0.996
6.0 × 10⁻¹⁰ 1.5 × 10⁻¹¹
2.0 × 10⁻⁹ 5.0 × 10⁻¹¹
LOD: limit of detection; LOQ: limit of quantification; r: coefficient of correlation.
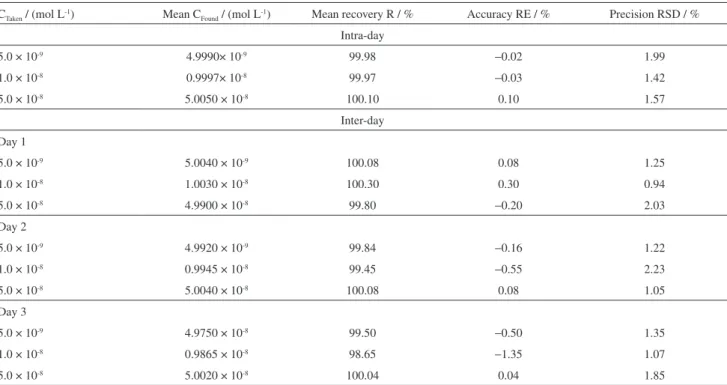
Table 2. Representative results of intra-day and inter-day assays of various concentrations of bulk RLX by means of the described SW-AdCSV method (n = 5)
CTaken / (mol L-1) Mean C
Found / (mol L-1) Mean recovery R / % Accuracy RE / % Precision RSD / %
Intra-day
5.0 × 10⁻⁹ 4.9990× 10⁻⁹ 99.98 −0.02 1.99
1.0 × 10⁻⁸ 0.9997× 10⁻⁸ 99.97 −0.03 1.42
5.0 × 10⁻⁸ 5.0050 × 10⁻⁸ 100.10 0.10 1.57
Inter-day
Day 1
5.0 × 10⁻⁹ 5.0040 × 10⁻⁹ 100.08 0.08 1.25
1.0 × 10⁻⁸ 1.0030 × 10⁻⁸ 100.30 0.30 0.94
5.0 × 10⁻⁸ 4.9900 × 10⁻⁸ 99.80 −0.20 2.03
Day 2
5.0 × 10⁻⁹ 4.9920 × 10⁻⁹ 99.84 −0.16 1.22
1.0 × 10⁻⁸ 0.9945 × 10⁻⁸ 99.45 −0.55 2.23
5.0 × 10⁻⁸ 5.0040 × 10⁻⁸ 100.08 0.08 1.05
Day 3
5.0 × 10⁻⁹ 4.9750 × 10⁻⁸ 99.50 −0.50 1.35
1.0 × 10⁻⁸ 0.9865 × 10⁻⁸ 98.65 −1.35 1.07
5.0 × 10⁻⁸ 5.0020 × 10⁻⁸ 100.04 0.04 1.85
Application
Assay of RLX in commercial formulation
The developed LS-AdCSV and SW-AdCSV stripping voltammetric methods were successfully applied for quantification of various concentrations of RLX in Evista®
tablets without the necessity for samples pretreatment and/or time-consuming extraction steps prior to the analysis using the calibration curve method (Figures 4 and 5). Linear calibration curves were obtained by the described LS-AdCSV and SW-AdCSV methods, the corresponding regression equations were:
LS-AdCSV:
ip (µA) = 2.88 × 10⁻³ ± 0.69 × 10⁻⁶ C (nmol L-1) +
0.068 ± 5.87 × 10⁻⁴ (11)
SW-AdCSV:
ip (µA) = 100.32 × 10⁻³ ± 1.10 × 10⁻⁶ C (nmol L-1) +
0.274 ± 5.05 × 10⁻⁴ (12)
Insignificant differences between the slopes of the calibration curves for analysis of the bulk (equations 8 and 9) and tablet (equations 11 and 12) solutions were observed. The validity of the methods was further assessed by applying the standard addition50 for three
different standard RLX solutions added to pre-analyzed tablet solutions. Recovery of the pure drug added was in the range 99.46-100.22%, with the RSD values of 0.84-0.92%.
The satisfactory results obtained by means of the developed adsorptive stripping voltammetric methods using both the calibration curve and standard addition methods (Table 3) were statistically compared with those of the official USP LC method51 and the HPLC reference method14 by applying
Student’s t-test for accuracy and variance ratio F-test for precision at 95% confidence level.52 As shown by the
results compiled in Table 3, the calculated t- and F-values did not exceed the tabulated values at the 95% confidence level for five degrees of freedom, suggesting that the developed methods, the official USP LC51 and the reference
HPLC14 methods did not differ significantly with respect
to accuracy and precision.52 Hence, both the developed
LS-AdCSV and SW-AdCSV methods were found to be sensitive, accurate, precise, repeatable, reproducible and can be successfully used for the routine analysis of RLX in bulk drug and in formulations.
Assay of RLX in spiked human serum
A quantitative assay of RLX spiked in 6 human serum samples of 3 healthy subjects was carried out successfully by the LS-AdCSV and SW-AdCSV methods without the necessity for sample pretreatment and/or time-consuming extraction steps prior to the analysis.
LS-AdCS and SW-AdCS voltammograms of various concentrations of RLX in spiked human serum samples were recorded (e.g., Figure 6) under the optimized operational conditions (Eacc = −0.7 V and tacc = 300 s).
No interfering peak from endogenous human serum Figure 4. Representative LS-AdCS voltammograms at HMDE in the
B-R universal buffer at pH 5 for various concentrations of RLX in its formulation (Evista® tabets): (a) background, (b) 4.0 × 10⁻⁹, (c) 8.0 × 10⁻⁹, (d) 1.0 × 10⁻⁸, (e) 4.0 × 10⁻⁸, (f) 8.0 × 10⁻⁸ and (g) 1.0 × 10⁻⁷ mol L−1. Inset is its corresponding calibration plot; tacc = 300 s and Eacc = −0.7 V.
Table 3. Assay of standard solutions of RLX (5.0 × 10⁻⁸ mol L-1 RLX) in its formulation (Evista® tabets) by the described stripping voltammetric methods in comparison to the official USP LC51 and the reference HPLC methods14
CFound / (mol L-1) LS-AdCSV SW-AdCSV
(A) (B) (A) (B)
4.9954 5.0924 5.1067 4.8993
5.1879 4.9878 4.9900 4.9978
4.9998 4.9788 5.1012 4.9884
5.1079 4.9994 4.9913 4.9999
5.0291 4.9972 5.0084 4.9800
Mean CFound± SD / (mol L-1) 5.0640 ± 0.083 5.0111 ± 0.046 5.0395 ± 0.059 4.9731 ± 0.042
Mean recovery ± RSD / % 101.28 ± 1.64 100.22 ± 0.92 100.17 ± 1.17 99.46 ± 0.84
Official USP LC method51
Mean recovery ± RSD / % 100.35 ± 0.98 100.78 ± 1.08
F-value 2.80 1.38 1.43 1.65
t-test 1.09 0.79 0.26 2.16
HPLC reference method14
Mean recovery ± RSD / % 100.80 ± 1.30 99.80 ± 1.20
F-value 1.59 1.70 1.23 2.04
t-test 0.51 0.62 0.81 0.52
(A) Calibration curve method; (B) standard addition method; theoretical F-value = 6.39 and t-test = 2.77 at 95% confidence limit for n1 = 5 and n2 = 5; SD: standard deviation; RSD: relative standard deviation.
constituents was observed in the blank human serum within the studied potential range (e.g., Figure 6; curve a). Linear variation of the peak currents ip (µA) of LS-AdCSV and
SW-AdCSV with concentrations C (nmol L−1) of RLX
in the spiked human serum samples were obtained
(e.g., inset of Figure 6). Characteristics of some of the obtained calibration plots for the samples investigated are reported in Table 4. Average LOQ of 4.0 × 10⁻⁹ and
1.0 × 10⁻¹⁰ mol L−1 RLX in spiked human serum were
achieved by the optimized LS-AdCSV and SW-AdCSV methods, respectively. Moreover, satisfactory mean recoveries (98.87 to 100.34%) and low relative standard deviations (RSD 0.33 to 1.52%) of various concentrations of RLX in spiked human serum samples were obtained. This indicated insignificant difference between the spiked and the detected amounts of RLX in human serum samples and consequently, no interference from endogenous human serum constituents. Moreover, interferences from some foreign species such as Ca2+, Mg2+, Al3+, Cd2+, Fe3+,
Cu2+, Na+, K+, glucose, valine, phenylalanine and some
typical co-administered drugs (such as vitamins (C and E), paracetamol, aspirin, ibuprofen, terfenadine, phenytoin and tamoxifen) on analysis of 1.0 × 10⁻⁸ mol L−1 RLX spiked
in human serum were identified by means of the described LS-AdCS and SW-AdCS voltammetric methods (e.g., Table 5). Results of the tolerance levels of each of the investigated species reported in Table 5 indicated that none of these substances was found to interfere with analysis of RLX.
Therefore, both the described voltammetric methods can be successfully applied to assay of RLX in biological fluids without interferences from foreign organic and inorganic species. But, because of the typical plasma Figure 6. Representative SW-AdCS voltammograms at HMDE in the
Table 4. Characteristics of the calibration curves of LS-AdCS and SW-AdCS voltammetric determination of RLX in spiking human serum samples of three subjects (two samples of each subject were analyzed) in a B-R universal buffer at pH 5;tacc. = 300 s, Eacc. = – 0.7 V, f= 90 Hz, ∆Es= 10 mV and a = 25 mV, at 25 oC
Method Linearity range /
(mol L-1)
Regression equation
ip (µA) = (b ± SD) C (nmol L-1) + (a ± SD) r
LOD / (mol L-1)
LOQ / (mol L-1)
Subject 1
LS-AdCSV SW-AdCSV
4.0 × 10⁻⁹ - 1.0 × 10⁻⁷ 1.0 × 10⁻¹⁰ - 1.0 × 10⁻⁸
ip = 1.75 × 10⁻³ ± 0.14 × 10⁻⁶ C + 0.043 ± 7.00 × 10⁻⁴ ip = 44.75 × 10⁻³ ± 0.58 × 10⁻⁶ C + 0.098 ± 4.65 × 10⁻⁴
0.997 0.996
1.2 × 10⁻⁹ 3.0 × 10⁻¹¹
4.0 × 10⁻⁹ 1.0 × 10⁻¹⁰
Subject 2
LS-AdCSV SW-AdCSV
4.0 × 10⁻⁹ - 1.5 × 10⁻⁷ 1.0 × 10⁻¹⁰ - 2.0 × 10⁻⁸
ip = 1.77 × 10⁻³ ± 0.19 × 10⁻⁶ C + 0.041 ± 7.10 × 10⁻⁴ ip = 44.98 × 10⁻³ ± 0.87 × 10⁻⁶ C + 0.088 ± 4.70 × 10⁻⁴
0.997 0.996
1.2 × 10⁻⁹ 3.0 × 10⁻¹¹
4.0 × 10⁻⁹ 1.0 × 10⁻¹⁰
Subject 3
LS-AdCSV SW-AdCSV
4.0 × 10⁻⁹ - 2.0 × 10⁻⁷ 1.0 × 10⁻¹⁰ - 1.5 × 10⁻⁸
ip = 1.76 × 10⁻³ ± 0.22 × 10⁻⁶ C + 0.042 ± 7.08 × 10⁻⁴ ip = 44.68 × 10⁻³ ± 0.42 × 10⁻⁶ C + 0.102 ± 4.50 × 10⁻⁴
0.997 0.996
1.2 × 10⁻⁹ 3.0 × 10⁻¹¹
4.0 × 10⁻⁹ 1.0 × 10⁻¹⁰
SD: standard deviation; LOD: limit of detection; LOQ: limit of quantification; r: coefficient of correlation.
Table 5. Interferences from foreign species on analysis of 1.0 × 10⁻⁸ mol L-1 RLX by the described SW-AdCS voltammetric method
Foreign species Tolerance level
a /
(mol L-1)
Ca2+, Mg2+, Al3+, Cd2+, Fe3+ and Cu2+ 5.0 × 10⁻⁴
Na+ and K+ 1.0 × 10⁻²
Glucose, valine and phenylalanine 2.0 × 10⁻⁴
Vitamins (C and E), paracetamol, aspirin, ibuprofen and terfenadine
1.0 × 10⁻⁴
Phenytoin and tamoxifen 8.0 × 10⁻⁵
aFor 5% signal error.
stripping voltammetry methods (LS-AdCSV and SW-AdCSV) were described for the determination of RLX in bulk form and pharmaceutical formulations. The two methods are much more sensitive compared to the reported methods9-26 for determination of RLX. Moreover,
both methods are free from such experimental variables as heating, extraction step, reduction, oxidation or complexation reactions for formation of colored chromogens prior to the analysis. Furthermore, the described LS-AdCSV and SW-AdCSV methods rely also on the use of simple and cheaper chemicals and equipments for determination of RLX compared to the reported, sophisticated, expensive, and may be complicated techniques.9-29
Acknowledgements
M. M. Ghoneim expresses his gratitude to the Alexander von Humboldt Foundation (Bonn, Germany) for donating the electrochemical analyzer (263A-PAR) and the Eppendorf centrifuge used in this work.
References
1. Hernández, E.; Valera, R.; Alonzo, E.; Bajares-Lilue, M.; Carlini, R.; Capriles, F.; Martinis, R.; Bellorin-Font, E.; Weisinger, J. R.; Kidney Int.2003, 63, 2269.
2. Eli Lilly and Co., Evista (Raloxifene hydrochloride) tablet [product information], Indianapolis, 2008.
3. FDA Approves New Uses for Evista, September 14, 2007, U.S. Food and Drug Administration, Page Last Updated: 03/02/2010 4. Moen, M. D.; Keating, G. M.; Drugs2008, 68, 2059. 5. Morello, K. C.; Wurz, G. T.; DeGregorio, M. W.; Clin.
Pharmacokinet.2003, 42, 361.
6. Czock, D.; Keller, F.; Heringa, M.; Rasche, F. M.; Br. J. Clin. Pharmacol. 2005, 59, 479.
concentration reported in literature for healthy subjects following administration of a single oral dose of two tablets (60 mg each) RLX was in the range 0.10 to 0.92 ng mL-1 (1.96 × 10⁻¹⁰ to 1.79 × 10⁻⁹ mol L−1),6,7 the
developed LS-AdCSV method (LOQ = 4.0 × 10⁻⁹ mol L−1)
as well as all the reported methods (LOQ = 7.90 × 10⁻³ -
1.01 × 10⁻⁹ mol L−1)9-28 except LC-MS/MS method
(LOQ = 3.92 × 10⁻¹¹ mol L−1)29 are considered not efficient
enough for the assay of RLX in human plasma and at different therapeutic dose levels for pharmacokinetic studies as well as therapeutic drug monitoring. However, all the results achieved in this work indicated that the described SW-AdCSV method is reliable and sensitive enough (LOQ = 1.0 × 10⁻¹⁰ mol L−1) for assay of RLX in
human plasma of real samples and for pharmacokinetic studies and can be recommended for quantification of RLX in quality control and clinical laboratories.
Conclusions
7. Center for Drug Evaluation and Research, Clinical Pharmacology and Biopharmaceutics Review, Application
No. 020815, Indianápolis, October 1997.
8. Evista (Raloxifene), Drug information, Reviews at RxList, USA, Last reviewed on RxList: 10/2/2007, Copyright © 2012 by RxList Inc.
9. Trontelj, J.; Vovk, T.; Bogataj, M.; Mrhar, A.; Pharmacol. Res. 2005, 52, 334.
10. Pavithra, D. C.; Sivasubramanian, L.; Indian J. Pharm. Sci. 2006, 68, 401.
11. Suneetha, D.; Rao, A. L.; Rasayan J. Chem.2010, 3, 117. 12. Kumar, B. V.; Kumar, K. P.; Suresh, K.; Apsar, S.; Srikanth, P.;
Suneetha, Y.; J. Chem. Pharm. Res.2011, 3, 784.
13. Reddy, P. V.; Rani, B. S.; Babu, G. S.; Rao, J. V. L. N. S.; E-J. Chem.2006, 3, 60.
14. Basavaiah, K.; Kumar, U. R. A.; Tharpa, K.; Acta Pharm.2008,
58,347.
15. Sathyaraj, A.; Satyanarayana, V.; Rao, M. V. B.; Res. J. Chem. Sci. 2011, 1, 9.
16. Basavaiah, K.; Kumar, U. R. A.; Tharpa, K.; Vinay, K. B.; J. Chil. Chem. Soc. 2008, 53, 1635.
17. Basavaiah, K.; Tharpa, K.; Kumar, U. R. A.; Rajedraprasad, N.; Hiriyanna, S. G.; Vinay, K. B.; Arch. Pharm. Res. 2009, 32, 1271. 18. Kalyanaramu, B.; Raghubabu, K.; Kumar, Y. V.; Jagannadharao, V.;
Der Pharma Chemica.2011, 3, 250.
19. Pavithra, D. C.; Sivasubramanian, L.; Indian J. Pharm. Sci. 2006, 68, 375.
20. Annapurna, M. M.; Rao, M. E. B.; Kumar, B. V. V. R.; E-J. Chem.2007, 4, 79.
21. Basavaiah, K.; Kumar, U. R. A.; E-J. Chem.2006, 3, 242. 22. Kalyanaramu, B.; Raghubabu, K.; Int. J. Curr. Pharm. Res.
2011, 3, 62.
23. Kalyanaramu, B.; Raghubabu, K.; Int. J. Anal. Bioanal. Chem. 2011, 1, 29.
24. Kalyanaramu, B.; Raghubabu, K.; J. Chem. Pharm. Res.2011,
3, 122.
25. Pérez-Ruiz, T.; Martínez-Lozano, C.; Sanz, A.; Bravo, E.;
J. Pharm. Biomed. Anal.2004, 34, 891.
26. Fan, L.; Liu, S.-P.; Yang, D.-C.; Hu, X.-L.; Chin. J. Chem.2002,
20, 1552.
27. Kumar, U. R. A.; Basavaiah, K.; Tharpa, K.; Vinay, K. B.; Chem. Ind. Chem. Eng. Q.2009, 15, 119.
28. Trdan, T.; Roškar, R.; Trontelj, J.; Ravnikar, M; Mrhar, A.;
J. Chromatogr., B: Anal. Technol. Biomed. Life Sci. 2011,
879,2323.
29. Trontelj, J.; Bogataj, M.; Marc, J.; Mrhar, A.; J. Chromatogr., B: Anal. Technol. Biomed. Life Sci.2007, 855, 220.
30. Wang, J.; Analytical Electrochemistry, 2nd ed.; Wiley-VCH:
New York, 2000.
31. Britton, H. T. S. In Hydrogen Ions, 4th ed.; Chapman and Hall:
London, 1952.
32. Zuman, P.; The Elucidation of Organic Electrode Processes; Academic Press: New York, 1969.
33. Wang, J.; Electroanalytical Techniques in Clinical Chemistry and Laboratory Medicine; VCH: New York, 1988.
34. Kissinger, P. T.; Heineman, W. R.; Laboratory Techniques in Electroanalytical Chemistry, 2nd ed.; Marcel Dekker: New York,
1996.
35. Bard, A.; Faulkner, L. R.; Electrochemical Methods: Fundamentals and Applications, 2nd ed.; Wiley: New York,
2001.
36. Greef, R.; Peat, R.; Peter, L. M., Pletcher, D.; Robinson, J.;
Instrumental Methods in Electrochemistry; Ellis Horwood
Limited, John Willy & Sons: New York, 1985. 37. Nicholson, R. S.; Shain, I.; Anal. Chem.1964, 36, 706. 38. Meits, L.; Polarographic Techniques, 2nd ed.; Interscience
Publishers: New York, 1965.
39. Rezaei, B.; Zare, S. Z. M.; Sens. Actuators, B2008, 134, 292.
40. Laviron, E.; Roullier, L.; Degrand, C.; J. Electroanal. Chem. 1980, 112, 11.
41. Teeter, J. S.; Meyerhoff, R. D.; Environ. Toxicol. Chem.2002,
21, 729.
42. Kołodziejczak, J.; Jezierska, A.; Panek, J. J.; De Borggraeve, W. M.; Kochel, A.; Jose, R. A.; Koll, A.; J. Mol. Struct. 2008,
891, 184.
43. Freed, A. L.; Strohmeyer, H. E.; Mahjour, M.; Sadineni, V.; Reid, D. L.; Kingsmill, C. A.; Int. J. Pharma.2008, 357, 180. 44. Yardım, Y.; Keskin, E.; Levent, A.; Ozsoz, M.; Senturk, Z.;
Talanta2010, 80, 1347.
45. Turan, O.; Durmus, Z.; Kiliç, E.; Curr. Pharm. Anal.2009, 5, 416.
46. Gupta, V. K.; Jain, R.; Antonijevic, M. M.; Khani, H.; Siddiqui, M. N.; Dwivedi, A.; Mishra, R.; Agarwal, S.; Int. J. Electrochem. Sci.2011, 6, 37.
47. ICH, Q2(R1), Harmonized Tripartite Guideline, Validation of Analytical procedures Text and methodology, International
conference on Harmonization (ICH), Geneva, November, 2005. 48. The United States Pharmacopeial Convention, The United States
Pharmacopeia, USP 33-NF 28, Rockville, 2010.
49. Miller, J. C.; Miller, J. N.; Statistics for Analytical Chemistry, 5th ed.; Ellis-Horwood: New York, 1984.
50. Harris, D. C.; Quantitative chemical analysis, 6th ed.; W. H.
Freeman, New York, 2003.
51. The United States Pharmacopeial Convention, The United States Pharmacopeia, USP 32-NF 27, Rockville, 2009.
52. Christian, G. D.; Analytical Chemistry, 5th ed.; Willey: Hoboken,
NJ, 1994.
Submitted: May 24, 2012